42908 Engineering Project: Preparation of VLC Challenges Literature
VerifiedAdded on 2023/06/04
|15
|3699
|164
Literature Review
AI Summary
This document presents a literature review focused on the challenges of Visible Light Communication (VLC) in indoor environments, particularly in the context of engineering project preparation. It addresses the limitations of LED modulation bandwidth, inter-symbol interference (ISI), and signal-to-noise ratio (SNR) in VLC systems. The review examines previous attempts at traffic flow forecasting, including historical data-based algorithms and time series models, highlighting their strengths and weaknesses. It also discusses the development and evaluation of single and multiple-interval models for traffic flow forecasting, as well as the creation of ITS architectural support systems. The document concludes by emphasizing the need for further research in SNR level handling and modulation techniques to improve the throughput of SDVLC systems, suggesting opportunities for future work in this field. Desklib provides access to this and other solved assignments.

ENGINEERING PROJECT PREPARATION
By Name
Course
Instructor
Institution
Location
Date
By Name
Course
Instructor
Institution
Location
Date
Paraphrase This Document
Need a fresh take? Get an instant paraphrase of this document with our AI Paraphraser

ABSTRACT
In the intelligent transportation system, the capacity to forecast traffic volume has been
considered very important. Traffic volume forecast will definitely contribute to the proactive
control of traffic and exact level of time estimation. It is important to note that the previous
attempts to have such projects succeed have been met with a number of challenges.
This particular study seeks to develop similar models for two sites in the capital city of Nairobi.
Four models were developed and later tested for one particular problem of forecasting. This was
defined as estimation of traffic flow for a period of 15 minutes. The four models that were
considered in the study included time series, historical average, on parametric progression and
finally neural network. In the end of the entire study, it was found that the nonparametric
regression model outperformed other models.
INTRODUCTION
Nairobi and the nation have been facing challenges of transportation of increasing magnitude and
also complexity. Due to the matters that are related to the financial constraints, construction of
facilities and enlargement of already existing ones have become very less attractive. There is an
urgent need to have efficient and very safe system of transportation. This improvement will be
effectively being accomplished through use of intelligent transportation system (ITS).ITS can be
defined as the application of technology of information in the sector of transportation. The
fundamental objective of ITS is to assist in the provision of environment that enables application
of improved decision making on transport system(Chan, Dillon and Chang 2013).
In some cases the traffic agencies can use this system to control signals of traffic and also to
ease congestion in the city that normally results into accidents. Similarly, travellers can use IT’S
in making informed decisions in regard to the travelling time, mode of travel and routes to be
used. In summary, the system will allow society to utilize system of surface transportation more
intelligently leading to safer and more efficient travel.
Although there are lots of benefits of this system, there are risks that are associated with the
same. One of such difficulties includes use of a wide variety of sensors and media of
communication that supports collection of data and subsequent application as already found in
the market. The software systems that are used in the analysis and processing of data have not
fully advanced. Such systems are very important since they provide real intelligent in the ITS.As
specialist of traffic control may not be expected to do a selection of optimal timing of signals that
are based on improper vehicle counts( Zhang and Haghani 2014).
⊘ This is a preview!⊘
Do you want full access?
Subscribe today to unlock all pages.
Trusted by 1+ million students worldwide

Also, travellers cannot be expected to properly identify an optimal route to the destination as
indicated by such counts. It is very obvious that advanced tools of analysis which may include
artificial intelligence, optimization and simulation may be required. The traffic flow prediction
provides the ability to estimate future traffic volume that is measured in the units of vehicles per
hour.
PURPOSE AND AIM
The main aim of this study was to investigate the feasibility of forecasting freeway traffic and to
construct a structure that supports use of forecasting capability in the traffic management and
services of traveller information. All the data used to construct and support evaluation of
candidate forecasting model were collected at the department of transport. This was done so as to
ensure that the developed model becomes compatible with the future movement systems of
traffic and also with the existing traffic systems.
LITERAURE REVIEW
Previous attempts at Traffic Flow Forecasting
The process of traffic flow forecasting has had unsatisfying attempts in the research history.
Most of these trials have been using signals to develop in the control of systems. Urban traffic
control system is one of such cases. In this particular system there is limitation on the number of
the freeway traffic flow. Prediction of traffic is done using different approaches that are largely
dependent on the well-defined patterns. The classification of the previous traffic flow can be
done using different cartegories.These categories are time series models and historical data based
algorithms(Xia et al 2014).
Paraphrase This Document
Need a fresh take? Get an instant paraphrase of this document with our AI Paraphraser

Historical Data based Algorithms
The main concept or idea behind the use of algorithm is that the patterns of traffic is very
cyclical. This implies that the knowledge on data for traffic that is used on a particular day say
Tuesday will be used on the other future Tuesdays. This was the case of the AUTOGUIDE
project for demonstration that was used in the London. The generated data was able to predict
the travel times based on the time of the day.
UTCS uses prediction of traffic condition in the control of a proactive manner. In the broad
consideration, this technique relies on the historical data for prediction. The major disadvantages
of this particular system is that an extensive set of data is needed. This possibly make is difficult
to have it installed in a new setting. The prediction capabilities of the system has been constantly
been enhanced in the other generations especially the second phase(Cong, Wang and Li 2016).
The advanced system uses the present measures of traffic to correct the deviation from the
collected patterns. In the application process if the current traffic volumes are observed to be
below the required normal one, the next period is scaled so as to reflect the current conditions.
The historical data based algorithm has been abandoned in the third generation. This generation
make prediction that are based on the current traffic measurements. The results that have been
obtained indicates that the performance of UTCS3 is lower as compared to that of UTCS-2 since
it is not capable of performing at the modern level(Wang,Deng and Guo 2014).
Time series model
The management of the traffic flow uses detectors to measure the traffic flow at a particular
time, t.This is usually defined as the function x(t).A channel or combination of the stored data
can be used in the prediction of traffic flow at the time interval t+D in which D is the interval of

prediction. The prediction problem is formulated as x(t+D),given that x(t),x(t-D0,x(t-2D) and so
on. This particular formulation describes a time series.
The time series has been modeled using different statistical techniques. The researchers have
used many of these techniques in the prediction of traffic control. The Jenkins and Box is widely
use technique in the specification of a variety of time series models. The most common known is
that auto integrated moving average method .It is denoted as ARIMA.This model requires very
little time for computation in order to facilitate execution. This particular quality is very
attractive in the time management of traffic. It is important to note that not much application has
been witnessed in its application. The trials have ARIMA models replaced with UTCS gave
unsatisfactory results that was associated with errors(Chan, Dillon, Singh and Chang 2012).
METHODS
In order to accomplish the objectives of the task, the following tasks were undertaken.
Review of the available contents of literature
Data collection
Development of single interval model and subsequent evaluation
Multiple model development and evaluation
ITS software development
Data were collected to assist in the construction and subsequent evaluation of the flow of traffic
forecasting models at two different sites. These sites were monitored by TMS.The sections that
⊘ This is a preview!⊘
Do you want full access?
Subscribe today to unlock all pages.
Trusted by 1+ million students worldwide
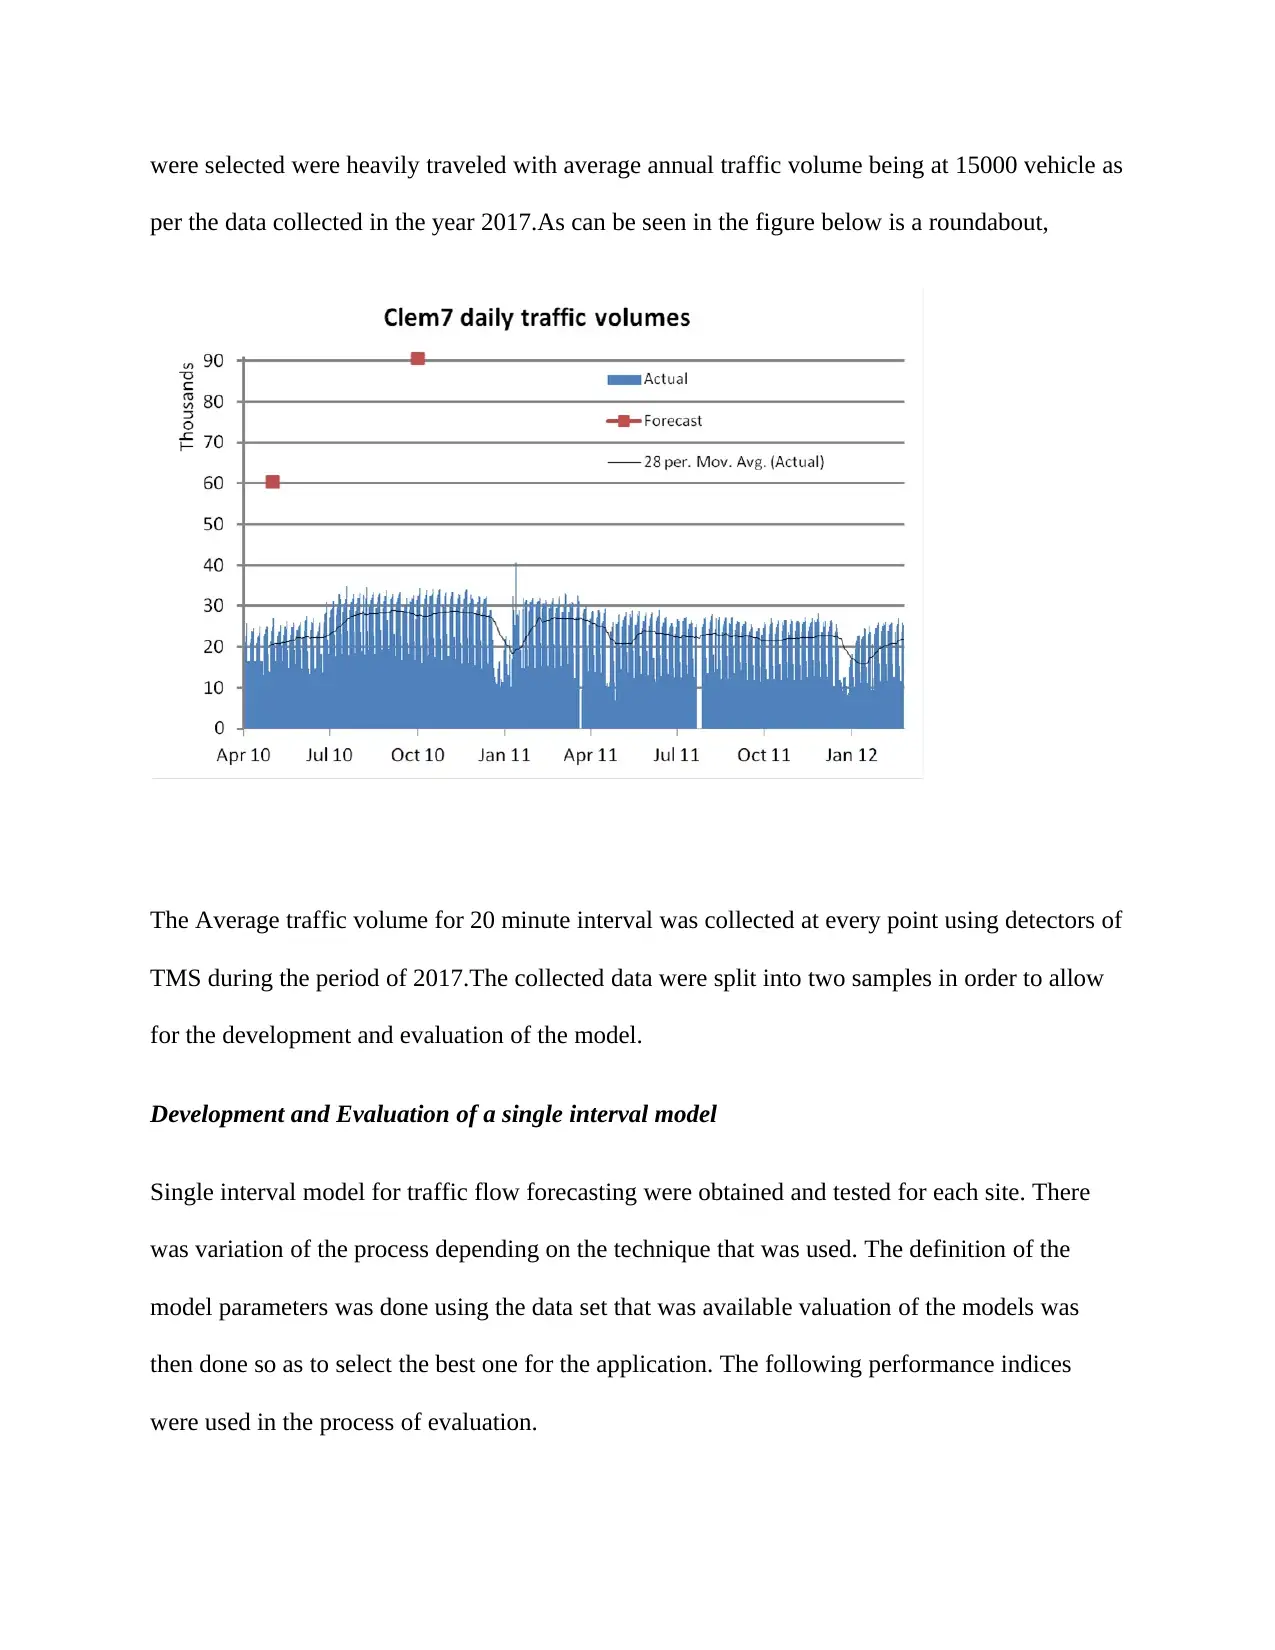
were selected were heavily traveled with average annual traffic volume being at 15000 vehicle as
per the data collected in the year 2017.As can be seen in the figure below is a roundabout,
The Average traffic volume for 20 minute interval was collected at every point using detectors of
TMS during the period of 2017.The collected data were split into two samples in order to allow
for the development and evaluation of the model.
Development and Evaluation of a single interval model
Single interval model for traffic flow forecasting were obtained and tested for each site. There
was variation of the process depending on the technique that was used. The definition of the
model parameters was done using the data set that was available valuation of the models was
then done so as to select the best one for the application. The following performance indices
were used in the process of evaluation.
Paraphrase This Document
Need a fresh take? Get an instant paraphrase of this document with our AI Paraphraser
Models ability to produce a very a curate and possibly reliable forecast
Ability of the model to avoid visible cases of overestimation or under estimation of the
volume of the traffic.
Consistency of the results of the models at the selected two sites.
The possibility of calibration of the model
Development and subsequent evaluation of the multiple-Interval models
By using a single interval model that had been selected, a multiple-interval traffic flow
forecasting model, the interval for estimation was set at every 15minutes.The results were
displayed after very set time that is ;t+15mins.The repeated process assisted in the development
of data set that as used in the evaluation. The evaluation of the data was based on the following
performance indices;
Consistency of the results of the models at the selected two sites.
The possibility of calibration of the model
Models ability to produce a very a accurate and possibly reliable forecast
Ability of the model to avoid visible cases of overestimation or under estimation of the
volume of the traffic.
Development of ITS architectural support system
A software architecture assist in the definition of the components functionality. It will also give
the details of connections that exist between the components. The software that was developed
could properly use the already generated multiple-interval traffic flow forecasting model. The
achievement of this particular process was through identification of the requirements of ITS .The
key factors that were under consideration included generic ITS system and available decision
Ability of the model to avoid visible cases of overestimation or under estimation of the
volume of the traffic.
Consistency of the results of the models at the selected two sites.
The possibility of calibration of the model
Development and subsequent evaluation of the multiple-Interval models
By using a single interval model that had been selected, a multiple-interval traffic flow
forecasting model, the interval for estimation was set at every 15minutes.The results were
displayed after very set time that is ;t+15mins.The repeated process assisted in the development
of data set that as used in the evaluation. The evaluation of the data was based on the following
performance indices;
Consistency of the results of the models at the selected two sites.
The possibility of calibration of the model
Models ability to produce a very a accurate and possibly reliable forecast
Ability of the model to avoid visible cases of overestimation or under estimation of the
volume of the traffic.
Development of ITS architectural support system
A software architecture assist in the definition of the components functionality. It will also give
the details of connections that exist between the components. The software that was developed
could properly use the already generated multiple-interval traffic flow forecasting model. The
achievement of this particular process was through identification of the requirements of ITS .The
key factors that were under consideration included generic ITS system and available decision

makers. The extraction of the information was achieved through use of analysis functions. The
organization of the functions was done to assist in the transformation of ITS data into the
information that was usable in activities of decision making(Li, Shen and Xiong 2012).
DISCUSSION AND RESULTS
Model development
The nonparametric regression algorithm was changed slightly so as to meet the requirements of
the multiple traffic interval control so as to check on the forecasting problem. The modifications
were necessary to allow for the prediction of the volumes of traffic in multiples as opposed to the
single cases. The programming of C was used to have the entire algorithm executed. The
definition of the K value was determined using the same steps in the single interval model. In
this particular case the value of k that was used was 3.
Model evaluation
This particular model was applied on each day as early 5A.M to 7PM .The interval that was used
was at 15mins.The estimate that was obtained was a series of volumes for the rest of the days
that was remaining. For example at a time of 1 P.M, the model would do the forecasting at
7:15P.M and also at 7:30P.M.The errors were managed at interval of four that cumulatively led
to four hours(Lippi, Bertini and Frasconi 2013).
Error interval in hrs. Forecast time in the error interval
1 X+15,x+30,x+45,X+60,
2 X+75,X+90,X+105,X+120
3 X+135,X+150,X+165,X+180
⊘ This is a preview!⊘
Do you want full access?
Subscribe today to unlock all pages.
Trusted by 1+ million students worldwide
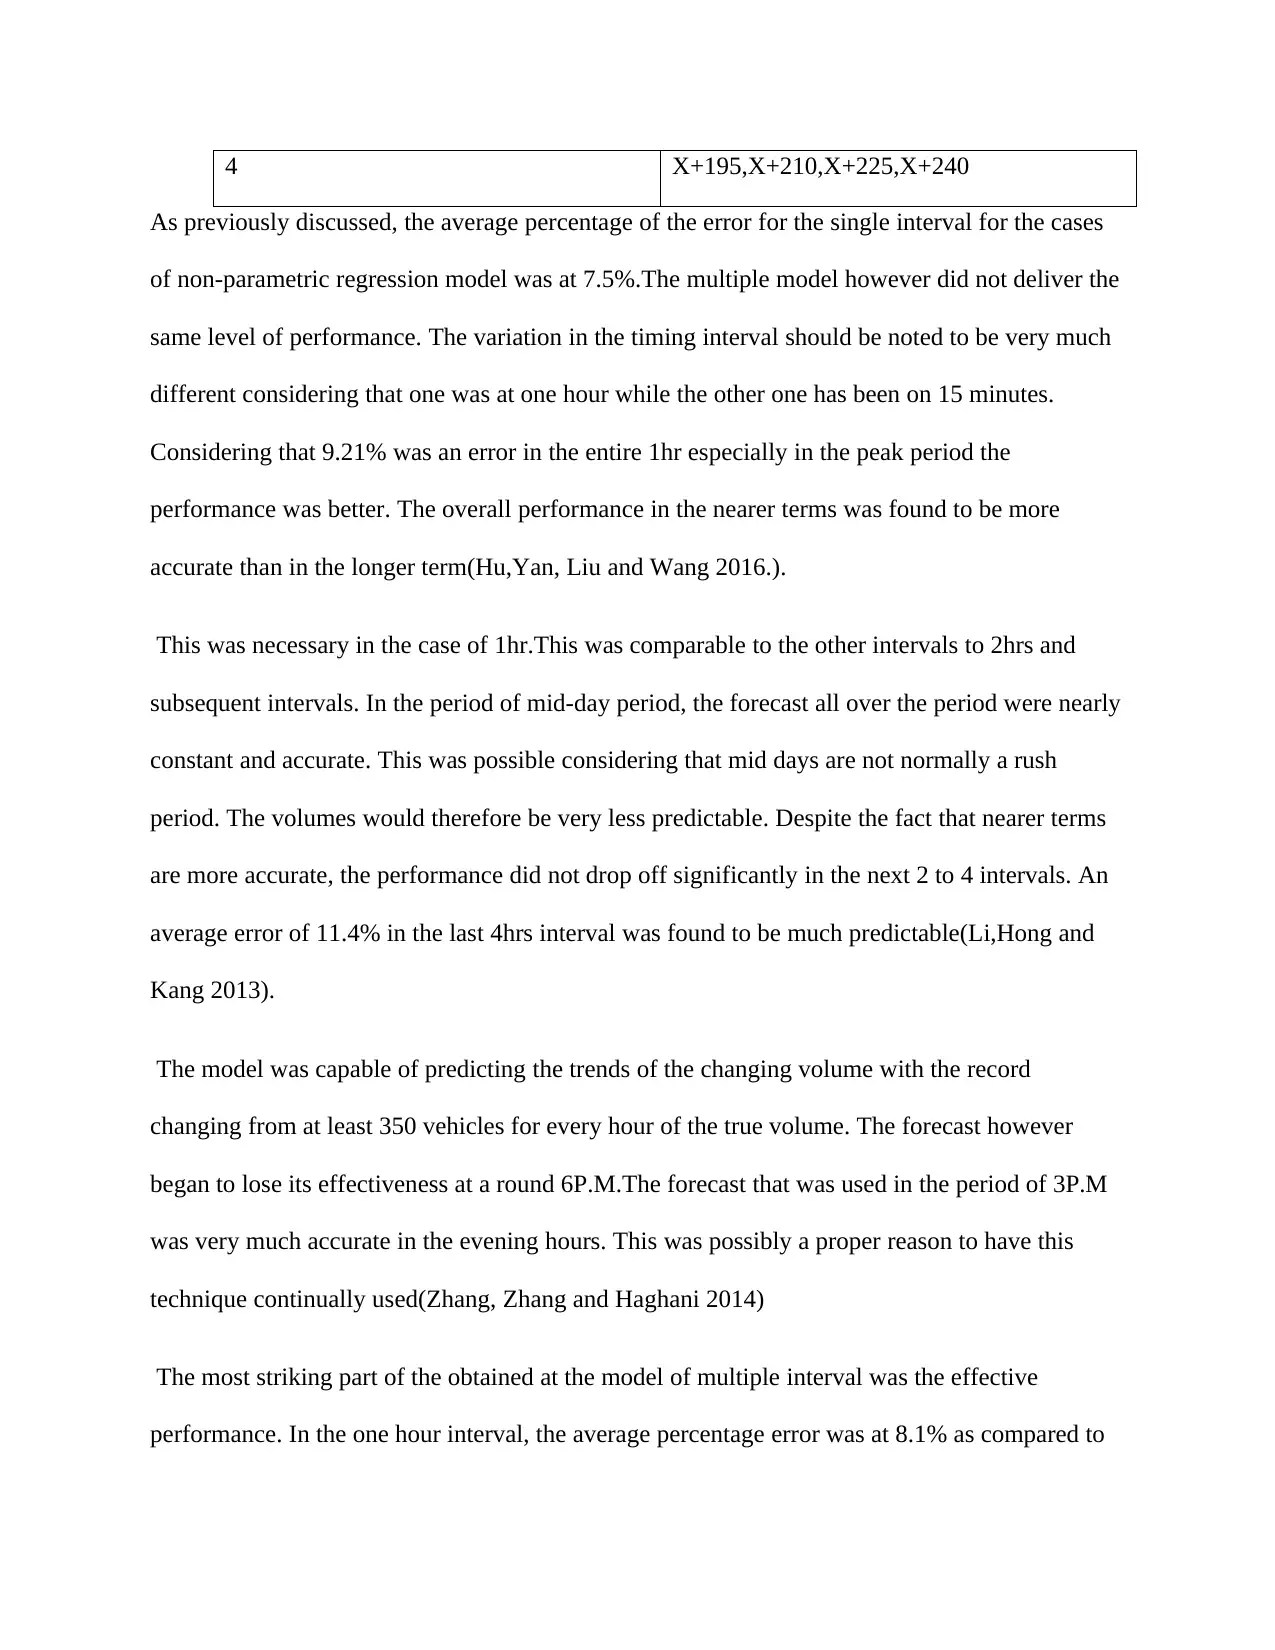
4 X+195,X+210,X+225,X+240
As previously discussed, the average percentage of the error for the single interval for the cases
of non-parametric regression model was at 7.5%.The multiple model however did not deliver the
same level of performance. The variation in the timing interval should be noted to be very much
different considering that one was at one hour while the other one has been on 15 minutes.
Considering that 9.21% was an error in the entire 1hr especially in the peak period the
performance was better. The overall performance in the nearer terms was found to be more
accurate than in the longer term(Hu,Yan, Liu and Wang 2016.).
This was necessary in the case of 1hr.This was comparable to the other intervals to 2hrs and
subsequent intervals. In the period of mid-day period, the forecast all over the period were nearly
constant and accurate. This was possible considering that mid days are not normally a rush
period. The volumes would therefore be very less predictable. Despite the fact that nearer terms
are more accurate, the performance did not drop off significantly in the next 2 to 4 intervals. An
average error of 11.4% in the last 4hrs interval was found to be much predictable(Li,Hong and
Kang 2013).
The model was capable of predicting the trends of the changing volume with the record
changing from at least 350 vehicles for every hour of the true volume. The forecast however
began to lose its effectiveness at a round 6P.M.The forecast that was used in the period of 3P.M
was very much accurate in the evening hours. This was possibly a proper reason to have this
technique continually used(Zhang, Zhang and Haghani 2014)
The most striking part of the obtained at the model of multiple interval was the effective
performance. In the one hour interval, the average percentage error was at 8.1% as compared to
Paraphrase This Document
Need a fresh take? Get an instant paraphrase of this document with our AI Paraphraser
the previous 8.5%.This clearly indicates that the modification on the single interval to obtain
characteristics of the multiple interval clearly gave short term performance which was better. The
short term performance suffered from little deterioration. The model performed even much better
at some points of the roads than others. The error levels were reduced on average by 1.5% in
general(Mai, Ghosh and Wilson 2012).
The variation or the difference in the error could not be attributed to just one factor. The data
variations in the error could be overcome at a more extensive data collection sites. The other
possible reason is that some sections of the road could be operating at a more capacity during the
peak periods. This might have reduced the variability and thus allowed for the more accurate
forecasting. Regardless of the type of the model, the performance of the model was averagely
better and this indicated that it could be installed at any point of the road section(Hong 2012).
Development of ITS software support System Architecture.
The development of this supportive software was found to be very much feasible and also
practical. It was however discovered that when such models are taken alone, the model is of
limited use to the community of transportation. The daily decisions by the individual travellers
will be very difficult when the data are provided in their raw form. There is need to identify a
frame work that will assist in the full utilization of the contained information,. The structure of
the simple ITS structure is as shown in the diagram below. The traffic module of the volume
forecast is considered as the central point of this particular architecture. The output that is
produced by this system serves as the input to other modules. This combination ensure that there
is provision of a perfect and high quality information to the operator(Abdi, Moshiri, Abdulhai
and Sedigh 2012).
Data layer
The layer for data is made of raw traffic volumes of data that was collected and later stored by
the infrastructure of surveillance. In very particular, this layer has detectors of the vehicle
themselves. This will also include communications and database that will keep the previous
volume reported by the detectors.
Analysis layer
This layer extract information from the data that is considered raw. In this particular layer, the
operation of the structure is at the center. This module provides other modules with very valuable
information in the subsequent analysis. The detection of the incidence will always look for the
changes that are unexpected in the conditions of the traffic. Such information would always
signify disturbance in the flow of the traffic. By providing this relevant information quickly, the
decision regarding the changes can be made and subsequently minimize the impact of possible
disturbulances.In some cases the system just do a comparison of the current condition with the
historical conditions in the confirmation as to whether the facility is operating ate the required
parameter. The present of the conditions of the forecast may help in the provision of very proper
estimates of the performance(Guo,Huang and Williams 2014).
Information layer
This is where the results of the analysis are properly merged with other that have been sourced
from outside. The information from outside may include the reports from the police.The main
aim of this particular layer is to provide the most conducive and also very supportive
environment for the decision making in the system of transport.
⊘ This is a preview!⊘
Do you want full access?
Subscribe today to unlock all pages.
Trusted by 1+ million students worldwide
1 out of 15
Related Documents


Your All-in-One AI-Powered Toolkit for Academic Success.
+13062052269
info@desklib.com
Available 24*7 on WhatsApp / Email
![[object Object]](/_next/static/media/star-bottom.7253800d.svg)
Unlock your academic potential
Copyright © 2020–2026 A2Z Services. All Rights Reserved. Developed and managed by ZUCOL.