Environmental Engineering: Algae Removal in Water Treatment Plant
VerifiedAdded on 2022/08/24
|14
|12244
|23
Project
AI Summary
This project examines the application of enhanced coagulation (EC) for algae removal in the Sidi-Amar water treatment plant, which sources water from the Boukerdene Dam in Algeria. The study investigates the physicochemical and biological parameters of the water, with a focus on phytoplankton. The research demonstrates the effectiveness of EC, specifically jar tests with a pH of 6 and an alum dose of 15 mg/L, in removing algae and organic matter (OM) by 97-99% without chlorination or filtration. The project highlights the limitations of conventional treatment methods and the benefits of EC in reducing disinfection by-products (DBPs) and improving water quality. The study also discusses the presence of various algae species, including those causing taste and odor issues, and the impact of natural organic matter (NOM) on water treatment processes. The findings underscore the potential of EC as an efficient and economical solution for enhancing water treatment in the region.
See discussions, stats, and author profiles for this publication at: https://www.researchgate.net/publication/322264486
Enhanced Coagulation for Algae Removal in a Typical Algeria Water Treatment
Plant
Article in Environmental engineering and management journal · October 2017
DOI: 10.30638/eemj.2017.238
CITATIONS
31
READS
199
7 authors, including:
Some of the authors of this publication are also working on these related projects:
University of Blida, Chemical Engineering DepartmentView project
COST Action ES1403: New and emerging challenges and opportunities in wastewater reuse (NEREUS)View project
Djamel Ghernaout
University of Hail
114PUBLICATIONS2,536CITATIONS
SEE PROFILE
Abdelmalek Badis
Saad Dahlab University, of Blida 1, Algeria
64PUBLICATIONS1,069CITATIONS
SEE PROFILE
Ahmed Boucherit
Saad Dahlab University
30PUBLICATIONS523CITATIONS
SEE PROFILE
All content following this page was uploaded by Djamel Ghernaout on 01 November 2018.
The user has requested enhancement of the downloaded file.
Paraphrase This Document
Need a fresh take? Get an instant paraphrase of this document with our AI Paraphraser
Environmental Engineering and Management Journal October 2017, Vol. 16, No. 10, 2303-2315
http://omicron.ch.tuiasi.ro/EEMJ/
“Gheorghe Asachi” Technical University of Iasi, Romania
ENHANCED COAGULATION FOR ALGAE REMOVAL
IN A TYPICAL ALGERIA WATER TREATMENT PLANT
Djamel Ghernaout1,2,3∗, Abdelmalek Badis3, Ghania Braikia3, Nadjet Matâam3,
Moussa Fekhar4, Badiaa Ghernaout5, Ahmed Boucherit3
1Binladin Research Chair on Quality and Productivity Improvement in the Construction Industry, College of Engineering,
University of Ha’il, PO Box 2440, Ha’il 81441, Saudi Arabia
2Department of Chemical Engineering, College of Engineering, University of Ha’il, PO Box 2440, Ha’il 81441, Saudi Arabia
3Saad Dahlab University of Blida, Chemical Engineering Department, Blida 09000, Algeria
4Algerian Waters, Tipaza Area, Tipaza 42000, Algeria
5Laboratory of Mechanics (LME), Department of Mechanical Engineering, University of Laghouat, PO Box 37G,
Laghouat 03000, Algeria
Abstract
This work aims to study the physicochemical and biological parameters of Boukerdene Dam’s water and treated water at
different steps of the treatment processes in Sidi-Amar’s Station (Tipaza, Algeria) with a particular interest to the phytoplankton.
This work is also related to the demonstration of the enhanced coagulation (EC) process as an efficient method in algae and
organic matter (OM) removal from surface water by its application in jar tests. The diversity of the phytoplankton shows the
presence of 21 genera comprising 30 algae species out of 8 samples taken from the Boukerdene Dam. Among the identified
genera, seven of them are responsible for the unpleasant tastes and odours of water; six others are responsible for filter fouling.
Generally, the conventional drinking water treatment processes employed at this water treatment plant shows a limited efficiency
of OM and algae removal. The novelty of this work is that the jar tests of EC (pH 6 and alum dose 15 mg L -1) as only one stage
of water treatment, without chlorination and filtration, improve the removal of OM and algae at 97 to 99%, respectively.
Keywords: algae, bacteria, enhanced coagulation (EC), natural organic matter (NOM), surface water
Received: February, 2013; Revised final: February, 2014; Accepted: February, 2014
∗Author to whom all correspondence should be addressed: e-mail: djamel_andalus@yahoo.fr; Phone/Fax: +213 25433631
1. Introduction
Since trihalomethanes (THMs) were found in
disinfected water using chlorine in the 1970s by
Rook (1974), disinfection by-products (DBPs) have
become a center of awareness in water treatment. In
fact, more than 700 species of DBPs have been
affirmed. Among DBPs, THMs and haloacetic acids
(HAAs) were the two DBP groups detected at the
greatest levels and most frequently found in
disinfected water using chlorine through the world
(Hong et al., 2013). In addition, the important DBP
precursor was usually suggested to be natural organic
matter (NOM). NOM is known as the complicated
matrix of naturally existing organic materials
detected in natural waters (Boucherit et al., 2015;
Ghernaout et al., 2011; Ghernaout and Boucherit,
2015). Indeed, the NOM may notably influence
several features of water treatment, comprising the
coagulation efficiency and disinfectants use
(Ghernaout et al., 2010a). Consequently, NOM
impacts drinking water quality by participating in
DBPs formation, biological re-growth in the
distribution system, colour, taste, and odour
generation (Chen et al., 2008; Wang et al., 2013).
In Algeria (North of Africa), it is well known
that water resources are basically surface waters
(Ghernaout et al., 2010b). In Tipaza City (North of
Ghernaout et al./Environmental Engineering and Management Journal 16 (2017), 10, 2303-2315
Algeria), potable water is provided mostly from one
big surface water source of Boukerdene Dam and the
raw water is transferred to the water treatment plant
(Sidi-Amar’s Station, SAS) for treatment operations.
Raw water is treated to satisfy the World Health
Organisation (WHO) and Algerian water quality
standards. Chlorine is employed for organic matter
(OM) pre-oxidation. Moreover, chlorine is as well
added as the final step of water treatment chain.
However, OM chlorination in fresh water results in
formation of DBPs (Ghernaout, 2017; Ghernaout et
al., 2014; Uyak and Toroz, 2007; Uyak et al., 2007).
On the other hand, the important portion of aquatic
NOM is constituted of humic substances (HS). These
macromolecular compounds have been illustrated to
be particularly responsive with a range of oxidants
and disinfectants that are employed during the
treatment of potable water, especially chlorine
(Ghernaout, 2014; Slavik et al., 2012). In fact, HS
interact with chlorine species (OCl-/HOCl) to
generate THMs, HAAs and other halogenated DBPs
(Bekbolet et al., 2005; Kristiana et al., 2013).
Algae are abundant and diverse in drinking
water supplies including lakes, reservoirs, rivers, and
streams (Ghernaout and Ghernaout, 2012b).
Occasional algal blooms, comprised of blue-green
(B-G) algae (cyanobacteria) and/or green algae,
cause significant challenges in drinking water
treatment due to the release of organic compounds
(algogenic organic matter, AOM) into water
extracellularly and, upon cell lysis, intracellularly
(Ghernaout et al., 2010b; Her et al., 2004). Besides,
algae are photosynthetic, aquatic plants that utilise
inorganic nutrients such as nitrogen and phosphorus.
Cyanobacteria are typically referred to as B-G algae
because they perform photosynthesis and are similar
in size and colour, even though they are bacteria.
Furthermore, algal cells and associated AOM are
THM precursors, which have resulted in the
restriction of chlorine usage. Similarly, the potential
for toxin release by cyanobacteria, in particular from
Microcystis, has resulted in the WHO setting a
guideline value of 1 μg L -1 for the associated toxin,
microcystin-LR (MCLR) (Henderson et al., 2008).
Another problem of the presence of offensive
taste and odour compounds, including 2-
methylisoborneol (2-MIB) and geosmin in the
resultant drinking water supply, has also been
attributed to high alga populations (Henderson et al.,
2008). Unfortunately, surface water drinking supplies
are also particularly vulnerable to the growth of these
organisms and current US drinking water treatment
practices, as an example, do not monitor or actively
treat for B-G algal toxins including the microcystins.
Besides, harmful algal blooms (HABs) represent a
significant threat to fisheries, public health, and
economies around the world and have increased in
frequency, duration, and distribution in recent
decades (Gobler et al., 2008). On the other hand,
algae are traditionally characterised according to
differences in pigmentation and cell complexity
arising as a result of evolution. Within a particular
phylum, the species can vary significantly in terms of
their morphology and other important functionalities
including the composition and quantity of excreted
extracellular organic matter (EOM). Algae are
typically removed using the following treatment
chain: coagulation/flocculation (C/F) and
clarification either by dissolved air flotation (DAF)
or sedimentation, followed by granular media
filtration. Direct filtration can also be used as a
clarification process. More recently, ozone and
granular activated carbon (GAC) filters have been
installed downstream of clarification, primarily for
pesticide removal (Henderson et al., 2008).
Ultrafiltration (UF) technology, as a promising
substitute technique to classical, may eliminate algae
totally. Nevertheless, transmembrane pressure sorely
augments or flux diminishes throughout algae bloom
for UF application. Moreover, the algal cells liberate
the extracellular polymeric substances (EPS), which
conduct to permeability decrease and more elevated
energy requirements for preserving a fixed permeate
flux. The excretion of EPS depends on algal types.
These EPS play an important role in UF fouling
(Liang et al., 2008).
Classical water treatment technology,
consisting of C/F, decantation and sand-filtration, has
been the greatest frequent one for NOM elimination
from the natural waters (Ghernaout et al., 2011). The
performance of NOM elimination during coagulation
process is highly influenced by several parameters,
such as: nature and properties of NOM particles, type
and dose of coagulant, pH, ionic strength and
temperature (Ghernaout et al., 2015a). In addition, a
fraction of the coagulant (metal salts) that has been
introduced to water is not eliminated troughout the
treatment and remains present in the potable water.
The amendment of the coagulation technique to
obtain higher NOM reductions is named “enhanced
coagulation” (EC) (Ghernaout et al., 2009). EC
correlates with the employment of coagulant
injections efficient for total organic carbon (TOC)
elimination (Uyak and Toroz, 2007). Nevertheless,
an additional alternative of EC has been suggested to
establish performant decrease in DBP generation by
employing an enlarged principle of EC. In fact, in
EC, both the coagulant injection and the coagulation
pH can be well conceived to importantly decrease the
coagulant requirement at the same time augmenting
NOM elimination (Xiao et al., 2013).
Therefore, the most efficient action plan to
decrease the generation of DBPs would be to
diminish the quantity of NOM which is the principal
generator of DBPs, prior to disinfection using
chlorine. EC has been observed to be very
performant in the elimination of NOM from surface
waters, by that means decreasing DBP generation
and reducing chlorine need. Nevertheless, the
shortages of EC comprise the augmented cost of
chemical products, elevated sludge formation, lower
pH conditions (influencing corrosion monitoring),
and augmented treatment chemical products like
aluminium or iron in potabilzed water (Zhang et al.,
2304
⊘ This is a preview!⊘
Do you want full access?
Subscribe today to unlock all pages.
Trusted by 1+ million students worldwide
Enhanced coagulation for algae removal in a typical Algeria water treatment plant
2012). Regardless of these observed deficiencies, EC
remains contemplated to be the best available
technology (BAT) and the most economical manner
of eliminating generator (i.e., NOM) matter (Uyak
and Toroz, 2007; Xiao et al., 2013).
Further, it was summarised that the major
mechanisms by which NOM can be removed by
coagulation involve charge neutralisation (CN) of
colloidal NOM, precipitation as humates or fulvates,
and coprecipitation by adsorption on the metal
hydroxide (Uyak and Toroz, 2007). Precipitation of
NOM corresponds to the generation of Al- or Fe-
humate with a lower solubility product (Zhang et al.,
2012). The level of NOM elimination using
coagulation is influenced by the type and injection of
coagulants and the pH. The performance of a selected
coagulant to eliminate NOM can change with the
energetic charge density, the floc surface area free for
adsorption, and the type of the bonds among the
NOM and the metal hydroxide flocs (Uyak and
Toroz, 2007; Ghernaout et al., 2015b). Lower pH
reduces the charge density of NOM, making them
more hydrophobic (adsorbable) (Alexander et al.,
2012; Xiao et al., 2013).
Consequently, coagulation removes humic
and high molecular weight OM better than it removes
non humic and low molecular weight OM. Thus, non
humic fraction of NOM can be removed by using
adsorption process. Powdered activated carbon
(PAC) is used for removal of low molecular weight
organics and taste-odour causing materials in raw
water. There are several advantages to adding PAC
during EC which may have greater DBP precursors
removal capacities (Uyak et al., 2007).
In this research, the focus is accorded to SAS
since disagreeable taste-odour manifestation in the
tap water and not well optimized employment of the
PAC in the Station throughout 2006 summer. These
issues evoked consumer’s doubt and attracted the
attention on the treatment stages applied in SAS.
Consequently, a performant and economical solution
must be suggested. First, a physicochemical and
biological comparison between the Boukerdene
Dam’s water and the Station’s treated water is
performed. Secondly, the determination of
responsible agents of disagreable tastes in the
potabilized water is done. Finally, EC tests using jar
tests in the laboratory, where pH is slightly acidified
(pH 6) for the optimised coagulant dose using the
conventional coagulation (CC) procedure, are
realised proving that this process may be the efficient
solution for this Station.
2. Experimental
2.1. Source waters collection
The natural water sources used in this study
are Boukerdene Dam’s waters. Boukerdene Dam was
constructed in 1986 and is located at 1.3 km to SAS.
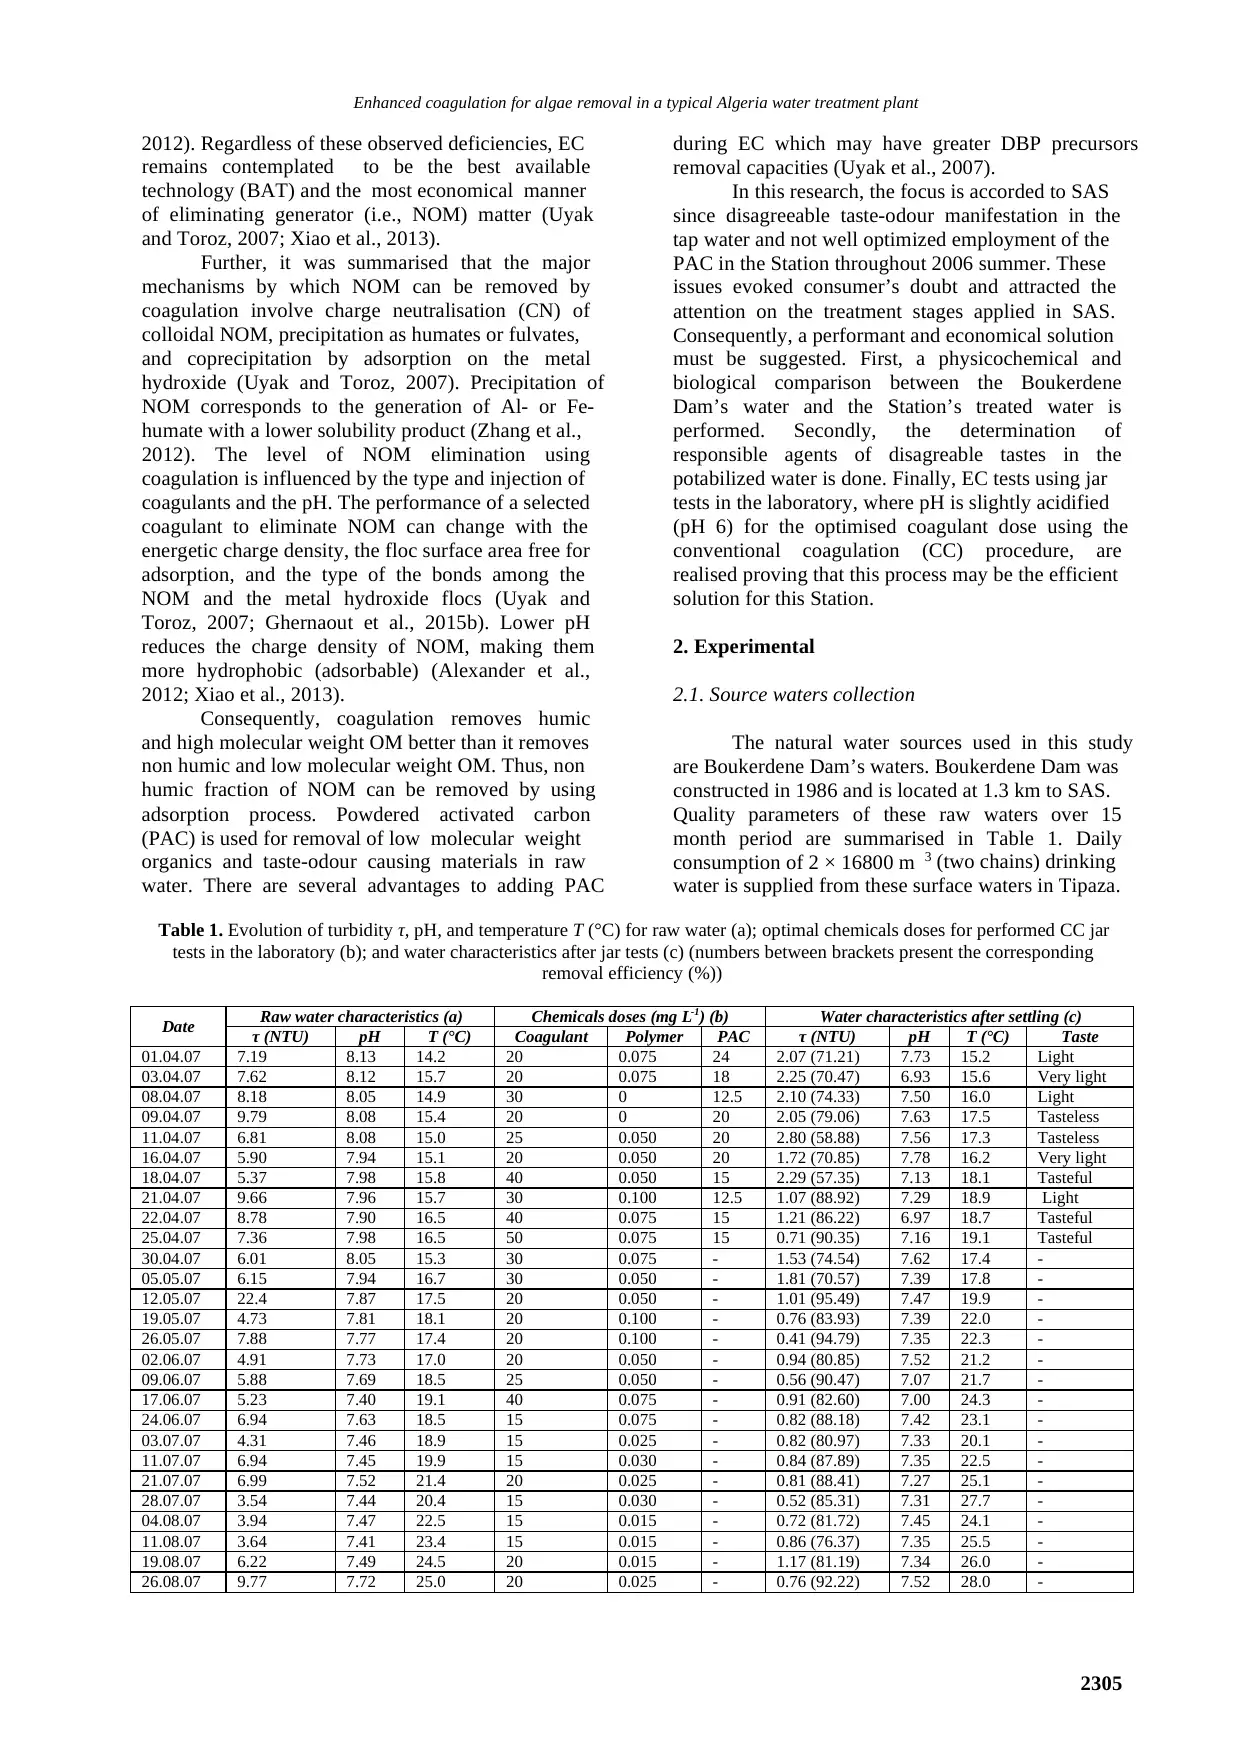
Quality parameters of these raw waters over 15
month period are summarised in Table 1. Daily
consumption of 2 × 16800 m 3 (two chains) drinking
water is supplied from these surface waters in Tipaza.
Table 1. Evolution of turbidity τ, pH, and temperature T (°C) for raw water (a); optimal chemicals doses for performed CC jar
tests in the laboratory (b); and water characteristics after jar tests (c) (numbers between brackets present the corresponding
removal efficiency (%))
Date Raw water characteristics (a) Chemicals doses (mg L-1) (b) Water characteristics after settling (c)
τ (NTU) pH T (°C) Coagulant Polymer PAC τ (NTU) pH T (°C) Taste
01.04.07 7.19 8.13 14.2 20 0.075 24 2.07 (71.21) 7.73 15.2 Light
03.04.07 7.62 8.12 15.7 20 0.075 18 2.25 (70.47) 6.93 15.6 Very light
08.04.07 8.18 8.05 14.9 30 0 12.5 2.10 (74.33) 7.50 16.0 Light
09.04.07 9.79 8.08 15.4 20 0 20 2.05 (79.06) 7.63 17.5 Tasteless
11.04.07 6.81 8.08 15.0 25 0.050 20 2.80 (58.88) 7.56 17.3 Tasteless
16.04.07 5.90 7.94 15.1 20 0.050 20 1.72 (70.85) 7.78 16.2 Very light
18.04.07 5.37 7.98 15.8 40 0.050 15 2.29 (57.35) 7.13 18.1 Tasteful
21.04.07 9.66 7.96 15.7 30 0.100 12.5 1.07 (88.92) 7.29 18.9 Light
22.04.07 8.78 7.90 16.5 40 0.075 15 1.21 (86.22) 6.97 18.7 Tasteful
25.04.07 7.36 7.98 16.5 50 0.075 15 0.71 (90.35) 7.16 19.1 Tasteful
30.04.07 6.01 8.05 15.3 30 0.075 - 1.53 (74.54) 7.62 17.4 -
05.05.07 6.15 7.94 16.7 30 0.050 - 1.81 (70.57) 7.39 17.8 -
12.05.07 22.4 7.87 17.5 20 0.050 - 1.01 (95.49) 7.47 19.9 -
19.05.07 4.73 7.81 18.1 20 0.100 - 0.76 (83.93) 7.39 22.0 -
26.05.07 7.88 7.77 17.4 20 0.100 - 0.41 (94.79) 7.35 22.3 -
02.06.07 4.91 7.73 17.0 20 0.050 - 0.94 (80.85) 7.52 21.2 -
09.06.07 5.88 7.69 18.5 25 0.050 - 0.56 (90.47) 7.07 21.7 -
17.06.07 5.23 7.40 19.1 40 0.075 - 0.91 (82.60) 7.00 24.3 -
24.06.07 6.94 7.63 18.5 15 0.075 - 0.82 (88.18) 7.42 23.1 -
03.07.07 4.31 7.46 18.9 15 0.025 - 0.82 (80.97) 7.33 20.1 -
11.07.07 6.94 7.45 19.9 15 0.030 - 0.84 (87.89) 7.35 22.5 -
21.07.07 6.99 7.52 21.4 20 0.025 - 0.81 (88.41) 7.27 25.1 -
28.07.07 3.54 7.44 20.4 15 0.030 - 0.52 (85.31) 7.31 27.7 -
04.08.07 3.94 7.47 22.5 15 0.015 - 0.72 (81.72) 7.45 24.1 -
11.08.07 3.64 7.41 23.4 15 0.015 - 0.86 (76.37) 7.35 25.5 -
19.08.07 6.22 7.49 24.5 20 0.015 - 1.17 (81.19) 7.34 26.0 -
26.08.07 9.77 7.72 25.0 20 0.025 - 0.76 (92.22) 7.52 28.0 -
2305
2012). Regardless of these observed deficiencies, EC
remains contemplated to be the best available
technology (BAT) and the most economical manner
of eliminating generator (i.e., NOM) matter (Uyak
and Toroz, 2007; Xiao et al., 2013).
Further, it was summarised that the major
mechanisms by which NOM can be removed by
coagulation involve charge neutralisation (CN) of
colloidal NOM, precipitation as humates or fulvates,
and coprecipitation by adsorption on the metal
hydroxide (Uyak and Toroz, 2007). Precipitation of
NOM corresponds to the generation of Al- or Fe-
humate with a lower solubility product (Zhang et al.,
2012). The level of NOM elimination using
coagulation is influenced by the type and injection of
coagulants and the pH. The performance of a selected
coagulant to eliminate NOM can change with the
energetic charge density, the floc surface area free for
adsorption, and the type of the bonds among the
NOM and the metal hydroxide flocs (Uyak and
Toroz, 2007; Ghernaout et al., 2015b). Lower pH
reduces the charge density of NOM, making them
more hydrophobic (adsorbable) (Alexander et al.,
2012; Xiao et al., 2013).
Consequently, coagulation removes humic
and high molecular weight OM better than it removes
non humic and low molecular weight OM. Thus, non
humic fraction of NOM can be removed by using
adsorption process. Powdered activated carbon
(PAC) is used for removal of low molecular weight
organics and taste-odour causing materials in raw
water. There are several advantages to adding PAC
during EC which may have greater DBP precursors
removal capacities (Uyak et al., 2007).
In this research, the focus is accorded to SAS
since disagreeable taste-odour manifestation in the
tap water and not well optimized employment of the
PAC in the Station throughout 2006 summer. These
issues evoked consumer’s doubt and attracted the
attention on the treatment stages applied in SAS.
Consequently, a performant and economical solution
must be suggested. First, a physicochemical and
biological comparison between the Boukerdene
Dam’s water and the Station’s treated water is
performed. Secondly, the determination of
responsible agents of disagreable tastes in the
potabilized water is done. Finally, EC tests using jar
tests in the laboratory, where pH is slightly acidified
(pH 6) for the optimised coagulant dose using the
conventional coagulation (CC) procedure, are
realised proving that this process may be the efficient
solution for this Station.
2. Experimental
2.1. Source waters collection
The natural water sources used in this study
are Boukerdene Dam’s waters. Boukerdene Dam was
constructed in 1986 and is located at 1.3 km to SAS.
Quality parameters of these raw waters over 15
month period are summarised in Table 1. Daily
consumption of 2 × 16800 m 3 (two chains) drinking
water is supplied from these surface waters in Tipaza.
Table 1. Evolution of turbidity τ, pH, and temperature T (°C) for raw water (a); optimal chemicals doses for performed CC jar
tests in the laboratory (b); and water characteristics after jar tests (c) (numbers between brackets present the corresponding
removal efficiency (%))
Date Raw water characteristics (a) Chemicals doses (mg L-1) (b) Water characteristics after settling (c)
τ (NTU) pH T (°C) Coagulant Polymer PAC τ (NTU) pH T (°C) Taste
01.04.07 7.19 8.13 14.2 20 0.075 24 2.07 (71.21) 7.73 15.2 Light
03.04.07 7.62 8.12 15.7 20 0.075 18 2.25 (70.47) 6.93 15.6 Very light
08.04.07 8.18 8.05 14.9 30 0 12.5 2.10 (74.33) 7.50 16.0 Light
09.04.07 9.79 8.08 15.4 20 0 20 2.05 (79.06) 7.63 17.5 Tasteless
11.04.07 6.81 8.08 15.0 25 0.050 20 2.80 (58.88) 7.56 17.3 Tasteless
16.04.07 5.90 7.94 15.1 20 0.050 20 1.72 (70.85) 7.78 16.2 Very light
18.04.07 5.37 7.98 15.8 40 0.050 15 2.29 (57.35) 7.13 18.1 Tasteful
21.04.07 9.66 7.96 15.7 30 0.100 12.5 1.07 (88.92) 7.29 18.9 Light
22.04.07 8.78 7.90 16.5 40 0.075 15 1.21 (86.22) 6.97 18.7 Tasteful
25.04.07 7.36 7.98 16.5 50 0.075 15 0.71 (90.35) 7.16 19.1 Tasteful
30.04.07 6.01 8.05 15.3 30 0.075 - 1.53 (74.54) 7.62 17.4 -
05.05.07 6.15 7.94 16.7 30 0.050 - 1.81 (70.57) 7.39 17.8 -
12.05.07 22.4 7.87 17.5 20 0.050 - 1.01 (95.49) 7.47 19.9 -
19.05.07 4.73 7.81 18.1 20 0.100 - 0.76 (83.93) 7.39 22.0 -
26.05.07 7.88 7.77 17.4 20 0.100 - 0.41 (94.79) 7.35 22.3 -
02.06.07 4.91 7.73 17.0 20 0.050 - 0.94 (80.85) 7.52 21.2 -
09.06.07 5.88 7.69 18.5 25 0.050 - 0.56 (90.47) 7.07 21.7 -
17.06.07 5.23 7.40 19.1 40 0.075 - 0.91 (82.60) 7.00 24.3 -
24.06.07 6.94 7.63 18.5 15 0.075 - 0.82 (88.18) 7.42 23.1 -
03.07.07 4.31 7.46 18.9 15 0.025 - 0.82 (80.97) 7.33 20.1 -
11.07.07 6.94 7.45 19.9 15 0.030 - 0.84 (87.89) 7.35 22.5 -
21.07.07 6.99 7.52 21.4 20 0.025 - 0.81 (88.41) 7.27 25.1 -
28.07.07 3.54 7.44 20.4 15 0.030 - 0.52 (85.31) 7.31 27.7 -
04.08.07 3.94 7.47 22.5 15 0.015 - 0.72 (81.72) 7.45 24.1 -
11.08.07 3.64 7.41 23.4 15 0.015 - 0.86 (76.37) 7.35 25.5 -
19.08.07 6.22 7.49 24.5 20 0.015 - 1.17 (81.19) 7.34 26.0 -
26.08.07 9.77 7.72 25.0 20 0.025 - 0.76 (92.22) 7.52 28.0 -
2305
Paraphrase This Document
Need a fresh take? Get an instant paraphrase of this document with our AI Paraphraser
Ghernaout et al./Environmental Engineering and Management Journal 16 (2017), 10, 2303-2315
Raw water samples are collected as grab
samples (1 mL of glycol is added to each 250 mL
water flask to fix algae cells’ numbers and forms and
prevent them to explode due to the effect of cooling)
and shipped to SAS Laboratory where they are kept
in a refrigerator at 4°C to retard biological activity
prior to use.
2.2. Description of the Sidi-Amar station
After the admission work, water flow out in
the raw water reservoir (75 m 3 as volume) which is
followed by the cascade (waterfall). The dimensions
of the cascade are: length 5 m, width 3.70 m, number
of floors 4.
Further, the injection of alum and sodium
hypochlorite (Eau de Javel) is accomplished in the
cascade admission. The cationic polymer (CP) is
injected in the rapid mixing chamber (power 7 kW,
700 rounds per minute (rpm)). The optimised
residence time is comprised between 30 and 60 s, so
the residence time is 50 s for 11 m 3 as the chamber
volume (length 2 m, width 1.70 m, height 3.28 m).
The flocculation chamber (length 7.40 m, width 5.40
m, height 3.25 m) has 125 m 3 as equivalent volume
with 20 min as optimised residence time. The slow
mixing is performed by a less powerful agitator
(power 1.1 kW, 10 rpm). After microflocs formation,
water is admitted in the lamellar sedimentation
chamber (length 13.33 m, width 7.45 m, height 5.34
m) which is equipped with polyvinyl chloride (PVC)
plates (length 1.4 m, width 1 m, thickness 2 mm).
The plates are set at an angle 55° from the surface.
The surface area of a plate is 1.4 m 2. The number of
plates are chosen such as the sedimentation rate did
not overcome 0.8 m h-1; so eight lines of plates are
arranged with 187 plates per line. There are two
filters (for one chain) with 7 m as length and 4 m as
width. The filtration rate is 6.4 m h -1 and the filtering
material (1.4 m) is composed of gravel (0.2 m,
particles size 3-5.6 mm) and sand (1.2 m, particles
size 1-1.7 mm).
2.3. Materials
The coagulant (Al2(SO4)3.18H2O (alum)), CP
and PAC used in bench scale tests are reagent grade
(they are also used in SAS without any specified
name and without more details given at SAS). An
alum solution (10 g L-1) is daily prepared by
dissolving 1 g of alum in a beaker containing 100 mL
of distilled water under low agitation. A CP solution
(5 g L-1) is also daily prepared by dissolving 0.5 g of
CP in a beaker containing 100 mL of distilled water
under higher agitation (180 rpm); from this solution,
1 mL is taken and placed in 100 mL phial before
adding distilled water until 100 mL to get a diluted
solution (0.05 g L-1). For PAC, a solution (10 g L-1) is
also daily prepared by dissolving 1 g of PAC in a
beaker containing 100 mL of distilled water under
higher agitation (180 rpm).
The used set-up for jar tests experiments is
constituted of 6 beakers (1 L) with 6 blades (1.5 cm ×
8.5 cm) maintained at the same speed (10 to 300
rpm). A standard procedure is used: beakers
containing raw water (1 L) are maintained at high
agitation (200 rpm); at t = 0, alum corresponding
volumes are simultaneously added to the beakers at
increasing concentrations; at t = 2 min, agitation is
reduced from 200 to 30 rpm (2 min of coagulation);
at t = 20 min, agitation is stopped and blades are
kindly removed (18 min of flocculation); at t = 65
min (45 min of sedimentation), samples are taken
from the middle of the beakers by siphoning for
analyses (turbidity, pH, etc.). When CP is used, its
corresponding volumes are simultaneously added to
the beakers at increasing concentrations at t = 2 min
(after coagulation phase). When PAC is used, its
corresponding volumes (e.g., 2.4 mL from PAC
solution to get 24 mg L -1) are simultaneously added
to the beakers at increasing concentrations at t = 0
min (i.e., at the same time with alum). Since alum
and PAC solutions are prepared at 10 g L-1 (the added
chemical volumes are reduced), the hydrodynamics
would not be modified (see “Chemicals doses (mg L -
1) (b)” in Table 1).
2.4. Analytical methods
All the performed analyses are performed in
the Algerian Waters Laboratory (Tipaza) following
standard methods (Rodier, 1984) especially coliforms
(TC: total coliforms; FC: fecal coliforms; FS: fecal
streptococcus) and algae which are counted in
accordance with the standard methods (Rodier, 1984;
Meyer et al., 1988). The microscopic analysis and
algae species identification are performed by the
Central Laboratory (Algerian Waters, Algiers)
following standard methods (Bourrelly, 1985;
Bérard-Therriault et al., 1999; Van Den Hoek et al.,
1995). Details of laboratory methods may be found in
John et al. (2005) who give an excellent guide for
using laboratory methods in algae identification and
Whitton (2005) who gives an excellent description of
cyanobacteria.
2.5. Taste evaluation
The taste evaluation is based on the fineness
of the Engineer’s gustatory sense. Water is diluted
with water without taste (“water of reference” or
mineral water). Tasting is accomplished by starting
with the biggest dilution until the taste apparition.
Some precautions must be taken: tasting is performed
in laboratory (25°C) in calm conditions using
rigorously proper glasses flasks; flasks containing
water must be kept closed at the same temperature
during tasting. To taste water, Engineer will take
sufficient quantity of water in his mouth to totally
impregnate and make it travel from a side to the other
and then throw it. Tasting starts with less
concentrated solution, Engineer attribute a note to the
2306
Enhanced coagulation for algae removal in a typical Algeria water treatment plant
water of reference and then to the samples by
referencing to the water of reference. Engineer must
rinse rigorously his mouth with water of reference
after each tasting.
3. Results and discussion
This study is accomplished from April to
August 2007. A rigorous qualitative control of the
Dam’s Boukerdene water and the SAS’s treated
water is realised in order to check up if the treated
water quality is in accordance with WHO and
Algerian water quality standards. Hence, this work is
divided into four steps: measure of turbidity τ every 8
hours, weekly total chemical control, monthly
bacteriological control, weekly algae control and
weekly coagulant and flocculent doses determination.
3.1. Raw and treated water quality characteristics
3.1.1. Physicochemical parameters
Table 1 (a) presents the evolution of turbidity
τ, pH and temperature T (°C) for raw water and Table
2 presents the evolution of NH4+, PO43-, NO2-, and
NO3- for raw water and treated water. For raw water,
as seen in Table 2, nitrates and nitrites values are
under the Algerian standards (which are 50 and 0.1
mg L-1, respectively) and phosphates are always
under 0.09 mg L-1. For ammonium, high values up to
0.17 mg L -1 (0.05 mg L -1 as accepted value and 0.5
mg L-1 as maximal concentration) are observed in
August. This is due to the fact that algae use nitrates
after their reduction to nitrites and after that to
ammonium using nitrates and nitrites reductase
enzymes. For the treated water, the potability
standards are respected concerning NH4+, PO43-, NO2-
and NO3-.
Table 3 presents the evolution of OM
expressed as KMnO4 oxydability mg O 2 L-1. The
increasing OM in the raw water from April to August
is due to the increasing activity of algae. The raw and
treated waters are under the standards (< 3 mg O2 L-1)
of potability. Table 4 presents the evolution of
aluminium and iron (mg L -1) as undesirable elements
for raw water (a) and treated water in SAS (b).
Table 2. Evolution of NH4+, PO43-, NO2- and NO3- (mg L-1) for raw water (a)
and treated water in SAS (b) (nd: not determined)
Date Raw water (a) Treated water (b)
NH4+ PO43- NO2- NO3- NH4+ PO43- NO2- NO3-
07.04.07 0.06 < 0.09 0.04 8.05 < 0.02 < 0.09 < 0.02 8.24
14.04.07 0.12 < 0.09 0.04 nd < 0.02 < 0.09 < 0.02 nd
21.04.07 0.10 < 0.09 0.03 nd < 0.02 < 0.09 < 0.02 nd
28.04.07 0.07 < 0.09 0.04 nd < 0.02 < 0.09 < 0.02 nd
05.05.07 < 0.02 < 0.09 < 0.02 7.20 < 0.02 < 0.09 < 0.02 7.42
12.05.07 0.04 < 0.09 0.04 nd < 0.02 < 0.09 < 0.02 nd
19.05.07 0.07 < 0.09 0.02 nd < 0.02 < 0.09 < 0.02 nd
26.05.07 0.03 < 0.09 0.02 nd < 0.02 < 0.09 < 0.02 nd
02.06.07 < 0.02 < 0.09 < 0.02 6.36 < 0.02 < 0.09 < 0.02 6.60
09.06.07 0.03 < 0.09 0.03 nd < 0.02 < 0.09 < 0.02 nd
16.06.07 0.04 < 0.09 0.03 nd < 0.02 < 0.09 < 0.02 nd
23.06.07 0.03 < 0.09 0.03 nd < 0.02 < 0.09 < 0.02 nd
07.07.07 0.06 < 0.09 0.04 6.37 < 0.02 < 0.09 < 0.02 7.82
14.07.07 0.13 < 0.09 0.02 nd < 0.02 < 0.09 < 0.02 nd
21.07.07 0.10 < 0.09 0.04 nd < 0.02 < 0.09 < 0.02 nd
28.07.07 0.07 < 0.09 0.03 nd < 0.02 < 0.09 < 0.02 nd
04.08.07 0.17 < 0.09 0.05 5.32 < 0.02 < 0.09 < 0.02 5.82
11.08.07 0.12 < 0.09 0.03 nd < 0.02 < 0.09 < 0.02 nd
18.08.07 0.12 < 0.09 0.03 nd < 0.02 < 0.09 < 0.02 nd
25.08.07 nd < 0.09 nd nd < 0.02 < 0.09 < 0.02 nd
Table 3. Evolution of OM (as mg O2 L-1) for raw water (a) and treated water in SAS (b) with its removal (c)
Date Raw water (a) Treated water (b) Removal (%) (c)
07.04.07 0.93 0.24 74
05.05.07 1.40 0.80 43
02.06.07 1.44 0.32 78
09.06.07 2.00 1.12 44
16.06.07 1.60 0.88 45
23.06.07 2.00 0.80 60
07.07.07 1.20 0.64 47
14.07.07 1.60 0.64 60
21.07.07 2.40 0.80 67
28.07.07 1.68 0.96 43
04.08.07 1.28 0.72 44
11.08.07 1.76 0.40 77
18.08.07 1.40 0.72 48
25.08.07 1.28 0.24 81
2307
⊘ This is a preview!⊘
Do you want full access?
Subscribe today to unlock all pages.
Trusted by 1+ million students worldwide
Ghernaout et al./Environmental Engineering and Management Journal 16 (2017), 10, 2303-2315
Table 4. Evolution of Al and Fe (mg L-1) for raw water (a) and treated water in SAS (b)
Date Raw water (a) Treated water (b)
Al Fe Al Fe
07.04.07 0 0.13 0 0.02
05.05.07 0 0.10 0 0.01
02.06.07 0 0.12 0 0.01
07.07.07 0 0.13 0 0.02
04.08.07 0 0.11 0 0.02
Table 5. Evolution of some parameters of the Boukerdene Dam’s water at different levels of the Dam (nd: not determined)
Depth (m) pH T (°C) τ (NTU) C (μS cm-1) TDS (mg L-1) OM (as O2 mg L-1) O2 (mg L-1)
0 (surface) 8.09 28 4.66 750 357 1 nd
5 7.47 24 5.53 755 365 1.5 3.1
10 7.30 18 5.91 770 377 1.8 1.9
15 7.30 16 9.97 768 379 3.9 2.8
20 7.60 16 48 765 370 5 nd
Table 6. Evolution of Ca2+, Mg2+, Cl-, HCO3- and SO42- (mg L-1) for raw water and treated water in SAS (b)
Date 07.04.07 05.05.07 02.06.07 07.07.07 04.08.07
Water Raw Treated Raw Treated Raw Treated Raw Treated Raw Treated
Ca2+ 64 60 68 72 68 64 60 56 60 72
Mg2+ 31 29 33 30 31 24 32 26 24 26
Cl- 76 68 54 60 71 71 72 68 73 79
HCO3- 177 159 183 159 198 183 213 183 213 206
SO42- 214 234 192 185 190 163 164 159 92 72
During this study, as seen in Table 4, water
treatment using alum has no effect on Al presence in
the treated water due to the fact that raw water did
not present Al and the precision of the jar tests. The
iron concentrations are always under the standards
(0.3 mg L -1). Table 5 presents the evolution of some
parameters of the Boukerdene Dam’s water at
different levels of the Dam. This control was
performed in 2007’s summer (17 th July, 32°C) in
order to check the Dam stratification after the bad
taste apparition in the raw water. When the under
surface level of water increase, turbidity and OM
increase. Table 6 presents the evolution of Ca2+,
Mg2+, Cl-, HCO3- and SO42- (mg L-1) for raw water
and treated water in SAS.
3.1.2. Algal counts
Algal counts for Dam’s water and treated
waters in SAS at different points of the treatment
process are realised. Table 7 presents the algae
vertical distribution in Boukerdene Dam (1, 5 and 10
m under the surface) and raw water’s algae number.
Table 7. Algae (cells mL-1) vertical distribution in
Boukerdene Dam’s (1, 5 and 10 m under the surface) and
raw water’s algae number (*under the surface)
Date 1 m* 5 m* 10 m* Raw water
28.05.07 393 951 655 605 108 778 99 958
27.06.07 452 750 255 774 99 957 467 450
In May, the algae number at 5 m under the
surface is greater than at 1 m (655 605 and 393 951
cells mL-1, respectively). On the contrary, in June the
algae number at 5 m under the surface is lower than
at 1 m (255 774 and 452 750 cells mL-1,
respectively). At 10 m under the surface, algae
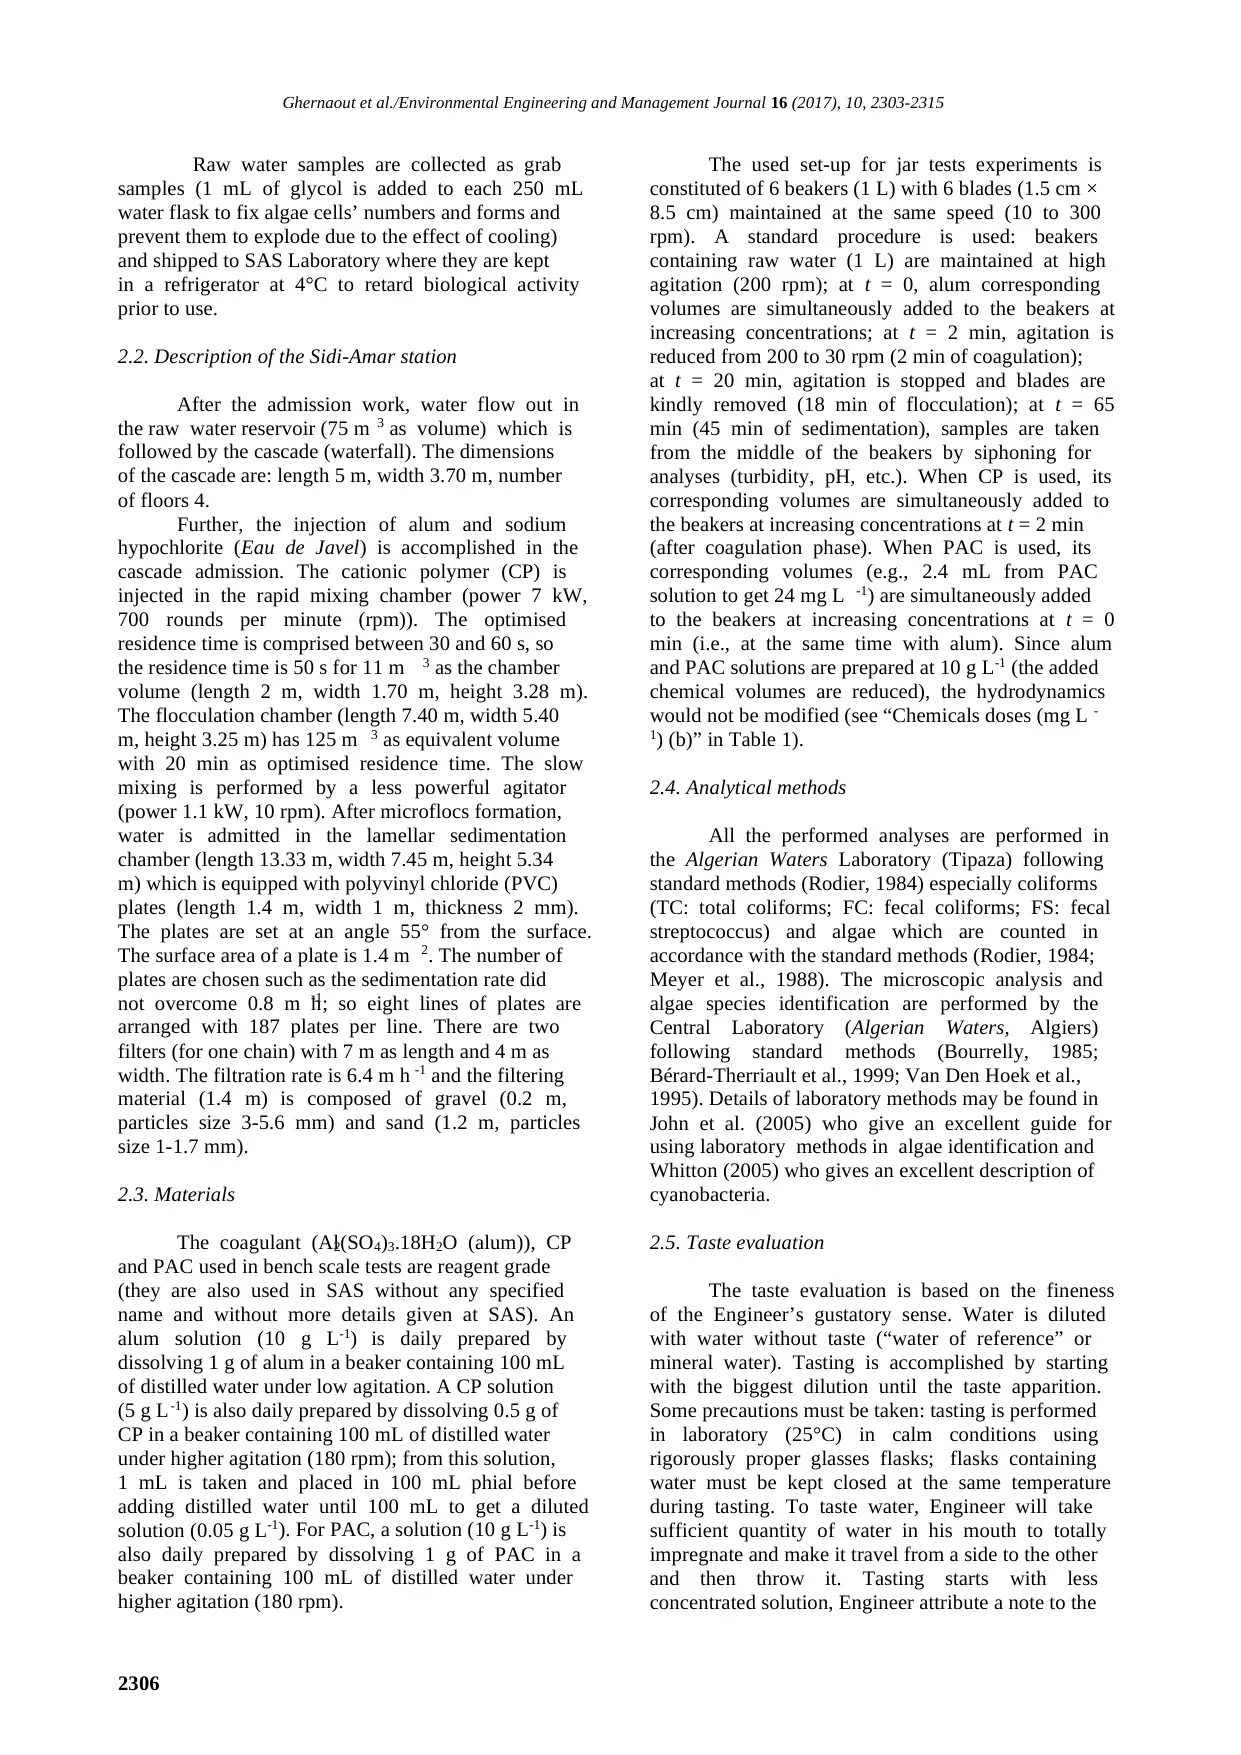
number is practically the same in May and June. Fig.
1 shows the variation of raw water’s algae number
from May to August. For June and August, the algae
number increases due to the fact that this period
coincide with strong light, high surface-water
temperatures, calm weather, and a stable
stratification of the water column (Wulff et al.,
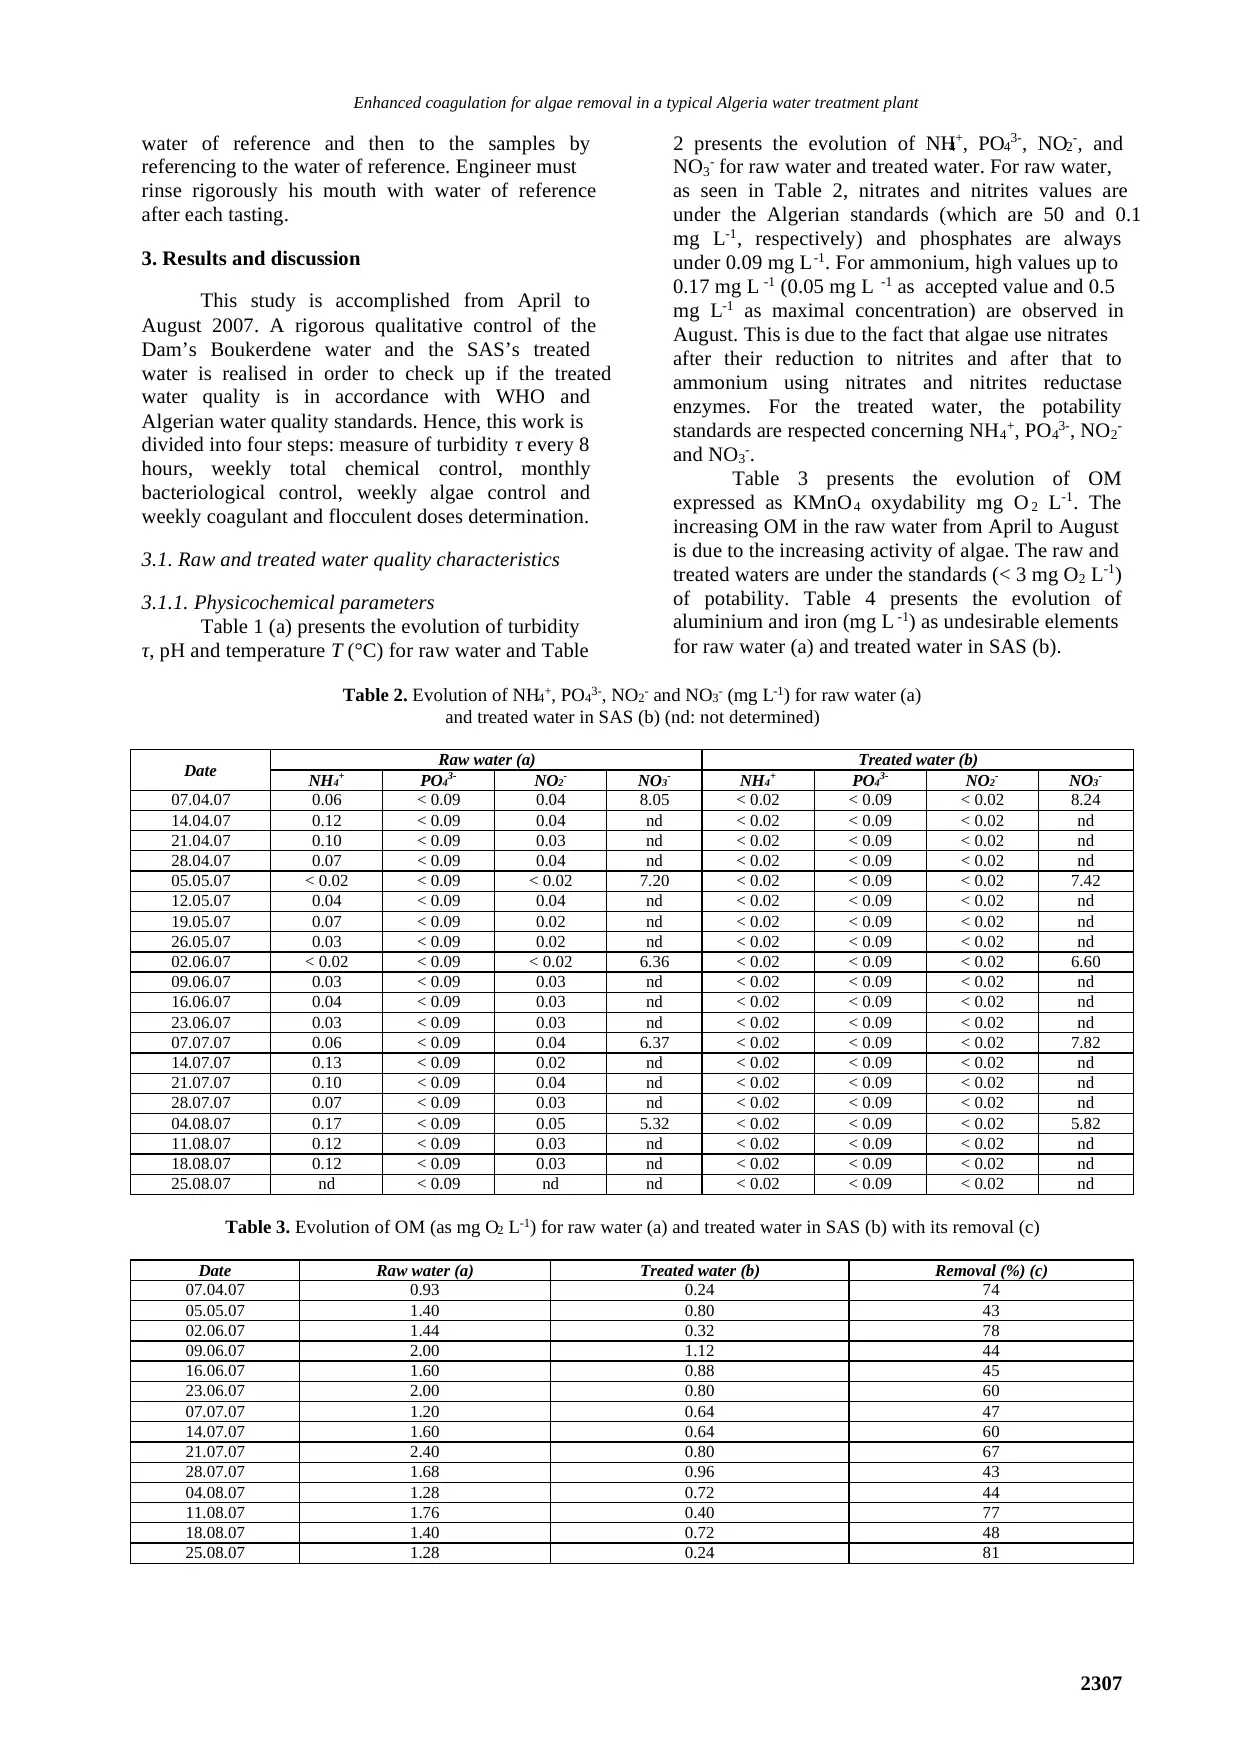
2007). Fig. 2 shows the variation of settled water’s
(after C/F) algae number from May to August in
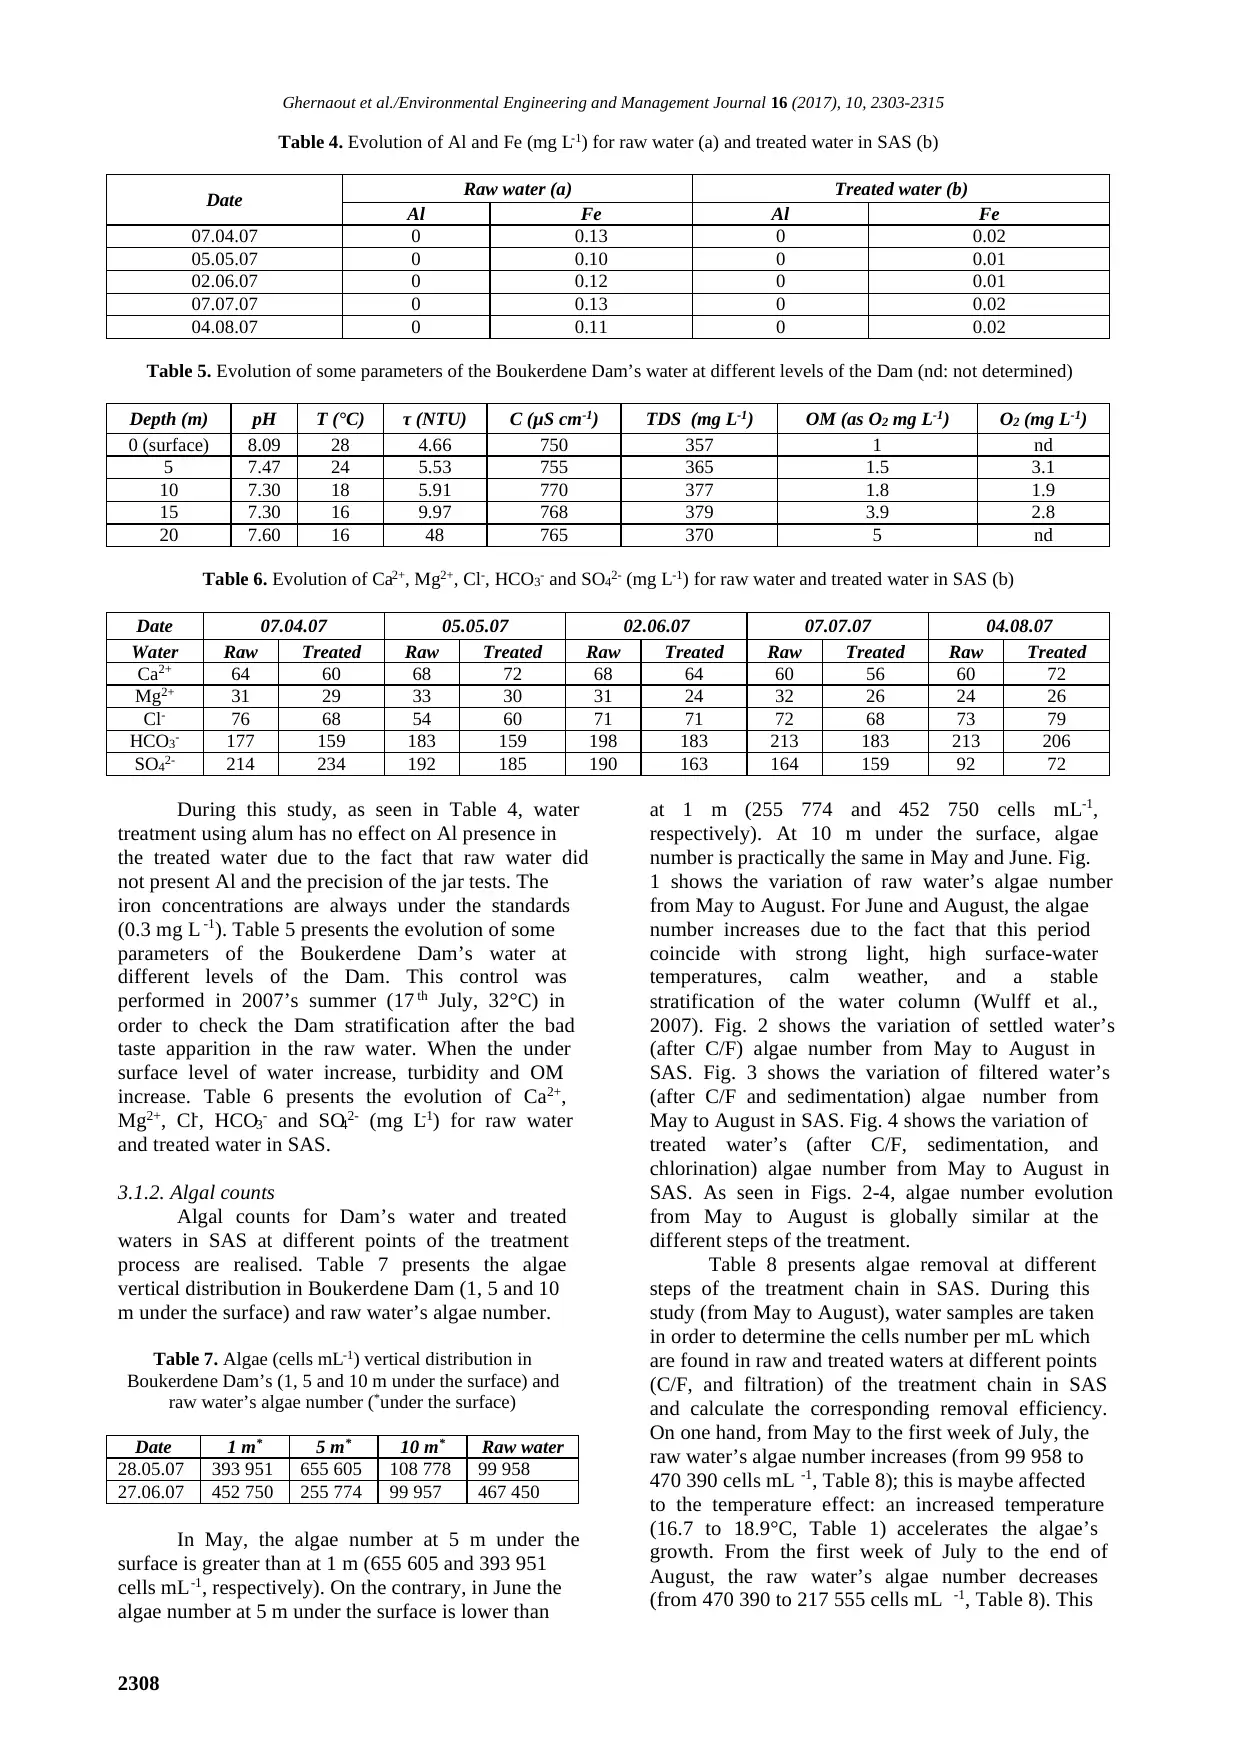
SAS. Fig. 3 shows the variation of filtered water’s
(after C/F and sedimentation) algae number from
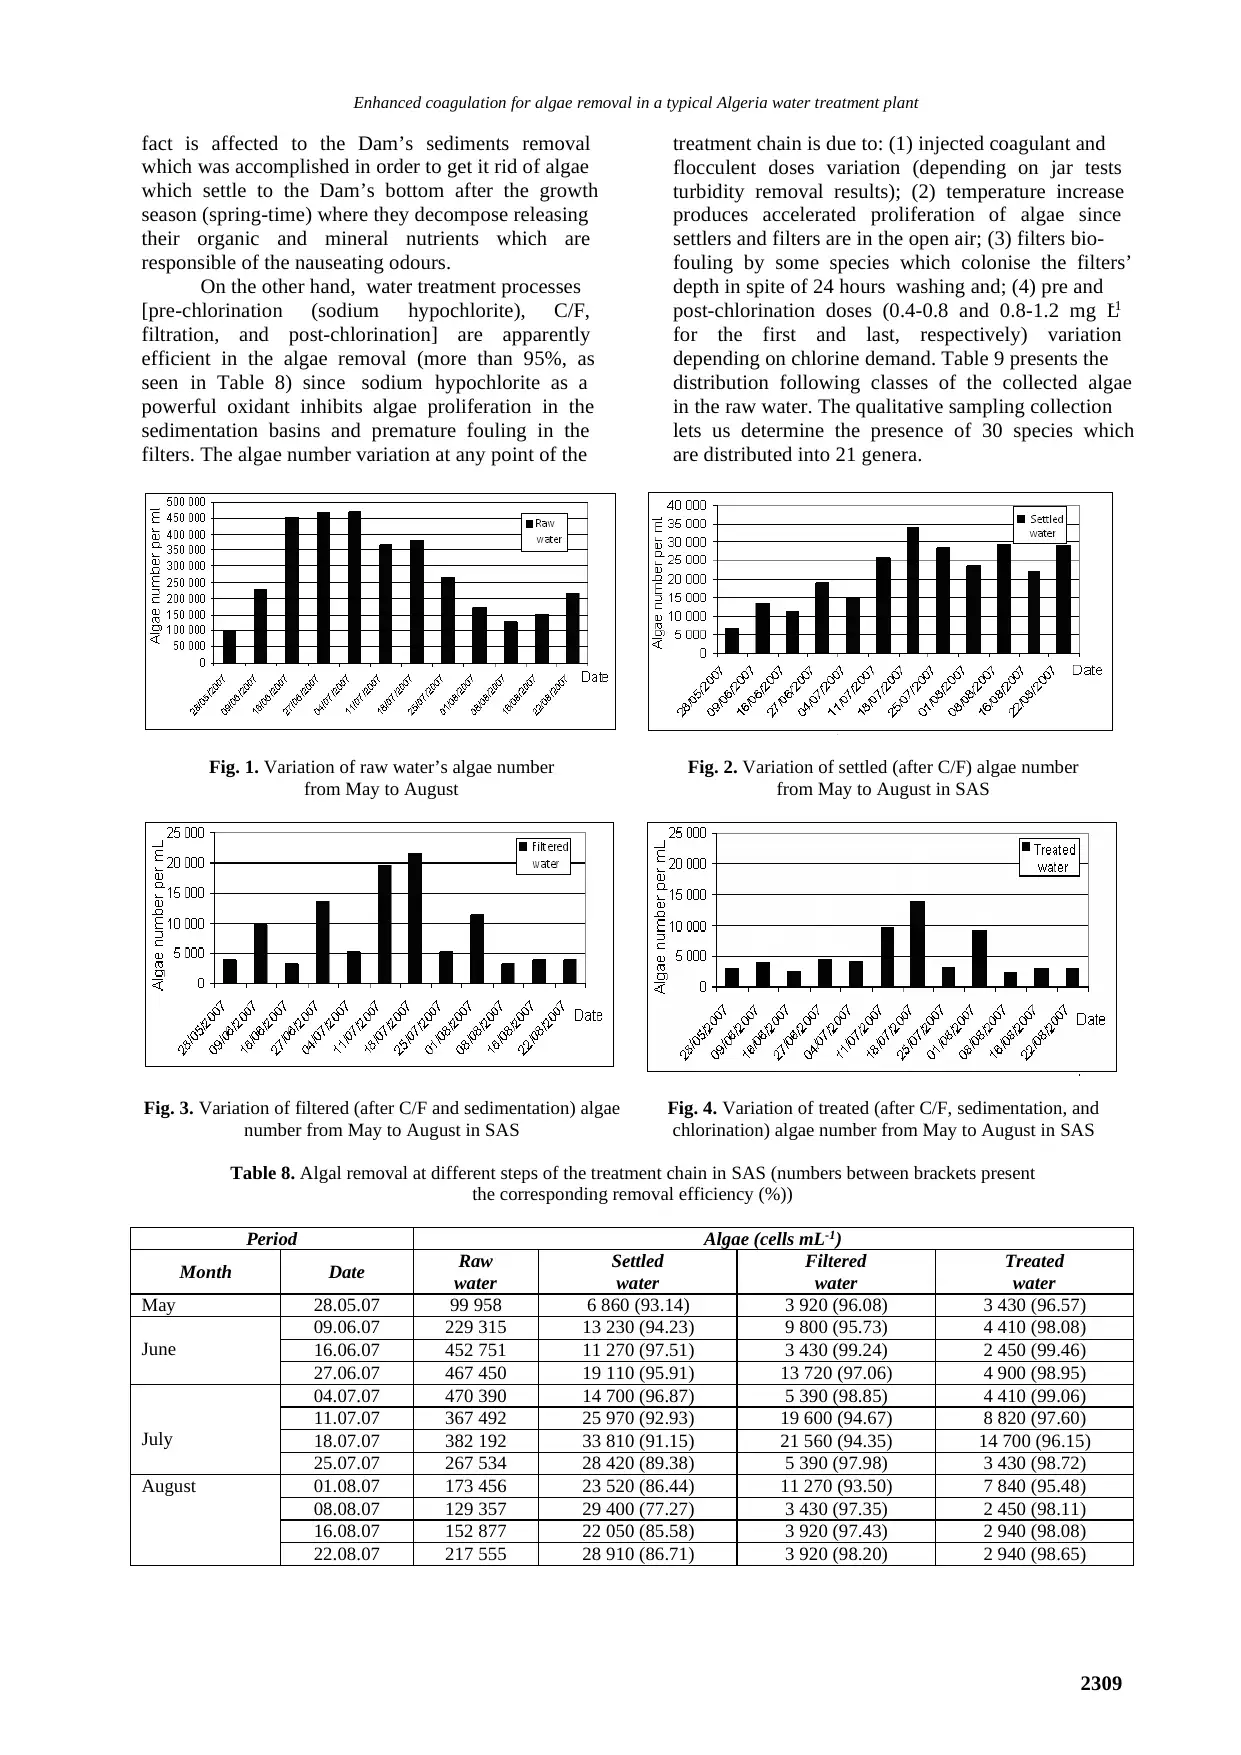
May to August in SAS. Fig. 4 shows the variation of
treated water’s (after C/F, sedimentation, and
chlorination) algae number from May to August in
SAS. As seen in Figs. 2-4, algae number evolution
from May to August is globally similar at the
different steps of the treatment.
Table 8 presents algae removal at different
steps of the treatment chain in SAS. During this
study (from May to August), water samples are taken
in order to determine the cells number per mL which
are found in raw and treated waters at different points
(C/F, and filtration) of the treatment chain in SAS
and calculate the corresponding removal efficiency.
On one hand, from May to the first week of July, the
raw water’s algae number increases (from 99 958 to
470 390 cells mL -1, Table 8); this is maybe affected
to the temperature effect: an increased temperature
(16.7 to 18.9°C, Table 1) accelerates the algae’s
growth. From the first week of July to the end of
August, the raw water’s algae number decreases
(from 470 390 to 217 555 cells mL -1, Table 8). This
2308
Table 4. Evolution of Al and Fe (mg L-1) for raw water (a) and treated water in SAS (b)
Date Raw water (a) Treated water (b)
Al Fe Al Fe
07.04.07 0 0.13 0 0.02
05.05.07 0 0.10 0 0.01
02.06.07 0 0.12 0 0.01
07.07.07 0 0.13 0 0.02
04.08.07 0 0.11 0 0.02
Table 5. Evolution of some parameters of the Boukerdene Dam’s water at different levels of the Dam (nd: not determined)
Depth (m) pH T (°C) τ (NTU) C (μS cm-1) TDS (mg L-1) OM (as O2 mg L-1) O2 (mg L-1)
0 (surface) 8.09 28 4.66 750 357 1 nd
5 7.47 24 5.53 755 365 1.5 3.1
10 7.30 18 5.91 770 377 1.8 1.9
15 7.30 16 9.97 768 379 3.9 2.8
20 7.60 16 48 765 370 5 nd
Table 6. Evolution of Ca2+, Mg2+, Cl-, HCO3- and SO42- (mg L-1) for raw water and treated water in SAS (b)
Date 07.04.07 05.05.07 02.06.07 07.07.07 04.08.07
Water Raw Treated Raw Treated Raw Treated Raw Treated Raw Treated
Ca2+ 64 60 68 72 68 64 60 56 60 72
Mg2+ 31 29 33 30 31 24 32 26 24 26
Cl- 76 68 54 60 71 71 72 68 73 79
HCO3- 177 159 183 159 198 183 213 183 213 206
SO42- 214 234 192 185 190 163 164 159 92 72
During this study, as seen in Table 4, water
treatment using alum has no effect on Al presence in
the treated water due to the fact that raw water did
not present Al and the precision of the jar tests. The
iron concentrations are always under the standards
(0.3 mg L -1). Table 5 presents the evolution of some
parameters of the Boukerdene Dam’s water at
different levels of the Dam. This control was
performed in 2007’s summer (17 th July, 32°C) in
order to check the Dam stratification after the bad
taste apparition in the raw water. When the under
surface level of water increase, turbidity and OM
increase. Table 6 presents the evolution of Ca2+,
Mg2+, Cl-, HCO3- and SO42- (mg L-1) for raw water
and treated water in SAS.
3.1.2. Algal counts
Algal counts for Dam’s water and treated
waters in SAS at different points of the treatment
process are realised. Table 7 presents the algae
vertical distribution in Boukerdene Dam (1, 5 and 10
m under the surface) and raw water’s algae number.
Table 7. Algae (cells mL-1) vertical distribution in
Boukerdene Dam’s (1, 5 and 10 m under the surface) and
raw water’s algae number (*under the surface)
Date 1 m* 5 m* 10 m* Raw water
28.05.07 393 951 655 605 108 778 99 958
27.06.07 452 750 255 774 99 957 467 450
In May, the algae number at 5 m under the
surface is greater than at 1 m (655 605 and 393 951
cells mL-1, respectively). On the contrary, in June the
algae number at 5 m under the surface is lower than
at 1 m (255 774 and 452 750 cells mL-1,
respectively). At 10 m under the surface, algae
number is practically the same in May and June. Fig.
1 shows the variation of raw water’s algae number
from May to August. For June and August, the algae
number increases due to the fact that this period
coincide with strong light, high surface-water
temperatures, calm weather, and a stable
stratification of the water column (Wulff et al.,
2007). Fig. 2 shows the variation of settled water’s
(after C/F) algae number from May to August in
SAS. Fig. 3 shows the variation of filtered water’s
(after C/F and sedimentation) algae number from
May to August in SAS. Fig. 4 shows the variation of
treated water’s (after C/F, sedimentation, and
chlorination) algae number from May to August in
SAS. As seen in Figs. 2-4, algae number evolution
from May to August is globally similar at the
different steps of the treatment.
Table 8 presents algae removal at different
steps of the treatment chain in SAS. During this
study (from May to August), water samples are taken
in order to determine the cells number per mL which
are found in raw and treated waters at different points
(C/F, and filtration) of the treatment chain in SAS
and calculate the corresponding removal efficiency.
On one hand, from May to the first week of July, the
raw water’s algae number increases (from 99 958 to
470 390 cells mL -1, Table 8); this is maybe affected
to the temperature effect: an increased temperature
(16.7 to 18.9°C, Table 1) accelerates the algae’s
growth. From the first week of July to the end of
August, the raw water’s algae number decreases
(from 470 390 to 217 555 cells mL -1, Table 8). This
2308
Paraphrase This Document
Need a fresh take? Get an instant paraphrase of this document with our AI Paraphraser
Enhanced coagulation for algae removal in a typical Algeria water treatment plant
fact is affected to the Dam’s sediments removal
which was accomplished in order to get it rid of algae
which settle to the Dam’s bottom after the growth
season (spring-time) where they decompose releasing
their organic and mineral nutrients which are
responsible of the nauseating odours.
On the other hand, water treatment processes
[pre-chlorination (sodium hypochlorite), C/F,
filtration, and post-chlorination] are apparently
efficient in the algae removal (more than 95%, as
seen in Table 8) since sodium hypochlorite as a
powerful oxidant inhibits algae proliferation in the
sedimentation basins and premature fouling in the
filters. The algae number variation at any point of the
treatment chain is due to: (1) injected coagulant and
flocculent doses variation (depending on jar tests
turbidity removal results); (2) temperature increase
produces accelerated proliferation of algae since
settlers and filters are in the open air; (3) filters bio-
fouling by some species which colonise the filters’
depth in spite of 24 hours washing and; (4) pre and
post-chlorination doses (0.4-0.8 and 0.8-1.2 mg L-1
for the first and last, respectively) variation
depending on chlorine demand. Table 9 presents the
distribution following classes of the collected algae
in the raw water. The qualitative sampling collection
lets us determine the presence of 30 species which
are distributed into 21 genera.
Fig. 1. Variation of raw water’s algae number
from May to August
Fig. 2. Variation of settled (after C/F) algae number
from May to August in SAS
Fig. 3. Variation of filtered (after C/F and sedimentation) algae
number from May to August in SAS
Fig. 4. Variation of treated (after C/F, sedimentation, and
chlorination) algae number from May to August in SAS
Table 8. Algal removal at different steps of the treatment chain in SAS (numbers between brackets present
the corresponding removal efficiency (%))
Period Algae (cells mL-1)
Month Date Raw
water
Settled
water
Filtered
water
Treated
water
May 28.05.07 99 958 6 860 (93.14) 3 920 (96.08) 3 430 (96.57)
June
09.06.07 229 315 13 230 (94.23) 9 800 (95.73) 4 410 (98.08)
16.06.07 452 751 11 270 (97.51) 3 430 (99.24) 2 450 (99.46)
27.06.07 467 450 19 110 (95.91) 13 720 (97.06) 4 900 (98.95)
July
04.07.07 470 390 14 700 (96.87) 5 390 (98.85) 4 410 (99.06)
11.07.07 367 492 25 970 (92.93) 19 600 (94.67) 8 820 (97.60)
18.07.07 382 192 33 810 (91.15) 21 560 (94.35) 14 700 (96.15)
25.07.07 267 534 28 420 (89.38) 5 390 (97.98) 3 430 (98.72)
August 01.08.07 173 456 23 520 (86.44) 11 270 (93.50) 7 840 (95.48)
08.08.07 129 357 29 400 (77.27) 3 430 (97.35) 2 450 (98.11)
16.08.07 152 877 22 050 (85.58) 3 920 (97.43) 2 940 (98.08)
22.08.07 217 555 28 910 (86.71) 3 920 (98.20) 2 940 (98.65)
2309
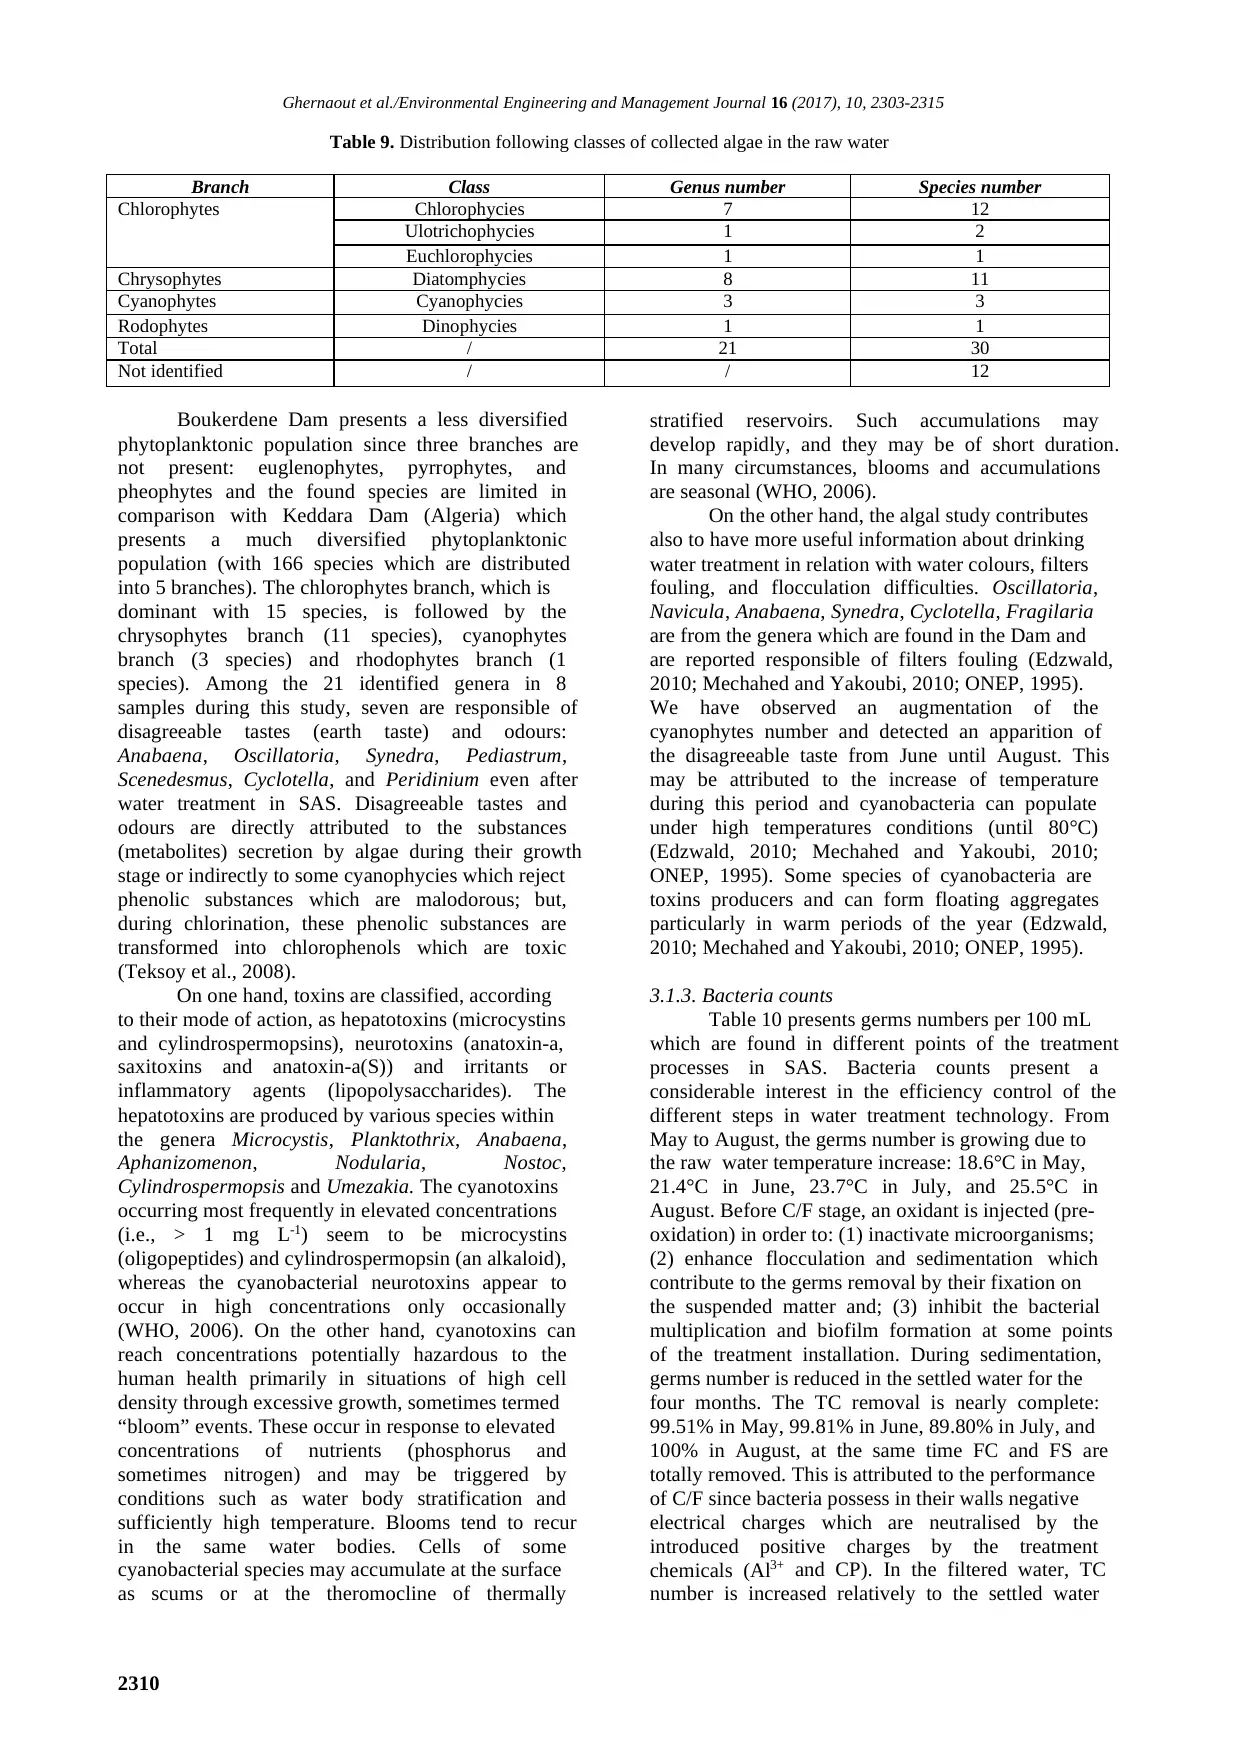
Ghernaout et al./Environmental Engineering and Management Journal 16 (2017), 10, 2303-2315
Table 9. Distribution following classes of collected algae in the raw water
Branch Class Genus number Species number
Chlorophytes Chlorophycies 7 12
Ulotrichophycies 1 2
Euchlorophycies 1 1
Chrysophytes Diatomphycies 8 11
Cyanophytes Cyanophycies 3 3
Rodophytes Dinophycies 1 1
Total / 21 30
Not identified / / 12
Boukerdene Dam presents a less diversified
phytoplanktonic population since three branches are
not present: euglenophytes, pyrrophytes, and
pheophytes and the found species are limited in
comparison with Keddara Dam (Algeria) which
presents a much diversified phytoplanktonic
population (with 166 species which are distributed
into 5 branches). The chlorophytes branch, which is
dominant with 15 species, is followed by the
chrysophytes branch (11 species), cyanophytes
branch (3 species) and rhodophytes branch (1
species). Among the 21 identified genera in 8
samples during this study, seven are responsible of
disagreeable tastes (earth taste) and odours:
Anabaena, Oscillatoria, Synedra, Pediastrum,
Scenedesmus, Cyclotella, and Peridinium even after
water treatment in SAS. Disagreeable tastes and
odours are directly attributed to the substances
(metabolites) secretion by algae during their growth
stage or indirectly to some cyanophycies which reject
phenolic substances which are malodorous; but,
during chlorination, these phenolic substances are
transformed into chlorophenols which are toxic
(Teksoy et al., 2008).
On one hand, toxins are classified, according
to their mode of action, as hepatotoxins (microcystins
and cylindrospermopsins), neurotoxins (anatoxin-a,
saxitoxins and anatoxin-a(S)) and irritants or
inflammatory agents (lipopolysaccharides). The
hepatotoxins are produced by various species within
the genera Microcystis, Planktothrix, Anabaena,
Aphanizomenon, Nodularia, Nostoc,
Cylindrospermopsis and Umezakia. The cyanotoxins
occurring most frequently in elevated concentrations
(i.e., > 1 mg L-1) seem to be microcystins
(oligopeptides) and cylindrospermopsin (an alkaloid),
whereas the cyanobacterial neurotoxins appear to
occur in high concentrations only occasionally
(WHO, 2006). On the other hand, cyanotoxins can
reach concentrations potentially hazardous to the
human health primarily in situations of high cell
density through excessive growth, sometimes termed
“bloom” events. These occur in response to elevated
concentrations of nutrients (phosphorus and
sometimes nitrogen) and may be triggered by
conditions such as water body stratification and
sufficiently high temperature. Blooms tend to recur
in the same water bodies. Cells of some
cyanobacterial species may accumulate at the surface
as scums or at the theromocline of thermally
stratified reservoirs. Such accumulations may
develop rapidly, and they may be of short duration.
In many circumstances, blooms and accumulations
are seasonal (WHO, 2006).
On the other hand, the algal study contributes
also to have more useful information about drinking
water treatment in relation with water colours, filters
fouling, and flocculation difficulties. Oscillatoria,
Navicula, Anabaena, Synedra, Cyclotella, Fragilaria
are from the genera which are found in the Dam and
are reported responsible of filters fouling (Edzwald,
2010; Mechahed and Yakoubi, 2010; ONEP, 1995).
We have observed an augmentation of the
cyanophytes number and detected an apparition of
the disagreeable taste from June until August. This
may be attributed to the increase of temperature
during this period and cyanobacteria can populate
under high temperatures conditions (until 80°C)
(Edzwald, 2010; Mechahed and Yakoubi, 2010;
ONEP, 1995). Some species of cyanobacteria are
toxins producers and can form floating aggregates
particularly in warm periods of the year (Edzwald,
2010; Mechahed and Yakoubi, 2010; ONEP, 1995).
3.1.3. Bacteria counts
Table 10 presents germs numbers per 100 mL
which are found in different points of the treatment
processes in SAS. Bacteria counts present a
considerable interest in the efficiency control of the
different steps in water treatment technology. From
May to August, the germs number is growing due to
the raw water temperature increase: 18.6°C in May,
21.4°C in June, 23.7°C in July, and 25.5°C in
August. Before C/F stage, an oxidant is injected (pre-
oxidation) in order to: (1) inactivate microorganisms;
(2) enhance flocculation and sedimentation which
contribute to the germs removal by their fixation on
the suspended matter and; (3) inhibit the bacterial
multiplication and biofilm formation at some points
of the treatment installation. During sedimentation,
germs number is reduced in the settled water for the
four months. The TC removal is nearly complete:
99.51% in May, 99.81% in June, 89.80% in July, and
100% in August, at the same time FC and FS are
totally removed. This is attributed to the performance
of C/F since bacteria possess in their walls negative
electrical charges which are neutralised by the
introduced positive charges by the treatment
chemicals (Al3+ and CP). In the filtered water, TC
number is increased relatively to the settled water
2310
⊘ This is a preview!⊘
Do you want full access?
Subscribe today to unlock all pages.
Trusted by 1+ million students worldwide
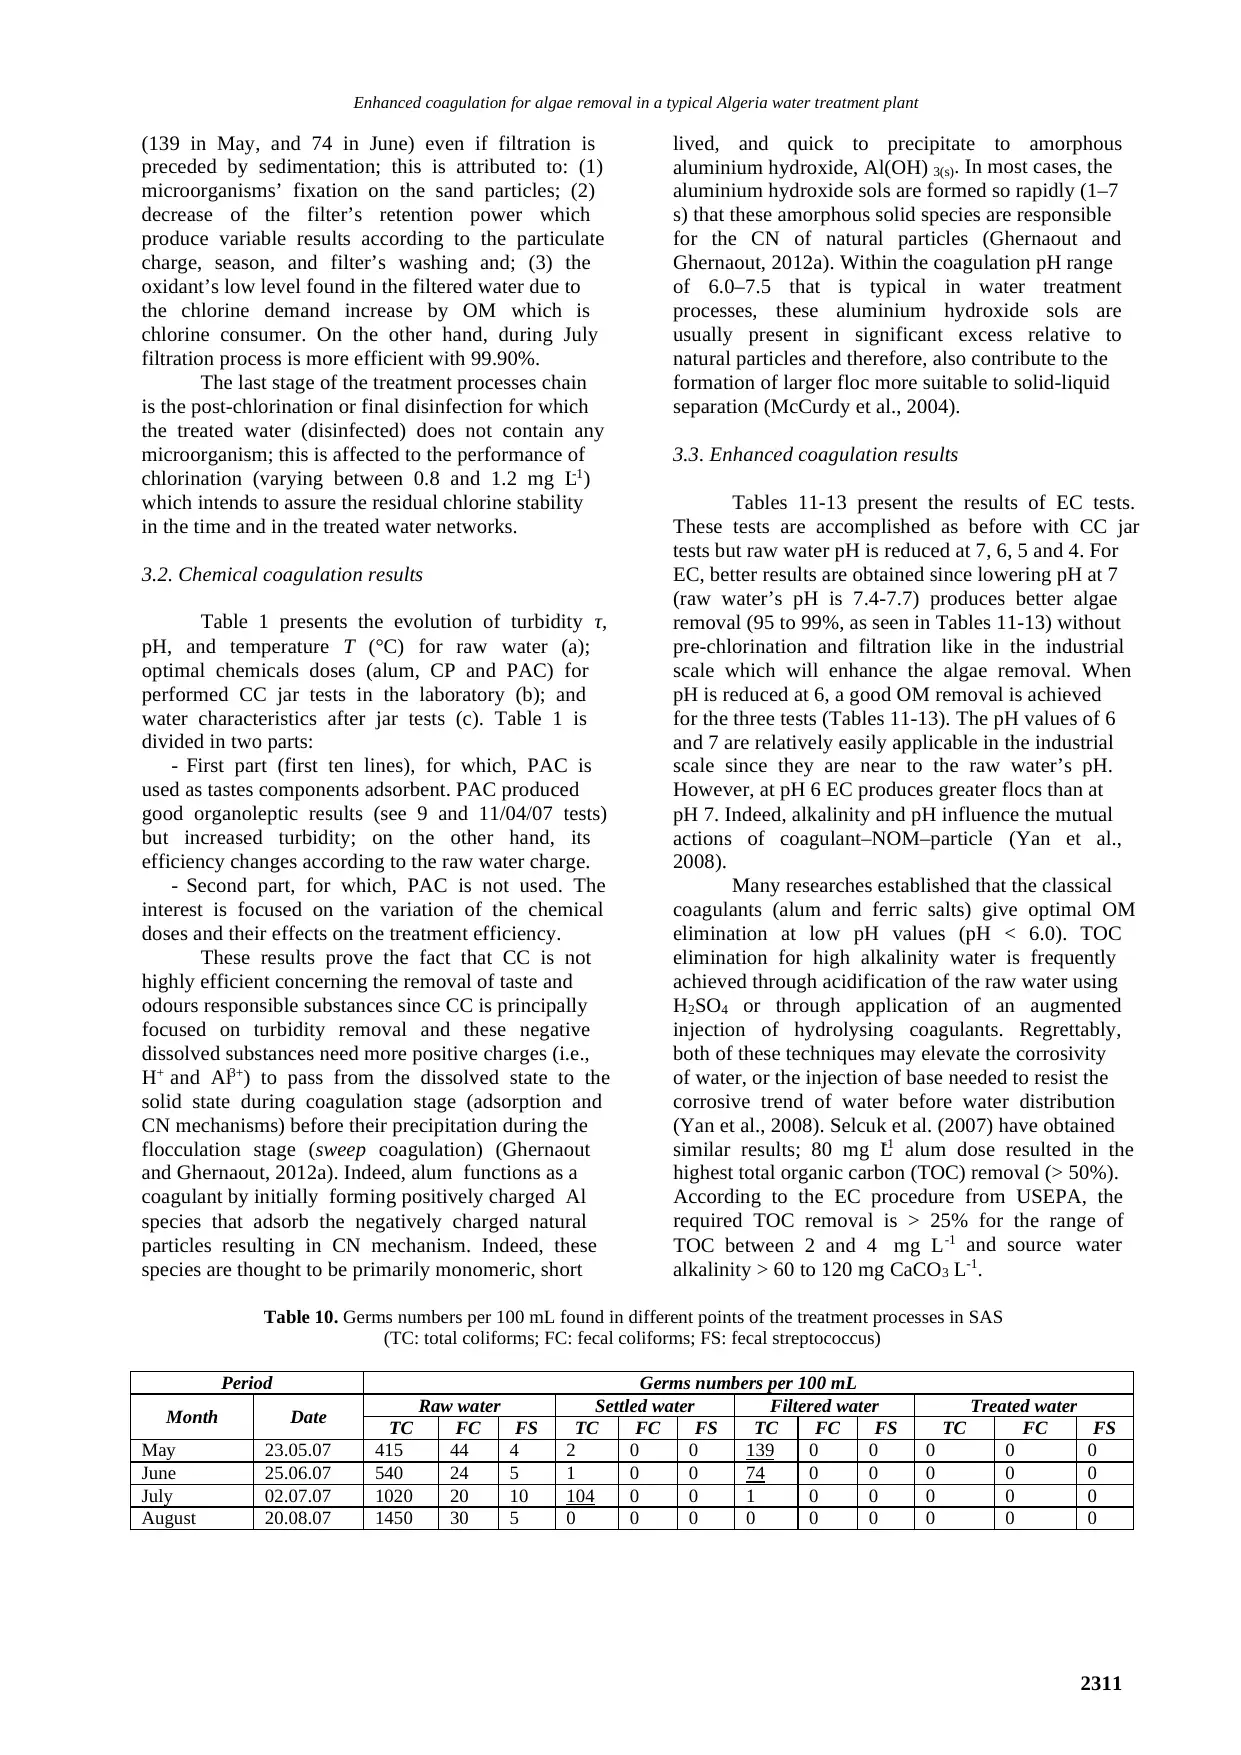
Enhanced coagulation for algae removal in a typical Algeria water treatment plant
(139 in May, and 74 in June) even if filtration is
preceded by sedimentation; this is attributed to: (1)
microorganisms’ fixation on the sand particles; (2)
decrease of the filter’s retention power which
produce variable results according to the particulate
charge, season, and filter’s washing and; (3) the
oxidant’s low level found in the filtered water due to
the chlorine demand increase by OM which is
chlorine consumer. On the other hand, during July
filtration process is more efficient with 99.90%.
The last stage of the treatment processes chain
is the post-chlorination or final disinfection for which
the treated water (disinfected) does not contain any
microorganism; this is affected to the performance of
chlorination (varying between 0.8 and 1.2 mg L-1)
which intends to assure the residual chlorine stability
in the time and in the treated water networks.
3.2. Chemical coagulation results
Table 1 presents the evolution of turbidity τ,
pH, and temperature T (°C) for raw water (a);
optimal chemicals doses (alum, CP and PAC) for
performed CC jar tests in the laboratory (b); and
water characteristics after jar tests (c). Table 1 is
divided in two parts:
- First part (first ten lines), for which, PAC is
used as tastes components adsorbent. PAC produced
good organoleptic results (see 9 and 11/04/07 tests)
but increased turbidity; on the other hand, its
efficiency changes according to the raw water charge.
- Second part, for which, PAC is not used. The
interest is focused on the variation of the chemical
doses and their effects on the treatment efficiency.
These results prove the fact that CC is not
highly efficient concerning the removal of taste and
odours responsible substances since CC is principally
focused on turbidity removal and these negative
dissolved substances need more positive charges (i.e.,
H+ and Al3+) to pass from the dissolved state to the
solid state during coagulation stage (adsorption and
CN mechanisms) before their precipitation during the
flocculation stage (sweep coagulation) (Ghernaout
and Ghernaout, 2012a). Indeed, alum functions as a
coagulant by initially forming positively charged Al
species that adsorb the negatively charged natural
particles resulting in CN mechanism. Indeed, these
species are thought to be primarily monomeric, short
lived, and quick to precipitate to amorphous
aluminium hydroxide, Al(OH) 3(s). In most cases, the
aluminium hydroxide sols are formed so rapidly (1–7
s) that these amorphous solid species are responsible
for the CN of natural particles (Ghernaout and
Ghernaout, 2012a). Within the coagulation pH range
of 6.0–7.5 that is typical in water treatment
processes, these aluminium hydroxide sols are
usually present in significant excess relative to
natural particles and therefore, also contribute to the
formation of larger floc more suitable to solid-liquid
separation (McCurdy et al., 2004).
3.3. Enhanced coagulation results
Tables 11-13 present the results of EC tests.
These tests are accomplished as before with CC jar
tests but raw water pH is reduced at 7, 6, 5 and 4. For
EC, better results are obtained since lowering pH at 7
(raw water’s pH is 7.4-7.7) produces better algae
removal (95 to 99%, as seen in Tables 11-13) without
pre-chlorination and filtration like in the industrial
scale which will enhance the algae removal. When
pH is reduced at 6, a good OM removal is achieved
for the three tests (Tables 11-13). The pH values of 6
and 7 are relatively easily applicable in the industrial
scale since they are near to the raw water’s pH.
However, at pH 6 EC produces greater flocs than at
pH 7. Indeed, alkalinity and pH influence the mutual
actions of coagulant–NOM–particle (Yan et al.,
2008).
Many researches established that the classical
coagulants (alum and ferric salts) give optimal OM
elimination at low pH values (pH < 6.0). TOC
elimination for high alkalinity water is frequently
achieved through acidification of the raw water using
H2SO4 or through application of an augmented
injection of hydrolysing coagulants. Regrettably,
both of these techniques may elevate the corrosivity
of water, or the injection of base needed to resist the
corrosive trend of water before water distribution
(Yan et al., 2008). Selcuk et al. (2007) have obtained
similar results; 80 mg L-1 alum dose resulted in the
highest total organic carbon (TOC) removal (> 50%).
According to the EC procedure from USEPA, the
required TOC removal is > 25% for the range of
TOC between 2 and 4 mg L-1 and source water
alkalinity > 60 to 120 mg CaCO3 L-1.
Table 10. Germs numbers per 100 mL found in different points of the treatment processes in SAS
(TC: total coliforms; FC: fecal coliforms; FS: fecal streptococcus)
Period Germs numbers per 100 mL
Month Date Raw water Settled water Filtered water Treated water
TC FC FS TC FC FS TC FC FS TC FC FS
May 23.05.07 415 44 4 2 0 0 139 0 0 0 0 0
June 25.06.07 540 24 5 1 0 0 74 0 0 0 0 0
July 02.07.07 1020 20 10 104 0 0 1 0 0 0 0 0
August 20.08.07 1450 30 5 0 0 0 0 0 0 0 0 0
2311
Paraphrase This Document
Need a fresh take? Get an instant paraphrase of this document with our AI Paraphraser
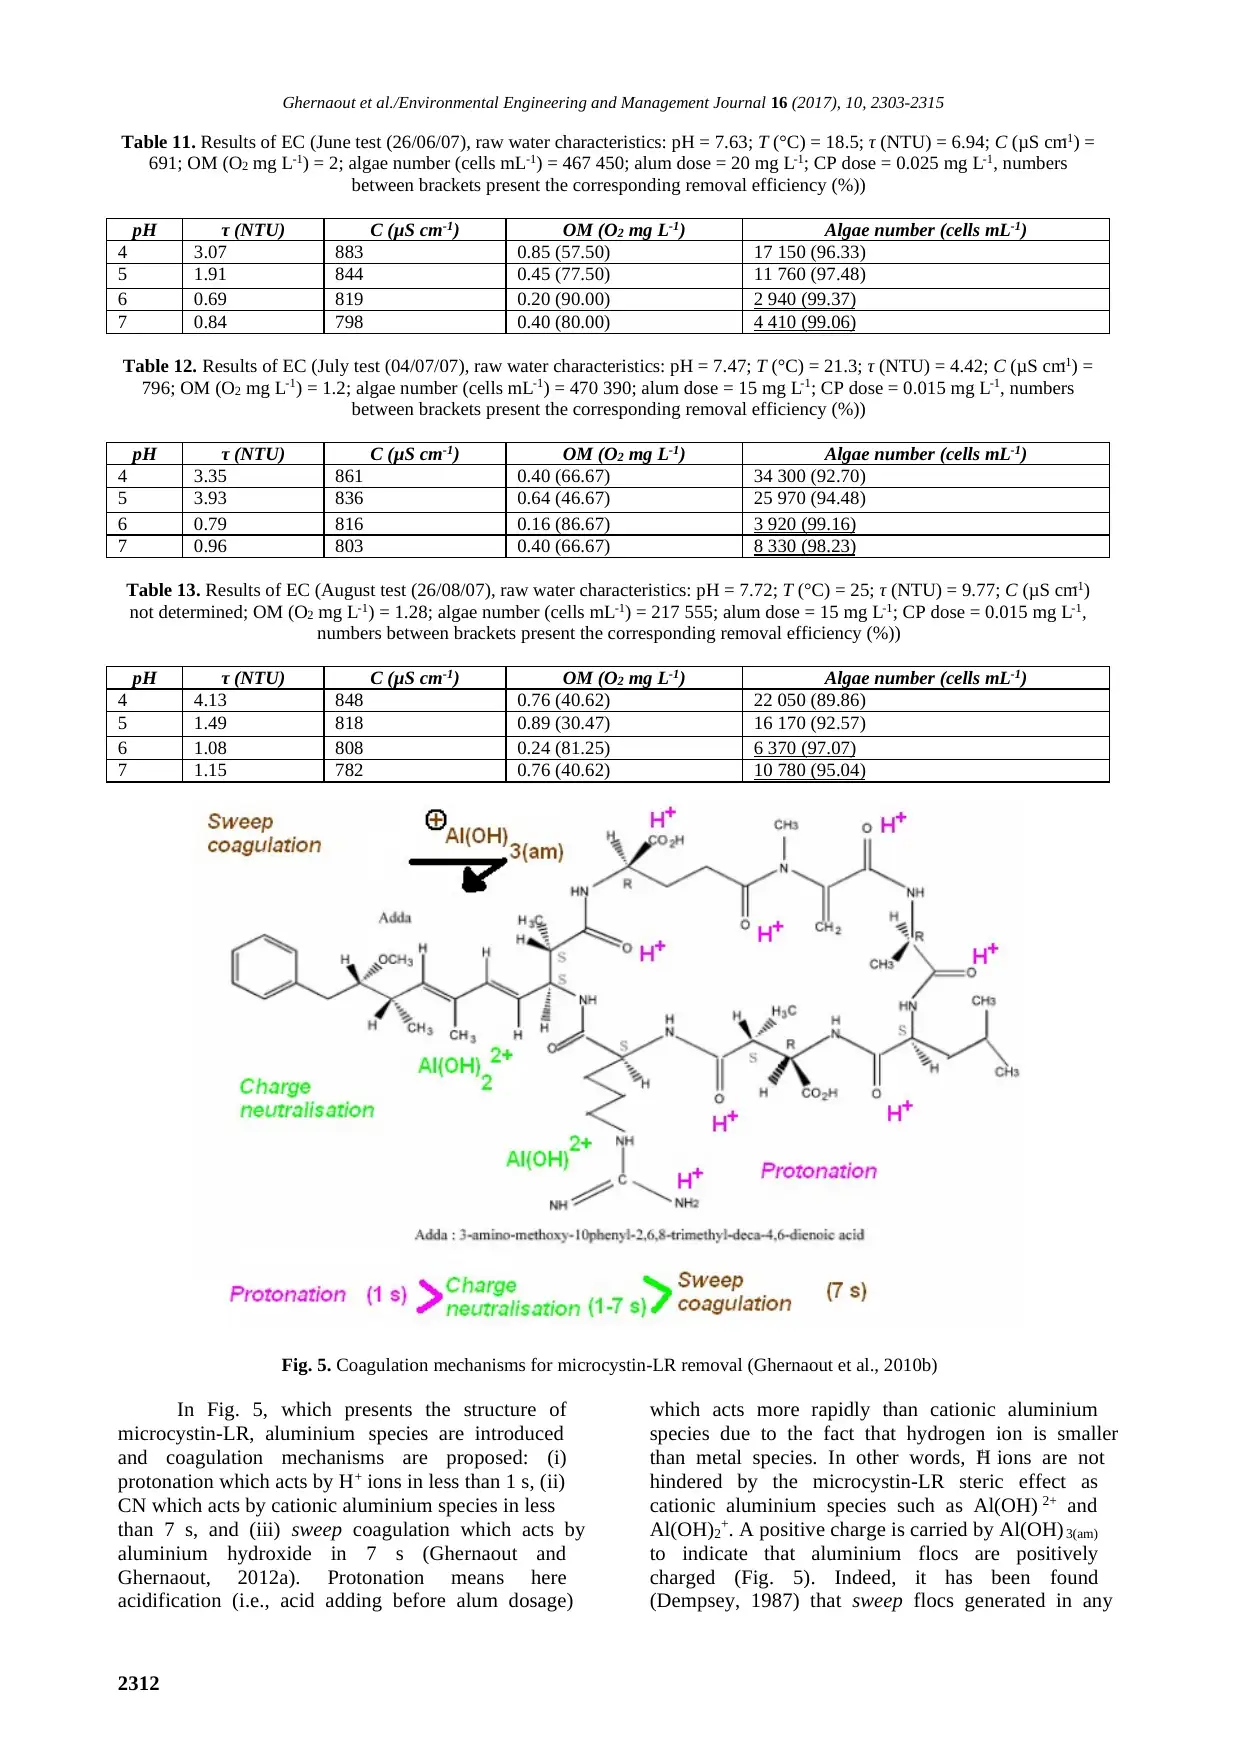
Ghernaout et al./Environmental Engineering and Management Journal 16 (2017), 10, 2303-2315
Table 11. Results of EC (June test (26/06/07), raw water characteristics: pH = 7.63; T (°C) = 18.5; τ (NTU) = 6.94; C (μS cm-1) =
691; OM (O2 mg L-1) = 2; algae number (cells mL-1) = 467 450; alum dose = 20 mg L-1; CP dose = 0.025 mg L-1, numbers
between brackets present the corresponding removal efficiency (%))
pH τ (NTU) C (μS cm-1) OM (O2 mg L-1) Algae number (cells mL-1)
4 3.07 883 0.85 (57.50) 17 150 (96.33)
5 1.91 844 0.45 (77.50) 11 760 (97.48)
6 0.69 819 0.20 (90.00) 2 940 (99.37)
7 0.84 798 0.40 (80.00) 4 410 (99.06)
Table 12. Results of EC (July test (04/07/07), raw water characteristics: pH = 7.47; T (°C) = 21.3; τ (NTU) = 4.42; C (μS cm-1) =
796; OM (O2 mg L-1) = 1.2; algae number (cells mL-1) = 470 390; alum dose = 15 mg L-1; CP dose = 0.015 mg L-1, numbers
between brackets present the corresponding removal efficiency (%))
pH τ (NTU) C (μS cm-1) OM (O2 mg L-1) Algae number (cells mL-1)
4 3.35 861 0.40 (66.67) 34 300 (92.70)
5 3.93 836 0.64 (46.67) 25 970 (94.48)
6 0.79 816 0.16 (86.67) 3 920 (99.16)
7 0.96 803 0.40 (66.67) 8 330 (98.23)
Table 13. Results of EC (August test (26/08/07), raw water characteristics: pH = 7.72; T (°C) = 25; τ (NTU) = 9.77; C (μS cm-1)
not determined; OM (O2 mg L-1) = 1.28; algae number (cells mL-1) = 217 555; alum dose = 15 mg L-1; CP dose = 0.015 mg L-1,
numbers between brackets present the corresponding removal efficiency (%))
pH τ (NTU) C (μS cm-1) OM (O2 mg L-1) Algae number (cells mL-1)
4 4.13 848 0.76 (40.62) 22 050 (89.86)
5 1.49 818 0.89 (30.47) 16 170 (92.57)
6 1.08 808 0.24 (81.25) 6 370 (97.07)
7 1.15 782 0.76 (40.62) 10 780 (95.04)
Fig. 5. Coagulation mechanisms for microcystin-LR removal (Ghernaout et al., 2010b)
In Fig. 5, which presents the structure of
microcystin-LR, aluminium species are introduced
and coagulation mechanisms are proposed: (i)
protonation which acts by H+ ions in less than 1 s, (ii)
CN which acts by cationic aluminium species in less
than 7 s, and (iii) sweep coagulation which acts by
aluminium hydroxide in 7 s (Ghernaout and
Ghernaout, 2012a). Protonation means here
acidification (i.e., acid adding before alum dosage)
which acts more rapidly than cationic aluminium
species due to the fact that hydrogen ion is smaller
than metal species. In other words, H+ ions are not
hindered by the microcystin-LR steric effect as
cationic aluminium species such as Al(OH) 2+ and
Al(OH)2+. A positive charge is carried by Al(OH) 3(am)
to indicate that aluminium flocs are positively
charged (Fig. 5). Indeed, it has been found
(Dempsey, 1987) that sweep flocs generated in any
2312
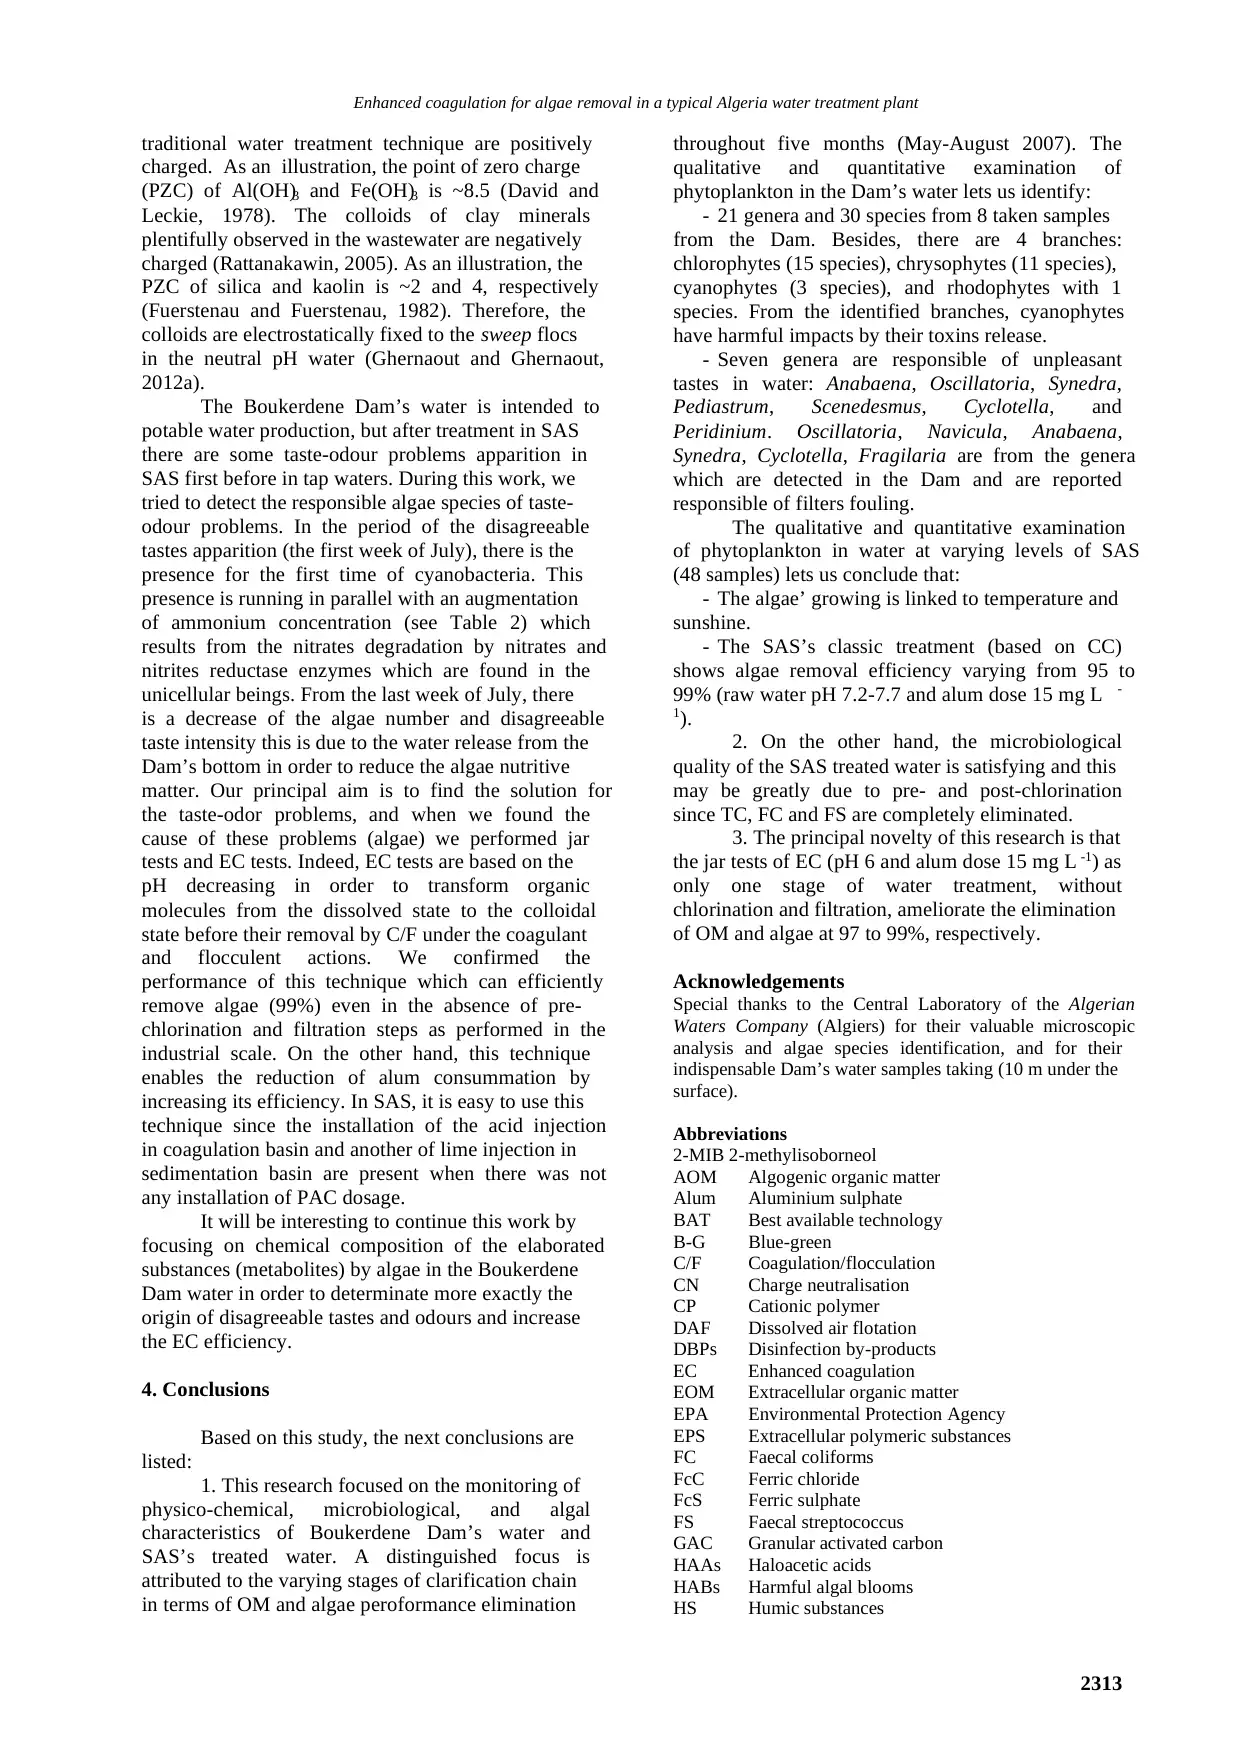
Enhanced coagulation for algae removal in a typical Algeria water treatment plant
traditional water treatment technique are positively
charged. As an illustration, the point of zero charge
(PZC) of Al(OH)3 and Fe(OH)3 is ~8.5 (David and
Leckie, 1978). The colloids of clay minerals
plentifully observed in the wastewater are negatively
charged (Rattanakawin, 2005). As an illustration, the
PZC of silica and kaolin is ~2 and 4, respectively
(Fuerstenau and Fuerstenau, 1982). Therefore, the
colloids are electrostatically fixed to the sweep flocs
in the neutral pH water (Ghernaout and Ghernaout,
2012a).
The Boukerdene Dam’s water is intended to
potable water production, but after treatment in SAS
there are some taste-odour problems apparition in
SAS first before in tap waters. During this work, we
tried to detect the responsible algae species of taste-
odour problems. In the period of the disagreeable
tastes apparition (the first week of July), there is the
presence for the first time of cyanobacteria. This
presence is running in parallel with an augmentation
of ammonium concentration (see Table 2) which
results from the nitrates degradation by nitrates and
nitrites reductase enzymes which are found in the
unicellular beings. From the last week of July, there
is a decrease of the algae number and disagreeable
taste intensity this is due to the water release from the
Dam’s bottom in order to reduce the algae nutritive
matter. Our principal aim is to find the solution for
the taste-odor problems, and when we found the
cause of these problems (algae) we performed jar
tests and EC tests. Indeed, EC tests are based on the
pH decreasing in order to transform organic
molecules from the dissolved state to the colloidal
state before their removal by C/F under the coagulant
and flocculent actions. We confirmed the
performance of this technique which can efficiently
remove algae (99%) even in the absence of pre-
chlorination and filtration steps as performed in the
industrial scale. On the other hand, this technique
enables the reduction of alum consummation by
increasing its efficiency. In SAS, it is easy to use this
technique since the installation of the acid injection
in coagulation basin and another of lime injection in
sedimentation basin are present when there was not
any installation of PAC dosage.
It will be interesting to continue this work by
focusing on chemical composition of the elaborated
substances (metabolites) by algae in the Boukerdene
Dam water in order to determinate more exactly the
origin of disagreeable tastes and odours and increase
the EC efficiency.
4. Conclusions
Based on this study, the next conclusions are
listed:
1. This research focused on the monitoring of
physico-chemical, microbiological, and algal
characteristics of Boukerdene Dam’s water and
SAS’s treated water. A distinguished focus is
attributed to the varying stages of clarification chain
in terms of OM and algae peroformance elimination
throughout five months (May-August 2007). The
qualitative and quantitative examination of
phytoplankton in the Dam’s water lets us identify:
- 21 genera and 30 species from 8 taken samples
from the Dam. Besides, there are 4 branches:
chlorophytes (15 species), chrysophytes (11 species),
cyanophytes (3 species), and rhodophytes with 1
species. From the identified branches, cyanophytes
have harmful impacts by their toxins release.
- Seven genera are responsible of unpleasant
tastes in water: Anabaena, Oscillatoria, Synedra,
Pediastrum, Scenedesmus, Cyclotella, and
Peridinium. Oscillatoria, Navicula, Anabaena,
Synedra, Cyclotella, Fragilaria are from the genera
which are detected in the Dam and are reported
responsible of filters fouling.
The qualitative and quantitative examination
of phytoplankton in water at varying levels of SAS
(48 samples) lets us conclude that:
- The algae’ growing is linked to temperature and
sunshine.
- The SAS’s classic treatment (based on CC)
shows algae removal efficiency varying from 95 to
99% (raw water pH 7.2-7.7 and alum dose 15 mg L -
1).
2. On the other hand, the microbiological
quality of the SAS treated water is satisfying and this
may be greatly due to pre- and post-chlorination
since TC, FC and FS are completely eliminated.
3. The principal novelty of this research is that
the jar tests of EC (pH 6 and alum dose 15 mg L -1) as
only one stage of water treatment, without
chlorination and filtration, ameliorate the elimination
of OM and algae at 97 to 99%, respectively.
Acknowledgements
Special thanks to the Central Laboratory of the Algerian
Waters Company (Algiers) for their valuable microscopic
analysis and algae species identification, and for their
indispensable Dam’s water samples taking (10 m under the
surface).
Abbreviations
2-MIB 2-methylisoborneol
AOM Algogenic organic matter
Alum Aluminium sulphate
BAT Best available technology
B-G Blue-green
C/F Coagulation/flocculation
CN Charge neutralisation
CP Cationic polymer
DAF Dissolved air flotation
DBPs Disinfection by-products
EC Enhanced coagulation
EOM Extracellular organic matter
EPA Environmental Protection Agency
EPS Extracellular polymeric substances
FC Faecal coliforms
FcC Ferric chloride
FcS Ferric sulphate
FS Faecal streptococcus
GAC Granular activated carbon
HAAs Haloacetic acids
HABs Harmful algal blooms
HS Humic substances
2313
⊘ This is a preview!⊘
Do you want full access?
Subscribe today to unlock all pages.
Trusted by 1+ million students worldwide
1 out of 14
Your All-in-One AI-Powered Toolkit for Academic Success.
+13062052269
info@desklib.com
Available 24*7 on WhatsApp / Email
![[object Object]](/_next/static/media/star-bottom.7253800d.svg)
Unlock your academic potential
Copyright © 2020–2026 A2Z Services. All Rights Reserved. Developed and managed by ZUCOL.