Business Decision Making Analysis: Brit College Enrollment Report
VerifiedAdded on  2019/12/28
|28
|3707
|151
Report
AI Summary
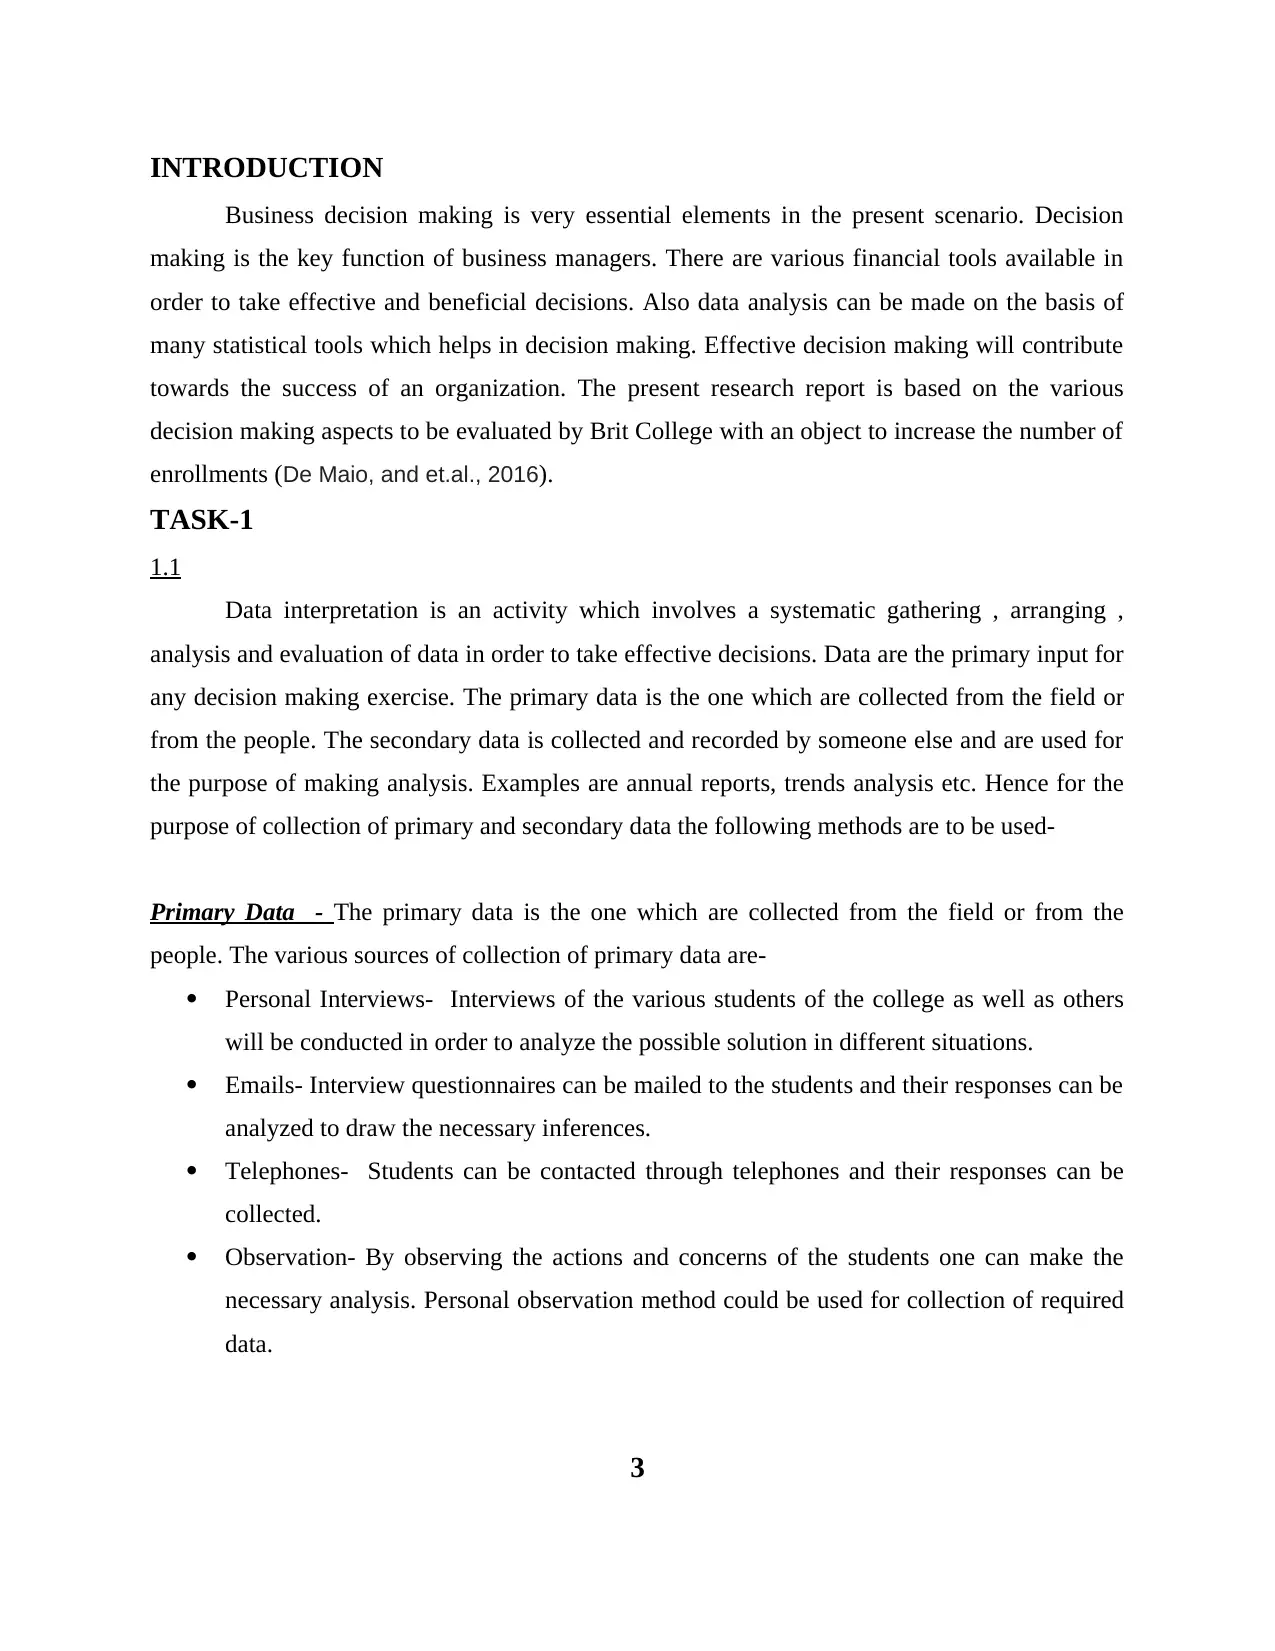
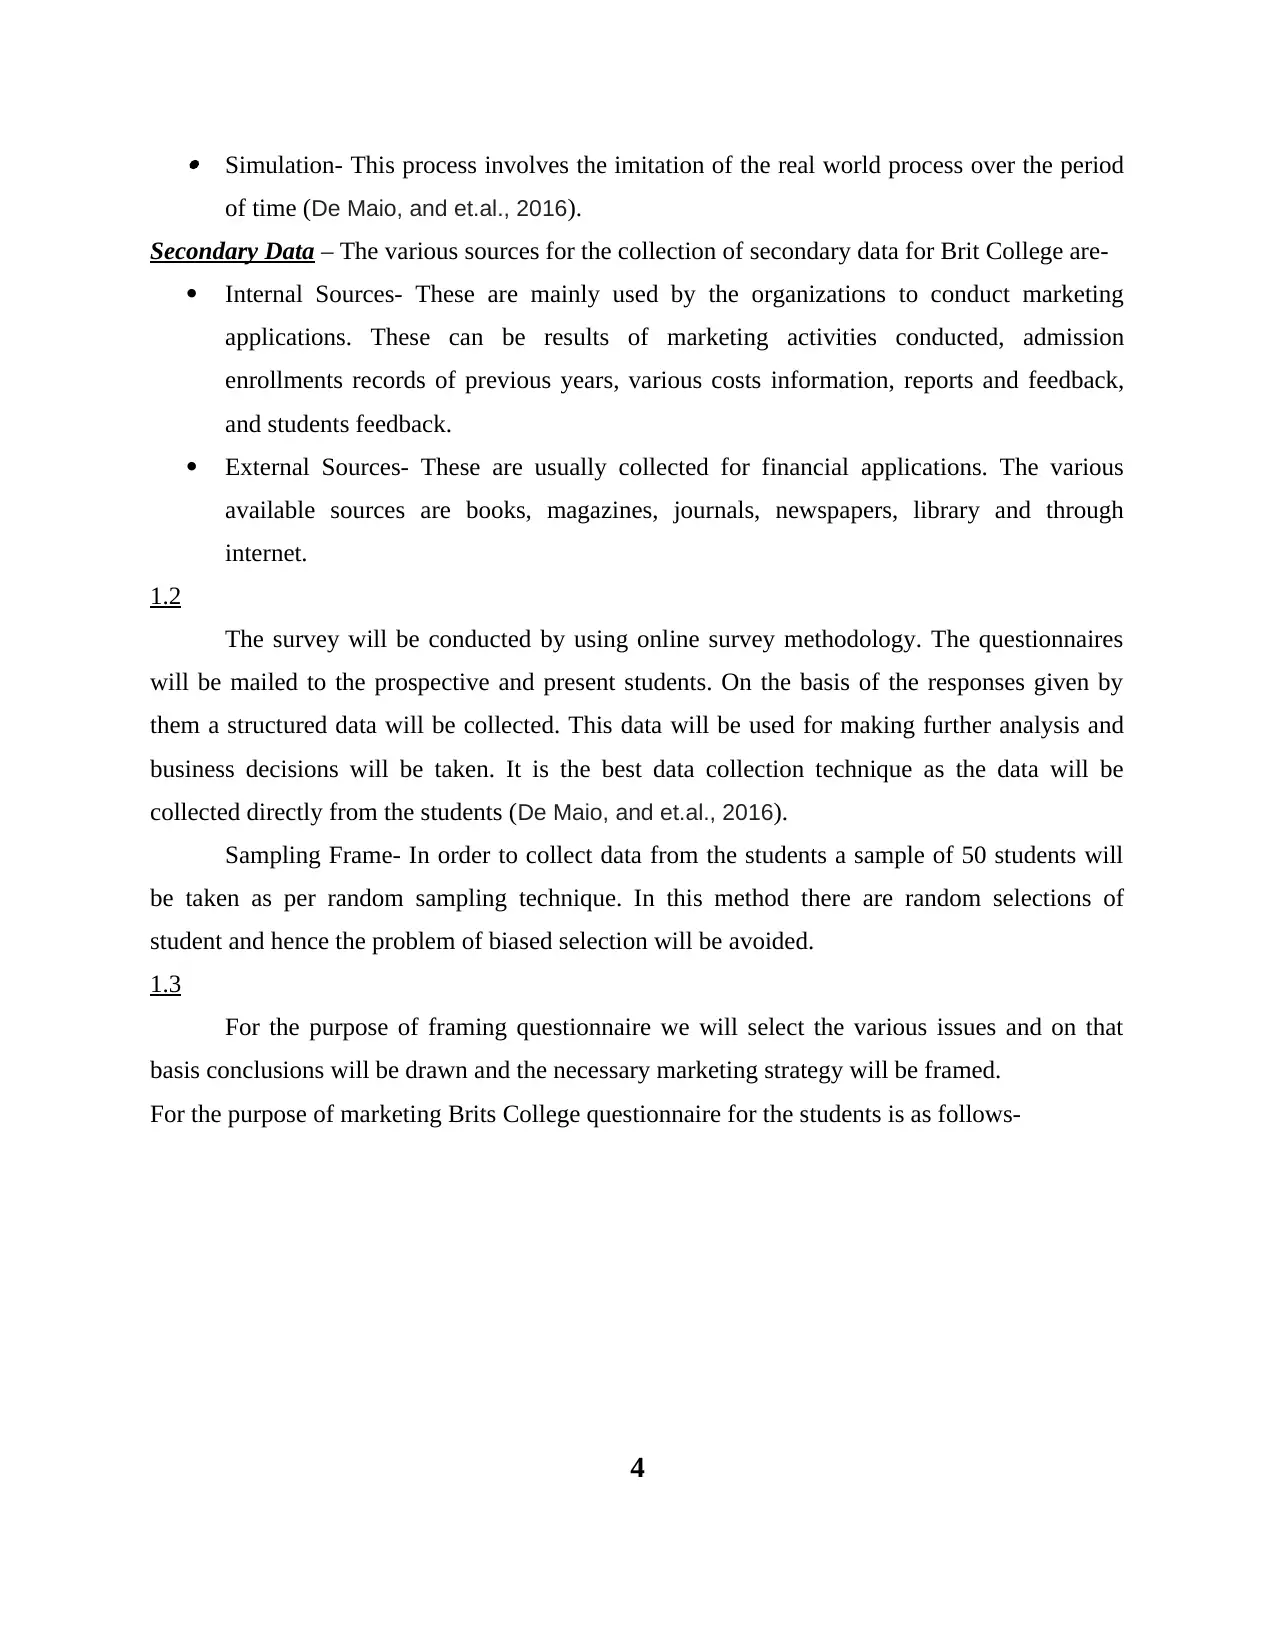
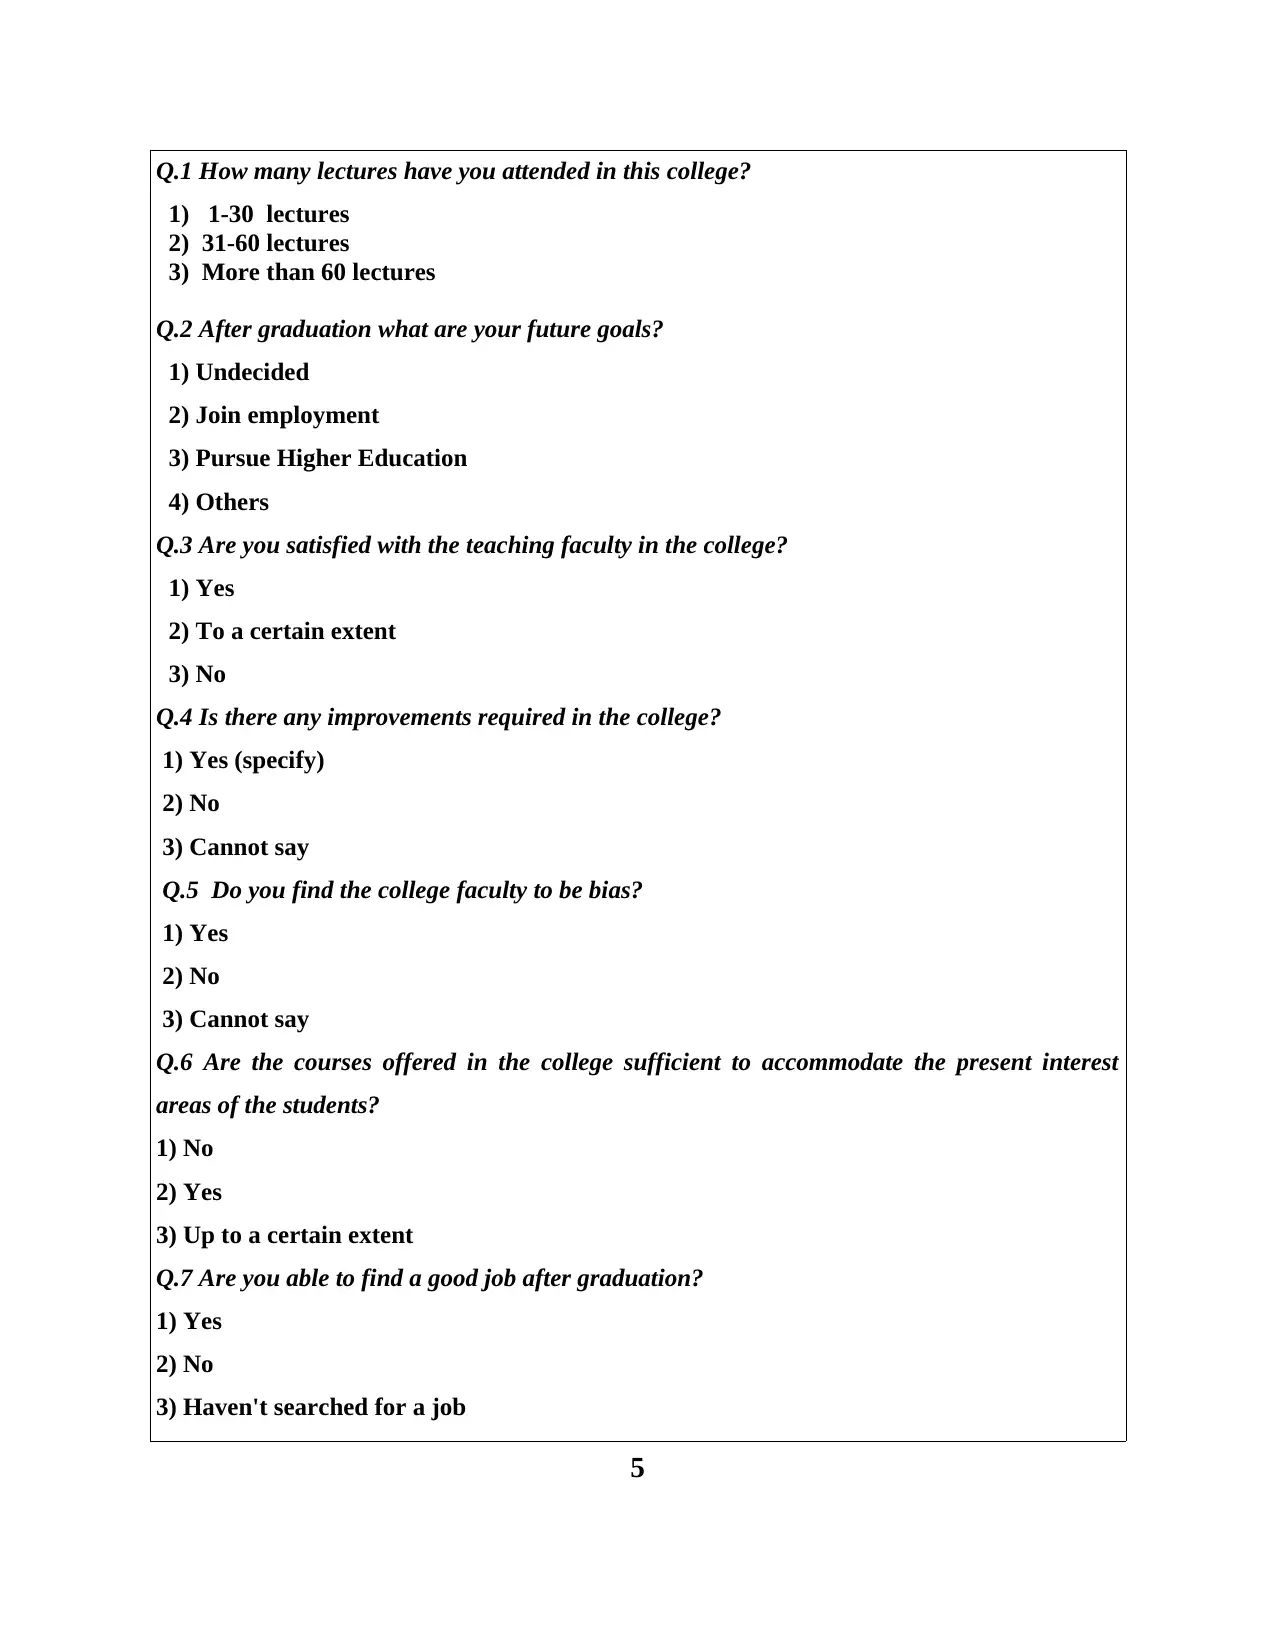
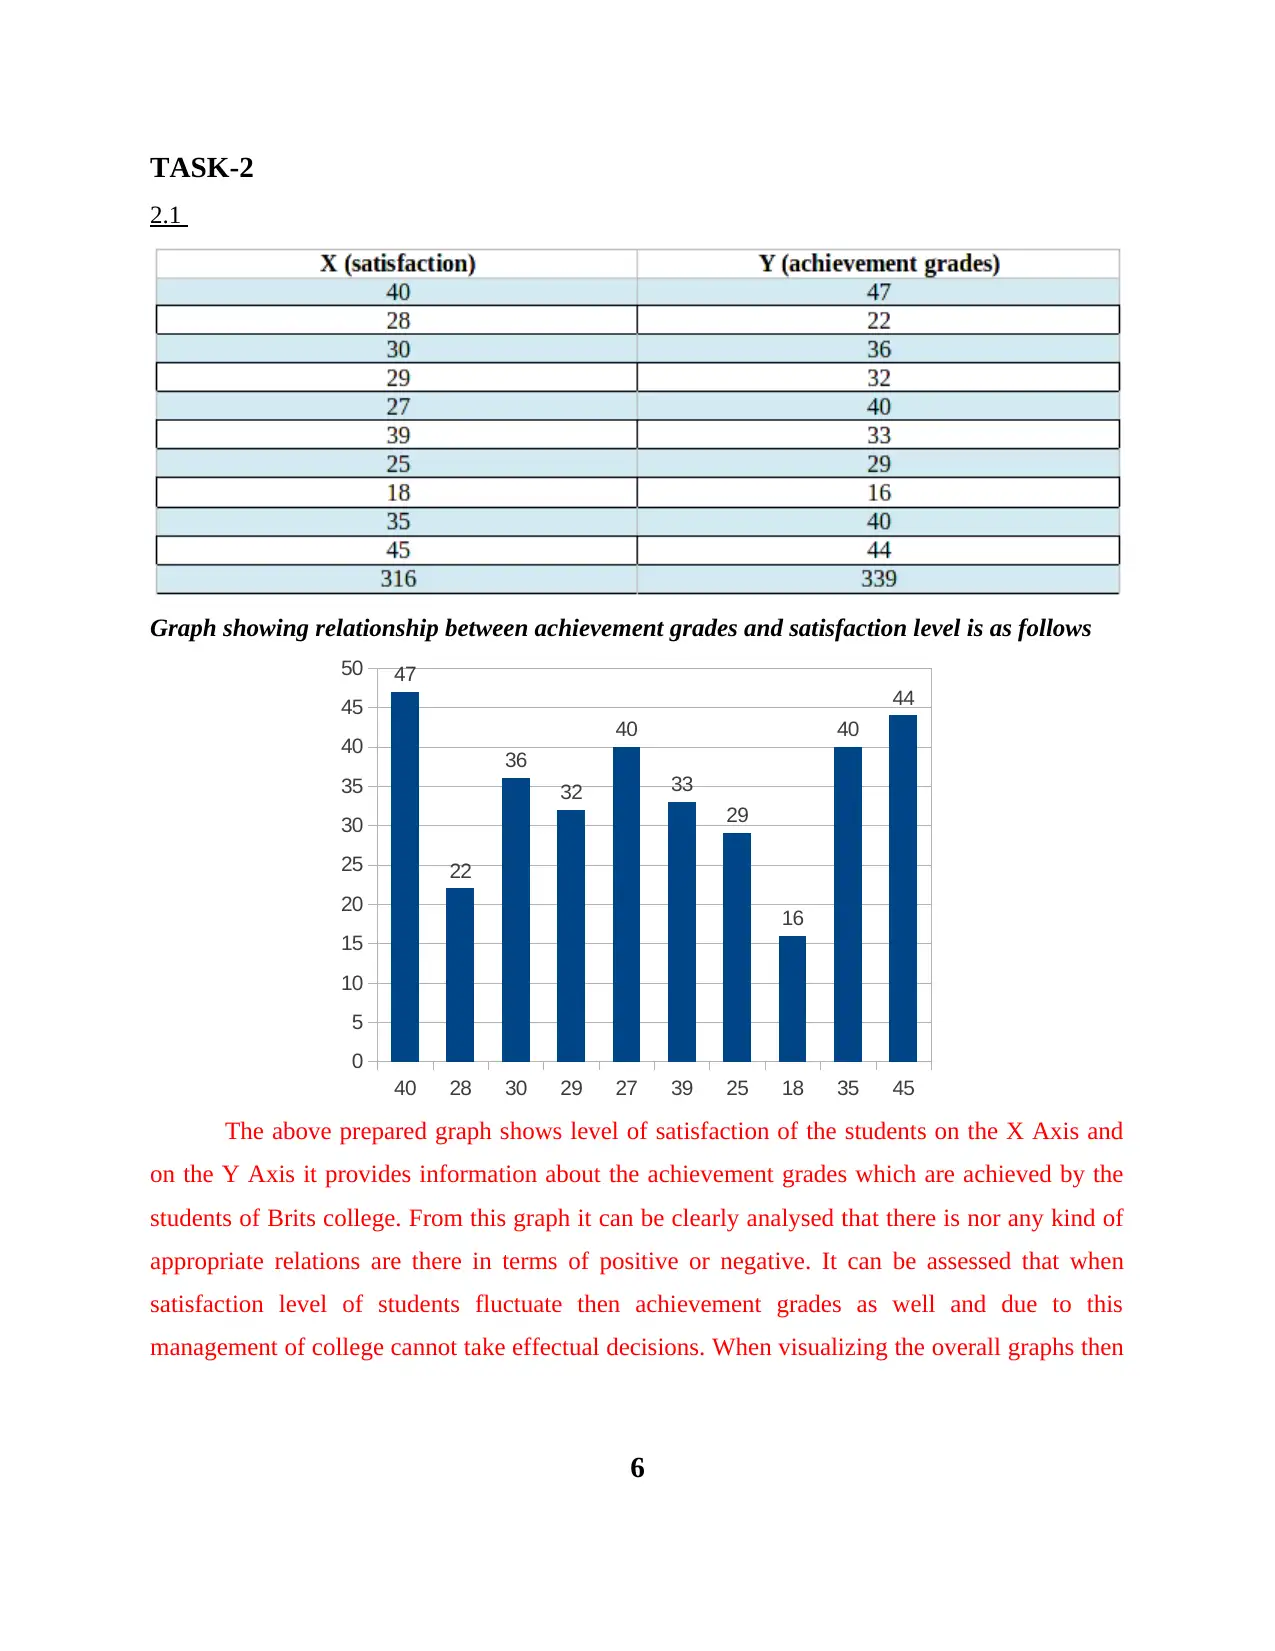
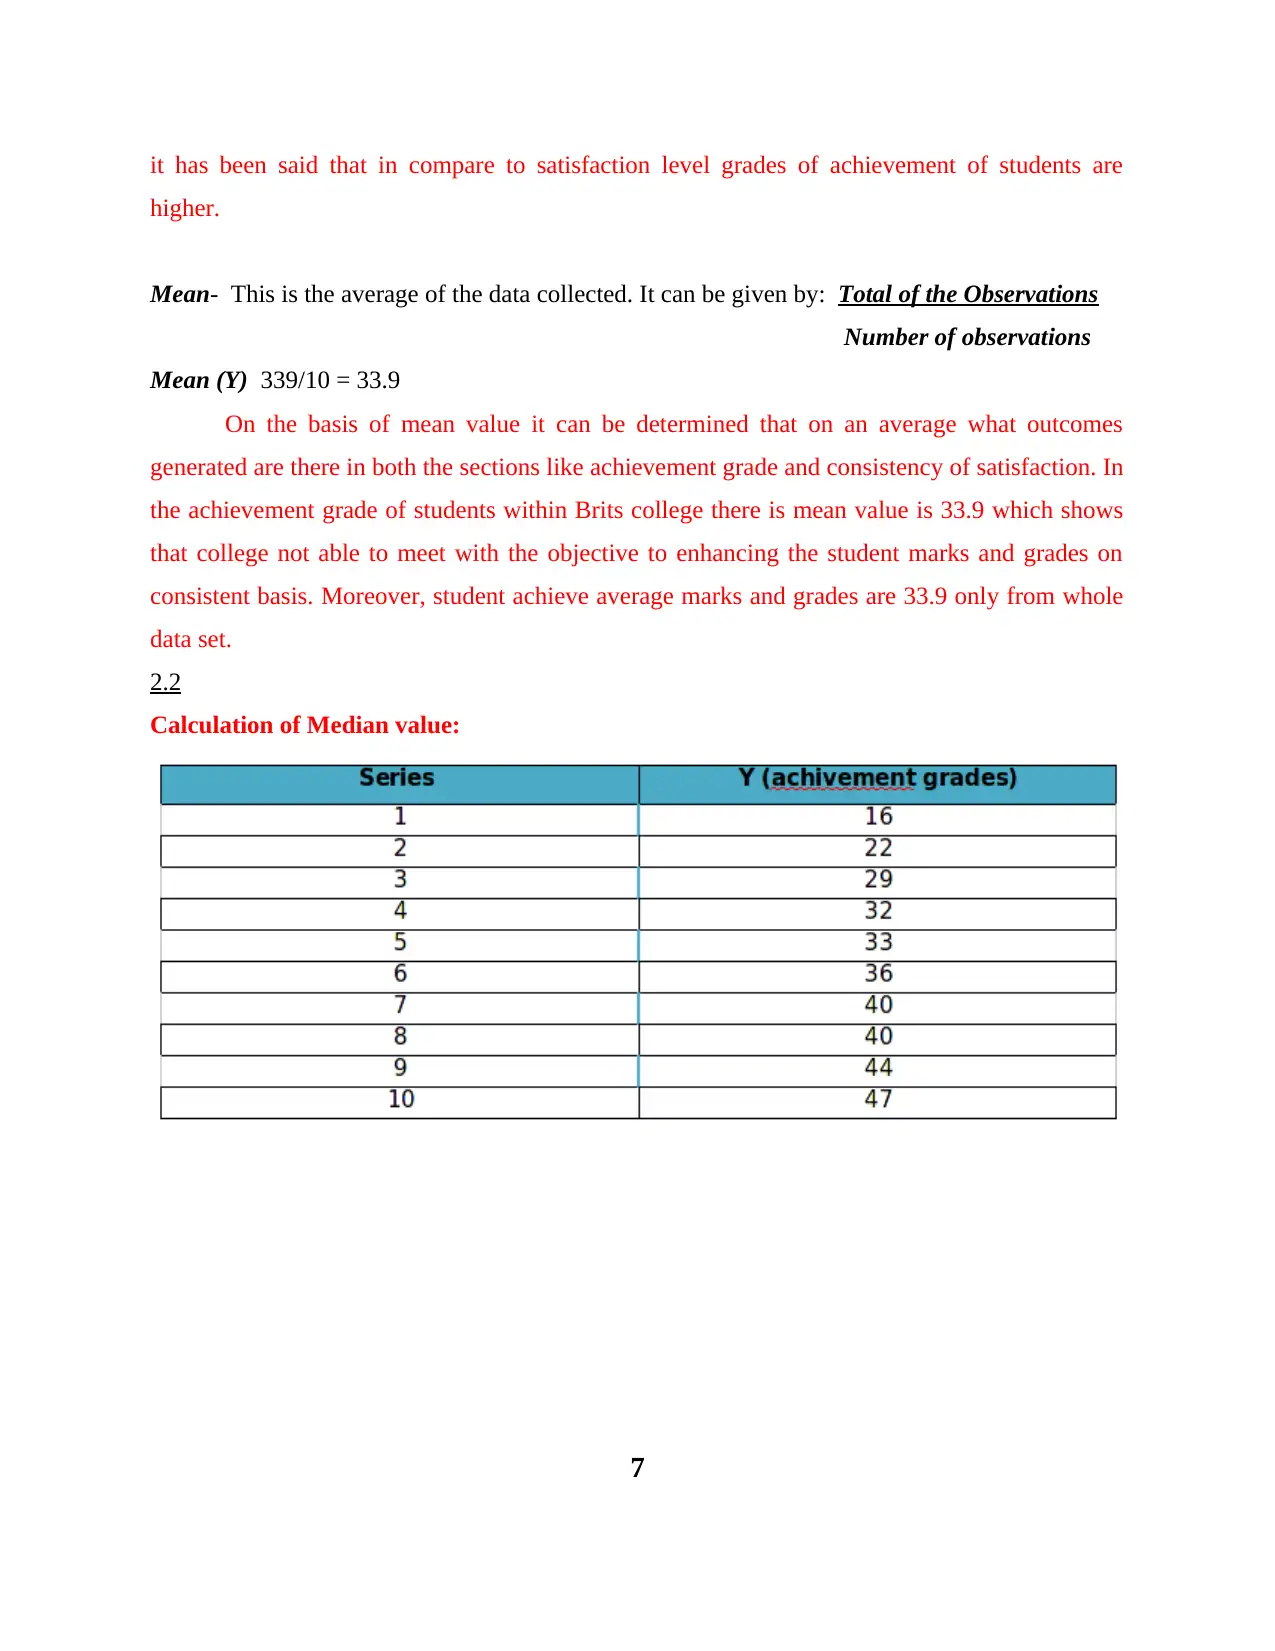
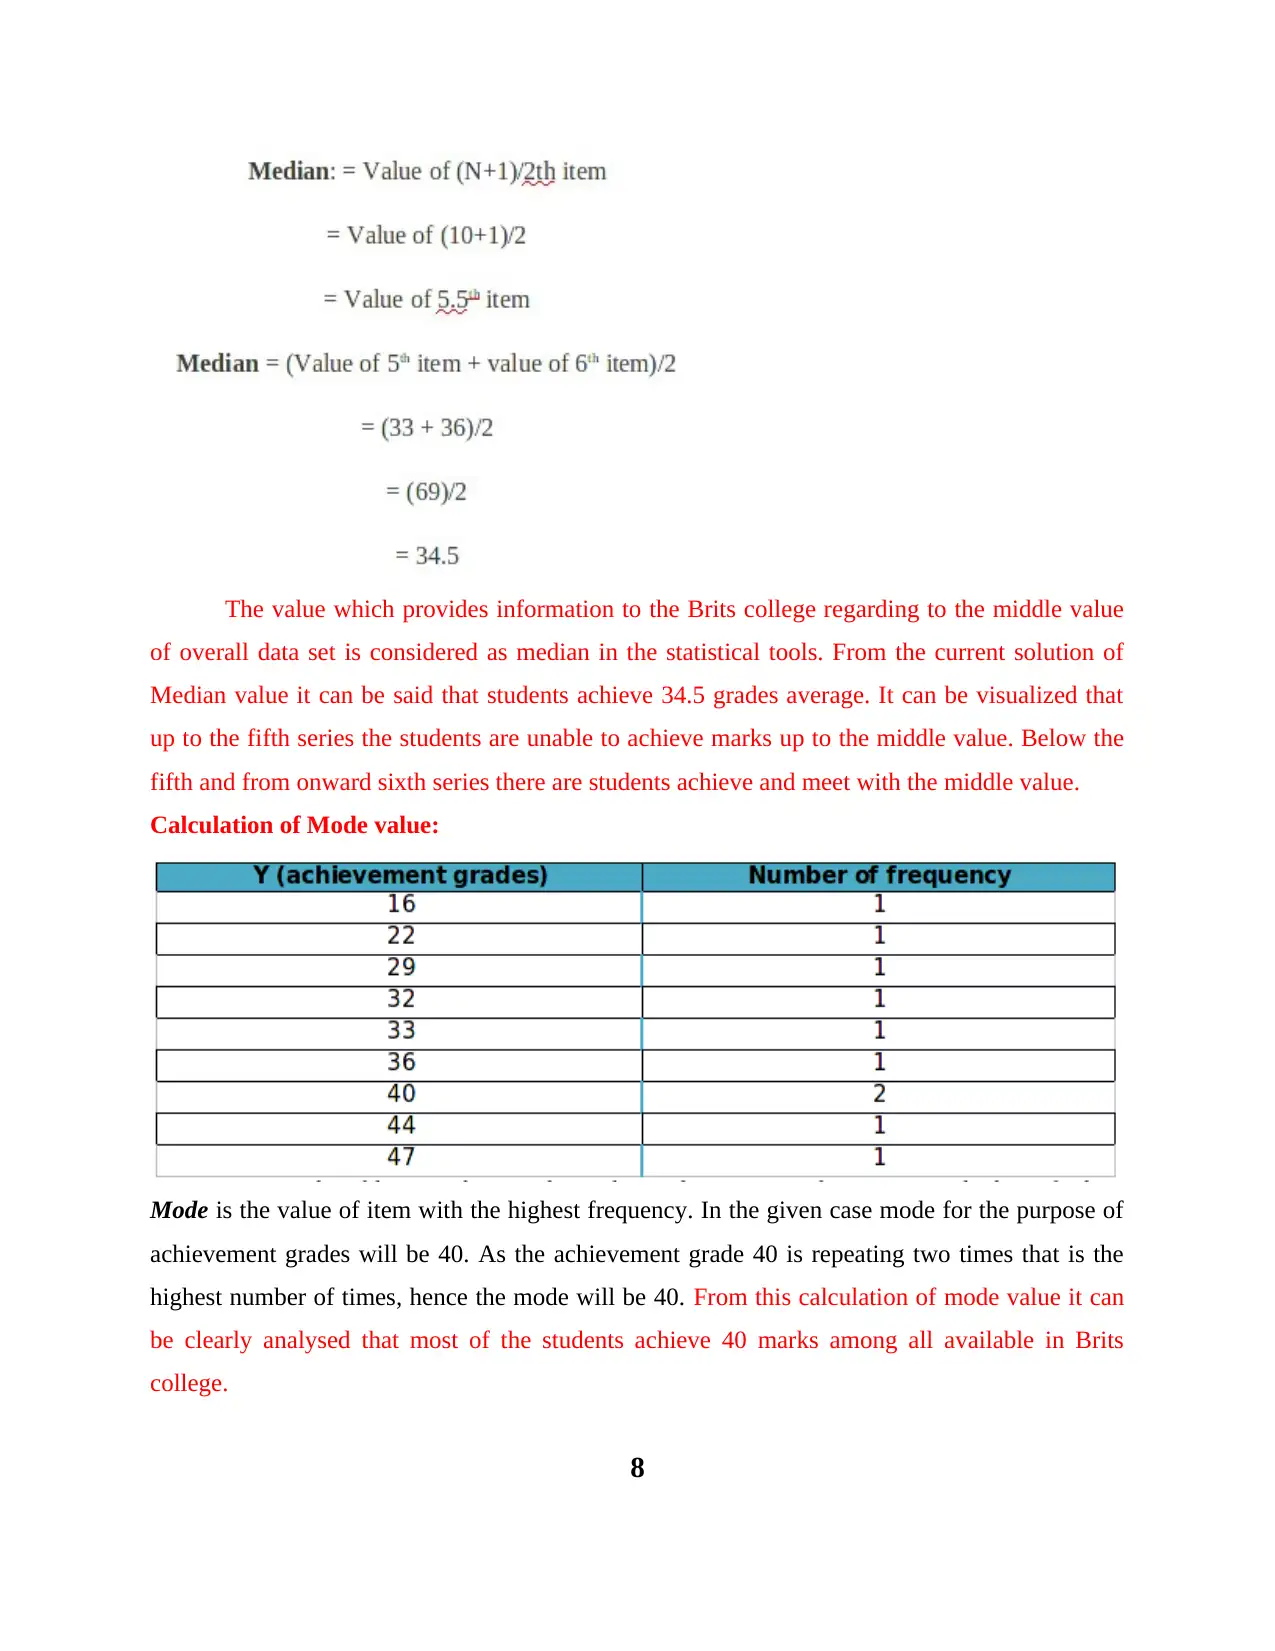
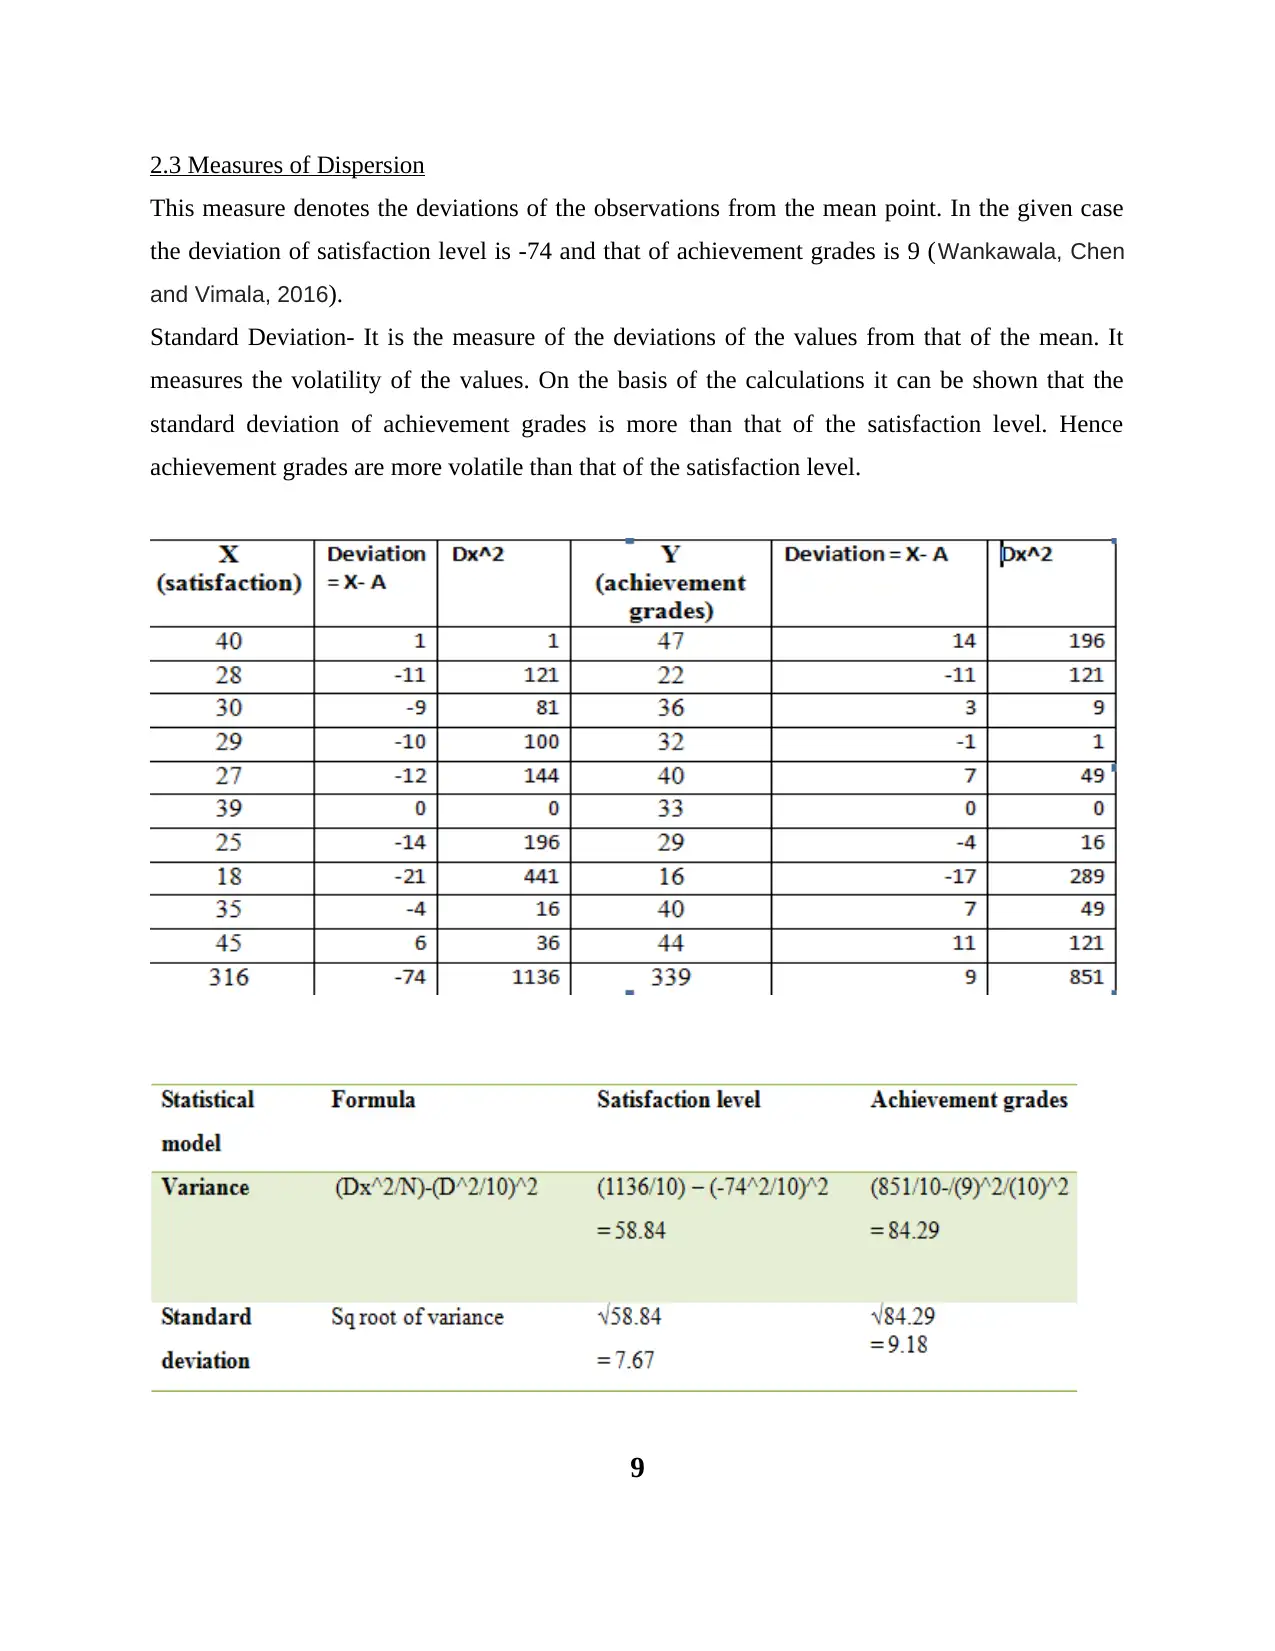
This report provides a comprehensive analysis of Brit College's enrollment, focusing on data interpretation, statistical analysis, and survey results to inform business decisions and strategies for increasing student enrollment. The report includes an introduction to business decision-making, explaining its importance and the use of financial and statistical tools. Task 1 covers data collection methods, including primary (interviews, emails, phone calls, observation, and simulation) and secondary sources (internal and external). A questionnaire designed to assess student satisfaction, future goals, and perceptions of the college is also presented. Task 2 delves into data analysis, using graphs to show the relationship between achievement grades and satisfaction levels, calculating mean, median, and mode, and discussing measures of dispersion like standard deviation, quartiles, percentiles, and correlation coefficients. Task 3 presents line and bar graphs, and scatter plots with trend lines to analyze the relationship between satisfaction and grades. Finally, the report concludes with a formal business report summarizing the findings and recommendations for the college. The report aims to provide insights into the factors affecting enrollment and offer strategies to improve student satisfaction and academic performance.

Business Decision
Making
Making
Paraphrase This Document
Need a fresh take? Get an instant paraphrase of this document with our AI Paraphraser

TABLE OF CONTENTS
Introduction......................................................................................................................................3
Task-1..............................................................................................................................................3
1.1................................................................................................................................................3
1.2 ..............................................................................................................................................4
1.3................................................................................................................................................4
Task-2 .............................................................................................................................................6
2.1 ...............................................................................................................................................6
2.2................................................................................................................................................7
2.3 Measures of Dispersion.........................................................................................................9
2.4 Quartiles & Percentiles......................................................................................................10
Task-3............................................................................................................................................11
3.1..............................................................................................................................................11
3.2 Scatter graph and Trend Line..............................................................................................12
3.3 Presentation..........................................................................................................................14
3.4 Business Report...................................................................................................................22
Task-4 ...........................................................................................................................................23
4.1..............................................................................................................................................23
4.2 .............................................................................................................................................24
4.3 NPV & IRR..........................................................................................................................26
Conclusion.....................................................................................................................................27
References......................................................................................................................................28
2

INTRODUCTION
Business decision making is very essential elements in the present scenario. Decision
making is the key function of business managers. There are various financial tools available in
order to take effective and beneficial decisions. Also data analysis can be made on the basis of
many statistical tools which helps in decision making. Effective decision making will contribute
towards the success of an organization. The present research report is based on the various
decision making aspects to be evaluated by Brit College with an object to increase the number of
enrollments (De Maio, and et.al., 2016).
TASK-1
1.1
Data interpretation is an activity which involves a systematic gathering , arranging ,
analysis and evaluation of data in order to take effective decisions. Data are the primary input for
any decision making exercise. The primary data is the one which are collected from the field or
from the people. The secondary data is collected and recorded by someone else and are used for
the purpose of making analysis. Examples are annual reports, trends analysis etc. Hence for the
purpose of collection of primary and secondary data the following methods are to be used-
Primary Data - The primary data is the one which are collected from the field or from the
people. The various sources of collection of primary data are-
ï‚· Personal Interviews- Interviews of the various students of the college as well as others
will be conducted in order to analyze the possible solution in different situations.
ï‚· Emails- Interview questionnaires can be mailed to the students and their responses can be
analyzed to draw the necessary inferences.
ï‚· Telephones- Students can be contacted through telephones and their responses can be
collected.
ï‚· Observation- By observing the actions and concerns of the students one can make the
necessary analysis. Personal observation method could be used for collection of required
data.
3
⊘ This is a preview!⊘
Do you want full access?
Subscribe today to unlock all pages.

Trusted by 1+ million students worldwide

ï‚· Simulation- This process involves the imitation of the real world process over the period
of time (De Maio, and et.al., 2016).
Secondary Data – The various sources for the collection of secondary data for Brit College are-
ï‚· Internal Sources- These are mainly used by the organizations to conduct marketing
applications. These can be results of marketing activities conducted, admission
enrollments records of previous years, various costs information, reports and feedback,
and students feedback.
ï‚· External Sources- These are usually collected for financial applications. The various
available sources are books, magazines, journals, newspapers, library and through
internet.
1.2
The survey will be conducted by using online survey methodology. The questionnaires
will be mailed to the prospective and present students. On the basis of the responses given by
them a structured data will be collected. This data will be used for making further analysis and
business decisions will be taken. It is the best data collection technique as the data will be
collected directly from the students (De Maio, and et.al., 2016).
Sampling Frame- In order to collect data from the students a sample of 50 students will
be taken as per random sampling technique. In this method there are random selections of
student and hence the problem of biased selection will be avoided.
1.3
For the purpose of framing questionnaire we will select the various issues and on that
basis conclusions will be drawn and the necessary marketing strategy will be framed.
For the purpose of marketing Brits College questionnaire for the students is as follows-
4
Paraphrase This Document
Need a fresh take? Get an instant paraphrase of this document with our AI Paraphraser

Q.1 How many lectures have you attended in this college?
1) 1-30 lectures
2) 31-60 lectures
3) More than 60 lectures
Q.2 After graduation what are your future goals?
1) Undecided
2) Join employment
3) Pursue Higher Education
4) Others
Q.3 Are you satisfied with the teaching faculty in the college?
1) Yes
2) To a certain extent
3) No
Q.4 Is there any improvements required in the college?
1) Yes (specify)
2) No
3) Cannot say
Q.5 Do you find the college faculty to be bias?
1) Yes
2) No
3) Cannot say
Q.6 Are the courses offered in the college sufficient to accommodate the present interest
areas of the students?
1) No
2) Yes
3) Up to a certain extent
Q.7 Are you able to find a good job after graduation?
1) Yes
2) No
3) Haven't searched for a job
5

TASK-2
2.1
Graph showing relationship between achievement grades and satisfaction level is as follows
40 28 30 29 27 39 25 18 35 45
0
5
10
15
20
25
30
35
40
45
50 47
22
36
32
40
33
29
16
40
44
The above prepared graph shows level of satisfaction of the students on the X Axis and
on the Y Axis it provides information about the achievement grades which are achieved by the
students of Brits college. From this graph it can be clearly analysed that there is nor any kind of
appropriate relations are there in terms of positive or negative. It can be assessed that when
satisfaction level of students fluctuate then achievement grades as well and due to this
management of college cannot take effectual decisions. When visualizing the overall graphs then
6
⊘ This is a preview!⊘
Do you want full access?
Subscribe today to unlock all pages.

Trusted by 1+ million students worldwide

it has been said that in compare to satisfaction level grades of achievement of students are
higher.
Mean- This is the average of the data collected. It can be given by: Total of the Observations
Number of observations
Mean (Y) 339/10 = 33.9
On the basis of mean value it can be determined that on an average what outcomes
generated are there in both the sections like achievement grade and consistency of satisfaction. In
the achievement grade of students within Brits college there is mean value is 33.9 which shows
that college not able to meet with the objective to enhancing the student marks and grades on
consistent basis. Moreover, student achieve average marks and grades are 33.9 only from whole
data set.
2.2
Calculation of Median value:
7
Paraphrase This Document
Need a fresh take? Get an instant paraphrase of this document with our AI Paraphraser

The value which provides information to the Brits college regarding to the middle value
of overall data set is considered as median in the statistical tools. From the current solution of
Median value it can be said that students achieve 34.5 grades average. It can be visualized that
up to the fifth series the students are unable to achieve marks up to the middle value. Below the
fifth and from onward sixth series there are students achieve and meet with the middle value.
Calculation of Mode value:
Mode is the value of item with the highest frequency. In the given case mode for the purpose of
achievement grades will be 40. As the achievement grade 40 is repeating two times that is the
highest number of times, hence the mode will be 40. From this calculation of mode value it can
be clearly analysed that most of the students achieve 40 marks among all available in Brits
college.
8

2.3 Measures of Dispersion
This measure denotes the deviations of the observations from the mean point. In the given case
the deviation of satisfaction level is -74 and that of achievement grades is 9 (Wankawala, Chen
and Vimala, 2016).
Standard Deviation- It is the measure of the deviations of the values from that of the mean. It
measures the volatility of the values. On the basis of the calculations it can be shown that the
standard deviation of achievement grades is more than that of the satisfaction level. Hence
achievement grades are more volatile than that of the satisfaction level.
9
⊘ This is a preview!⊘
Do you want full access?
Subscribe today to unlock all pages.

Trusted by 1+ million students worldwide

Analysis of Standard deviation:
By considering the above calculation it can be clearly assessed that mean value deviate in
case of achievement grades is from 9.18 and in the satisfaction level deviates from 7.67. Average
value achievement is like 33.9 and at this position deviation value is 9.18 which indicates that
there is huge difference arises between both. On the basis of this analysis it can be assessed that
Brits college is not too much efficient for enhancing the level of grades in appropriate manner.
Due to this satisfaction level also not better and for that management needs to take effectual kind
of actions.
2.4 Quartiles & Percentiles
Quartile/ Percentile X (satisfaction) Y (achievement grades)
1st quartile/25th percentile 27.25 29.75
2nd quartile/50th percentile 29.5 34.5
3rd quartile/75th percentile 38 40
Quartiles- This values represents the 25% , 50% and 75% of the values of three different
quarters. In the given case values of the different quarters have been shown which are such as
27.25, 29.5 and 38 for lower, middle and upper quartile respectively in case of satisfaction level.
Apart from this, when talking about the achievement grades then at the lower, middle and upper
quartile values arises are like 29.75, 34.5 and 40 respectively. Along with this, lower quartile
shows 25th percentile, middle and upper quartile shows to the 50th and 75th percentile respectively
and due to which values are equal in every stage of quartile and percentile.
Correlation of Coefficient
Particulars Achievement grades Satisfaction level
Achievement grades 1 0.78
Satisfaction level 0.78 1
10
Paraphrase This Document
Need a fresh take? Get an instant paraphrase of this document with our AI Paraphraser

Correlation of coefficient provides information to the Brits college then between
achievement grades and satisfaction level there is which kind of relationship. Generally outcome
of correlation is always in between -1 to +1. At the present scenario the value is 0.78 which
shows that if satisfaction level of gets change then achievement grades as well in same direction.
For example if level of satisfaction of students increase by 1 then grades of them will also
enhance by 0.78.
TASK-3
3.1
Line Graph
40 28 30 29 27 39 25 18 35 45
0
5
10
15
20
25
30
35
40
45
50 47
22
36
32
40
33
29
16
40
44
A c hiev em ent G rades (Y )
Bar Graph
11

40
28
30
29
27
39
25
18
35
45
0 5 10 15 20 25 30 35 40 45 50
47
22
36
32
40
33
29
16
40
44
A c hiev em ent G rades (Y )
Interpretation and Analysis
Above mentioned line and bar graph shows that achievement grades of Brits college are
going in increasing way or whether decrease. From both the charts it can be interpreted that at
the satisfaction level of 40 students of Brits college achieve 47 grades. Apart from this, when
satisfaction reduce up to 28 then grades also from 47 to 22. When it the students are more satisfy
and level shifts from 28 to 30 then same condition arises in the grade achievement which is like
improve from 22 to 36. Hence, it can be said and analysed that when the students having more
satisfaction from the services and education provided by Brits college then they capable to
achieve more number of marks and grades.
3.2 Scatter graph and Trend Line
Scatter Graph
12
⊘ This is a preview!⊘
Do you want full access?
Subscribe today to unlock all pages.

Trusted by 1+ million students worldwide
1 out of 28
Related Documents
Your All-in-One AI-Powered Toolkit for Academic Success.
 +13062052269
info@desklib.com
Available 24*7 on WhatsApp / Email
Unlock your academic potential
Copyright © 2020–2025 A2Z Services. All Rights Reserved. Developed and managed by ZUCOL.


