Object and Data Modelling Project: Storyboards and Drill Down Reports
VerifiedAdded on 2022/11/16
|17
|3013
|251
Project
AI Summary
This project delves into object and data modeling for an enrollment system, focusing on user experience through storyboards and drill-down reports. The assignment begins with an introduction to the importance of user experience in system design, emphasizing the use of storyboards to visualize user interactions. It details the dialogs involved in student registration, sign-in, major selection, course selection, and payment processing, providing a step-by-step breakdown of each process. The project further explains the creation of storyboards, outlining the key elements of persona, scene, and plot, and illustrating their application in the National University enrollment system. The document also includes a detailed explanation of a drill-down report, explaining its function in providing insights into multidimensional data. The project concludes by presenting storyboards and the functionality of the enrollment system.

Running head: OBJECT AND DATA MODELLING 1
Object and Data Modelling
Student Name
Institutional Affiliation
Object and Data Modelling
Student Name
Institutional Affiliation
Paraphrase This Document
Need a fresh take? Get an instant paraphrase of this document with our AI Paraphraser
OBJECT AND DATA MODELLING 2
Table of Contents
Introduction................................................................................................................................3
Dialogs.......................................................................................................................................3
Registration............................................................................................................................3
Sign in....................................................................................................................................4
Choose Major Course.............................................................................................................4
Select 3-4 courses under Information Systems and Semester................................................5
Confirm Details......................................................................................................................5
Choose Payment Option.........................................................................................................6
Debit card details....................................................................................................................6
Enrolment Confirmation........................................................................................................7
Creating Storyboards..................................................................................................................8
Enrollment System Storyboards...............................................................................................10
Drill Down Report....................................................................................................................13
Conclusion................................................................................................................................15
References................................................................................................................................16
OBJECT AND DATA MODELLING 3
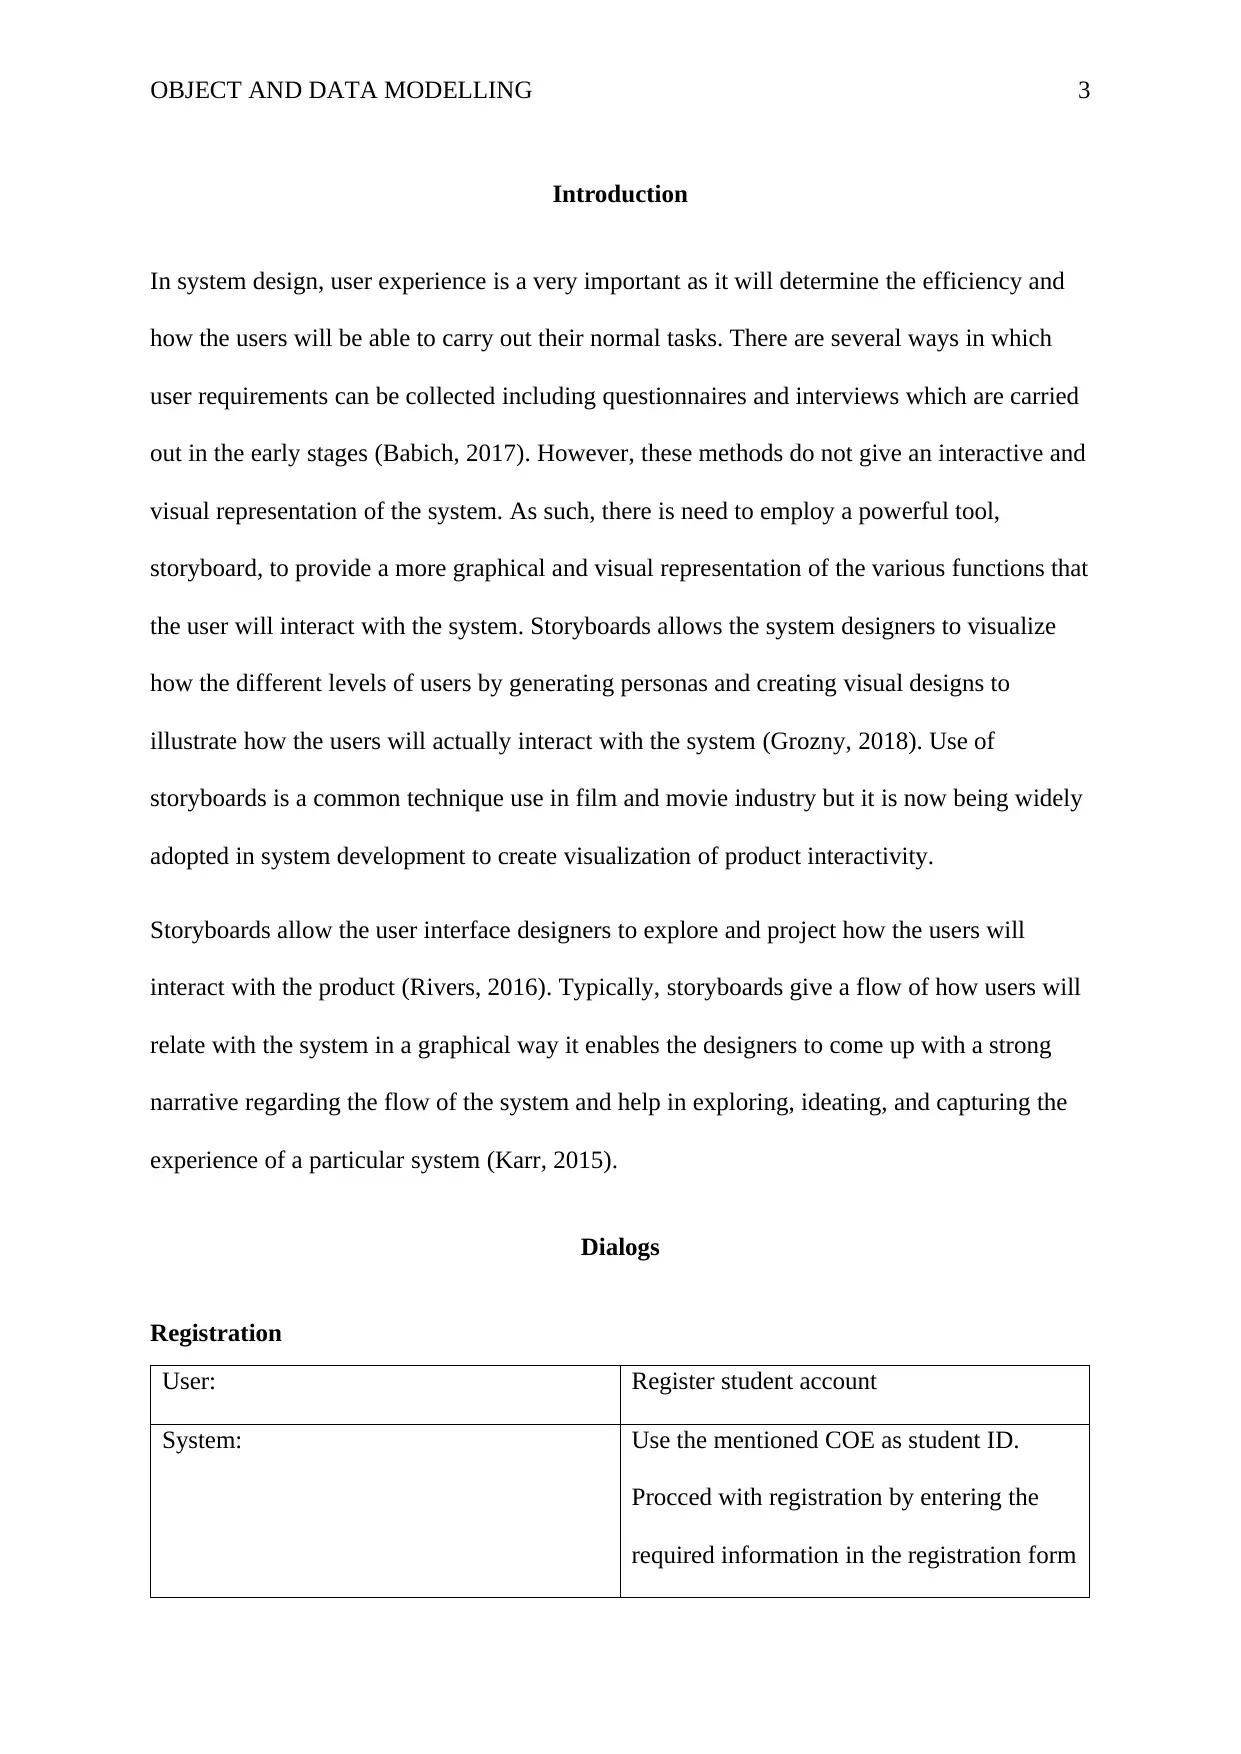
Introduction
In system design, user experience is a very important as it will determine the efficiency and
how the users will be able to carry out their normal tasks. There are several ways in which
user requirements can be collected including questionnaires and interviews which are carried
out in the early stages (Babich, 2017). However, these methods do not give an interactive and
visual representation of the system. As such, there is need to employ a powerful tool,
storyboard, to provide a more graphical and visual representation of the various functions that
the user will interact with the system. Storyboards allows the system designers to visualize
how the different levels of users by generating personas and creating visual designs to
illustrate how the users will actually interact with the system (Grozny, 2018). Use of
storyboards is a common technique use in film and movie industry but it is now being widely
adopted in system development to create visualization of product interactivity.
Storyboards allow the user interface designers to explore and project how the users will
interact with the product (Rivers, 2016). Typically, storyboards give a flow of how users will
relate with the system in a graphical way it enables the designers to come up with a strong
narrative regarding the flow of the system and help in exploring, ideating, and capturing the
experience of a particular system (Karr, 2015).
Dialogs
Registration
User: Register student account
System: Use the mentioned COE as student ID.
Procced with registration by entering the
required information in the registration form
⊘ This is a preview!⊘
Do you want full access?
Subscribe today to unlock all pages.
Trusted by 1+ million students worldwide
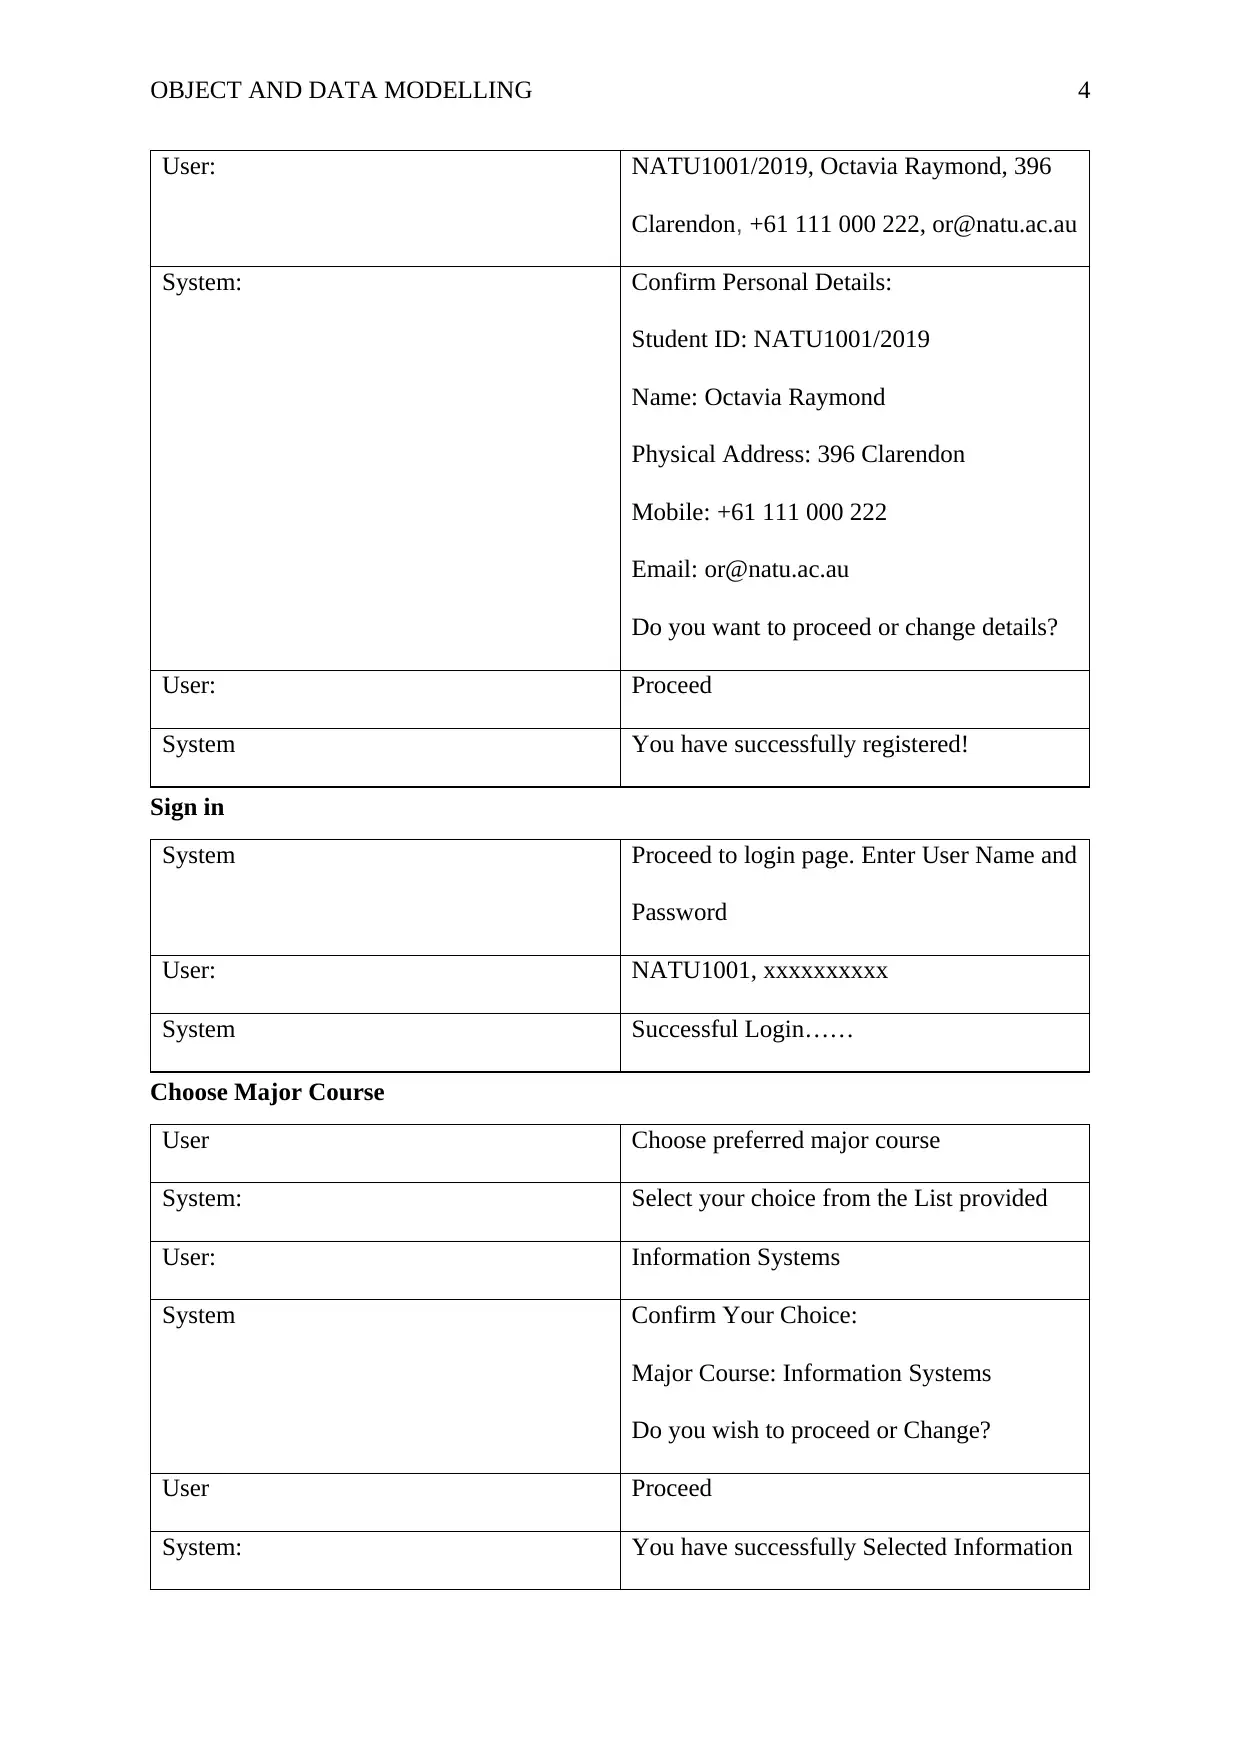
OBJECT AND DATA MODELLING 4
User: NATU1001/2019, Octavia Raymond, 396
Clarendon, +61 111 000 222, or@natu.ac.au
System: Confirm Personal Details:
Student ID: NATU1001/2019
Name: Octavia Raymond
Physical Address: 396 Clarendon
Mobile: +61 111 000 222
Email: or@natu.ac.au
Do you want to proceed or change details?
User: Proceed
System You have successfully registered!
Sign in
System Proceed to login page. Enter User Name and
Password
User: NATU1001, xxxxxxxxxx
System Successful Login……
Choose Major Course
User Choose preferred major course
System: Select your choice from the List provided
User: Information Systems
System Confirm Your Choice:
Major Course: Information Systems
Do you wish to proceed or Change?
User Proceed
System: You have successfully Selected Information
Paraphrase This Document
Need a fresh take? Get an instant paraphrase of this document with our AI Paraphraser
OBJECT AND DATA MODELLING 5
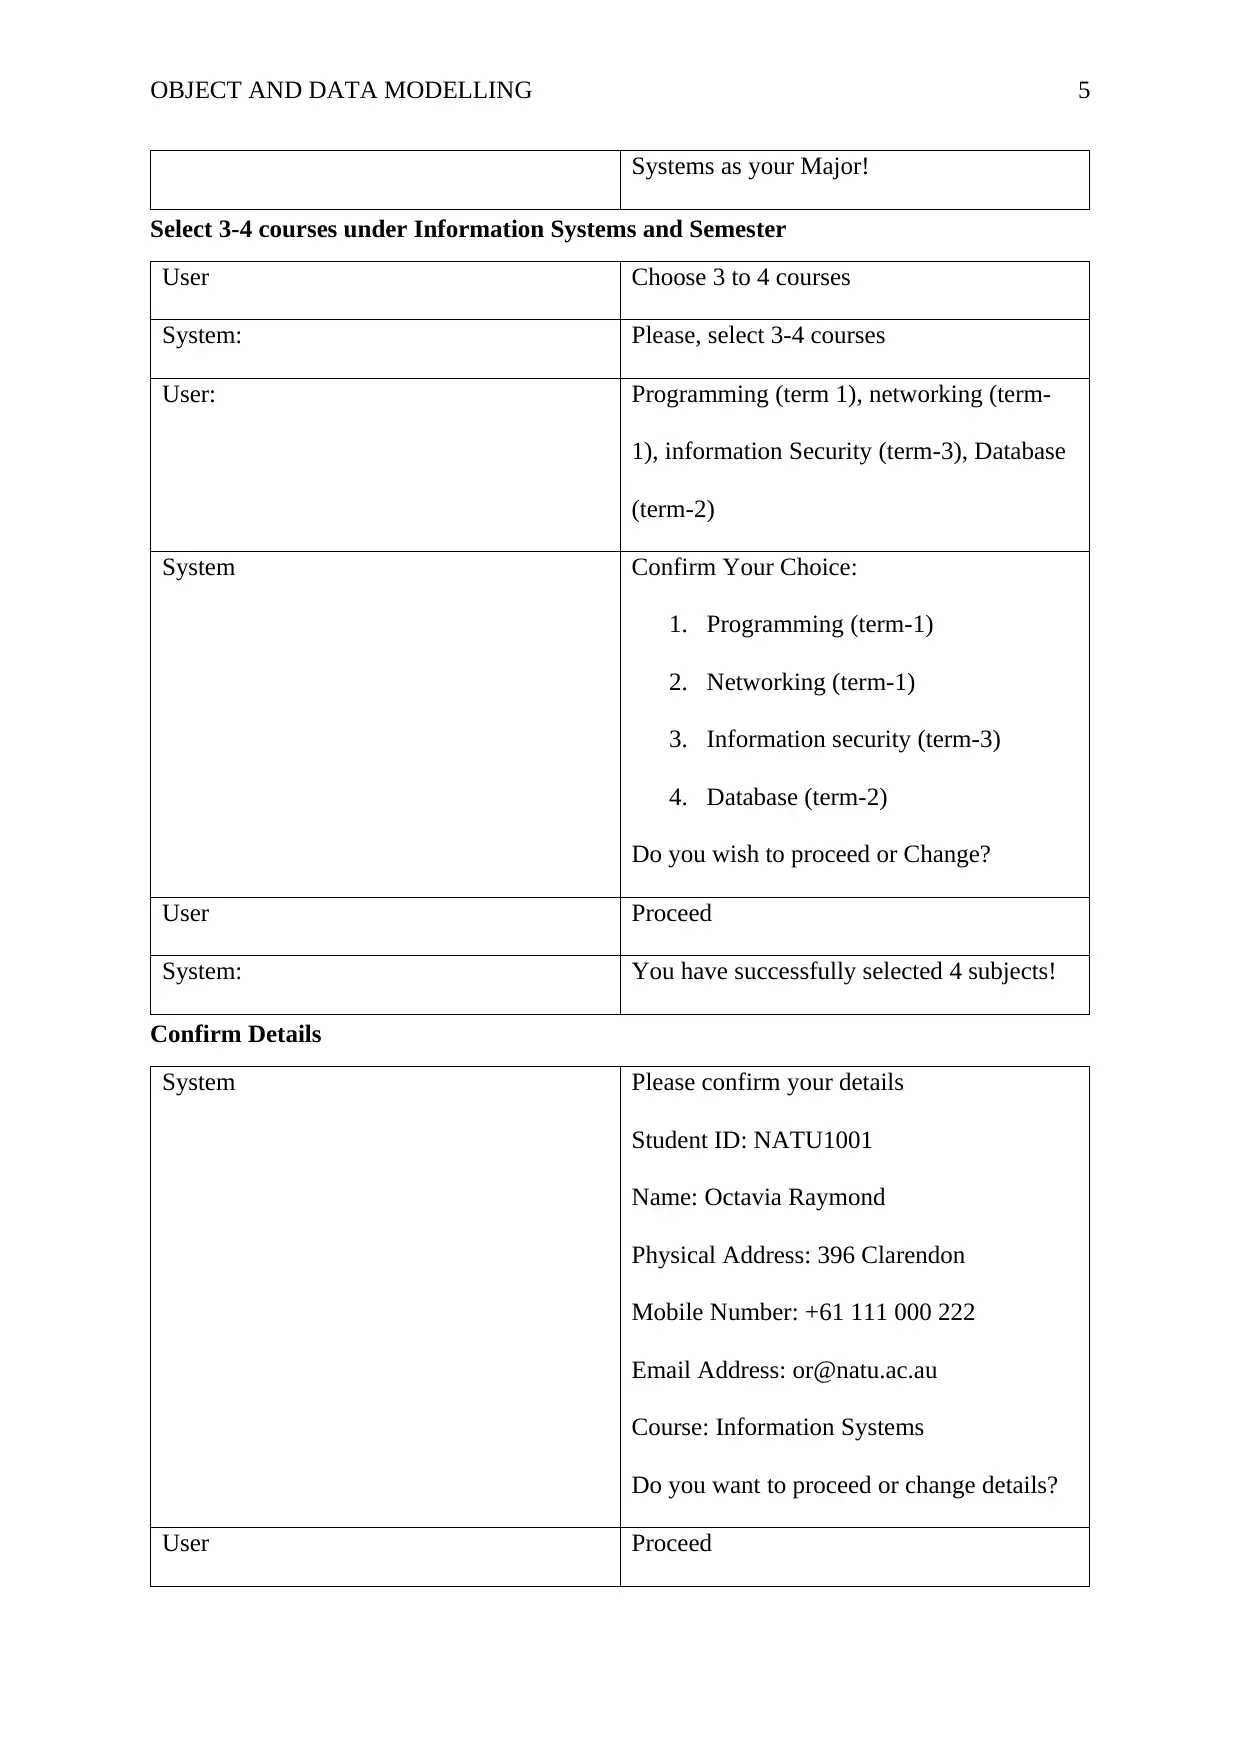
Systems as your Major!
Select 3-4 courses under Information Systems and Semester
User Choose 3 to 4 courses
System: Please, select 3-4 courses
User: Programming (term 1), networking (term-
1), information Security (term-3), Database
(term-2)
System Confirm Your Choice:
1. Programming (term-1)
2. Networking (term-1)
3. Information security (term-3)
4. Database (term-2)
Do you wish to proceed or Change?
User Proceed
System: You have successfully selected 4 subjects!
Confirm Details
System Please confirm your details
Student ID: NATU1001
Name: Octavia Raymond
Physical Address: 396 Clarendon
Mobile Number: +61 111 000 222
Email Address: or@natu.ac.au
Course: Information Systems
Do you want to proceed or change details?
User Proceed
OBJECT AND DATA MODELLING 6
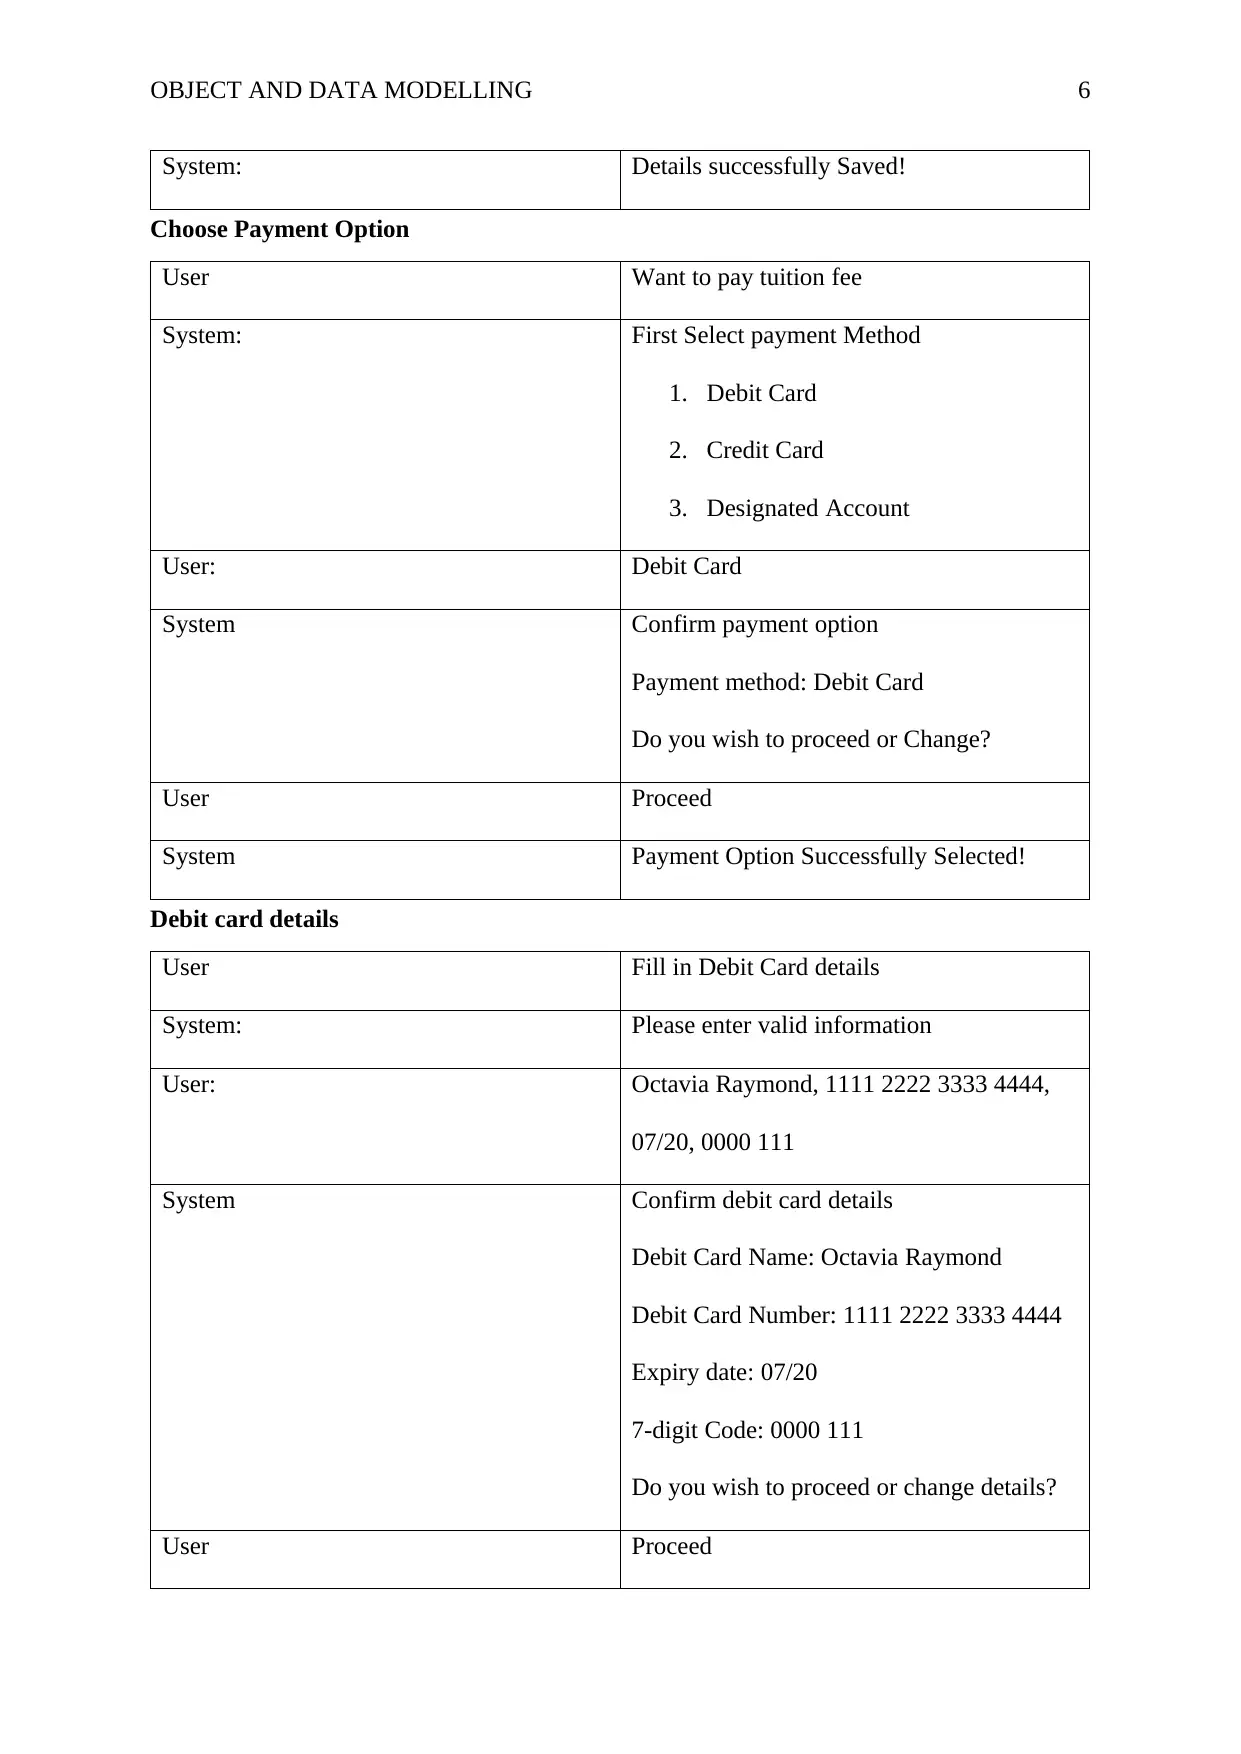
System: Details successfully Saved!
Choose Payment Option
User Want to pay tuition fee
System: First Select payment Method
1. Debit Card
2. Credit Card
3. Designated Account
User: Debit Card
System Confirm payment option
Payment method: Debit Card
Do you wish to proceed or Change?
User Proceed
System Payment Option Successfully Selected!
Debit card details
User Fill in Debit Card details
System: Please enter valid information
User: Octavia Raymond, 1111 2222 3333 4444,
07/20, 0000 111
System Confirm debit card details
Debit Card Name: Octavia Raymond
Debit Card Number: 1111 2222 3333 4444
Expiry date: 07/20
7-digit Code: 0000 111
Do you wish to proceed or change details?
User Proceed
⊘ This is a preview!⊘
Do you want full access?
Subscribe today to unlock all pages.
Trusted by 1+ million students worldwide
OBJECT AND DATA MODELLING 7
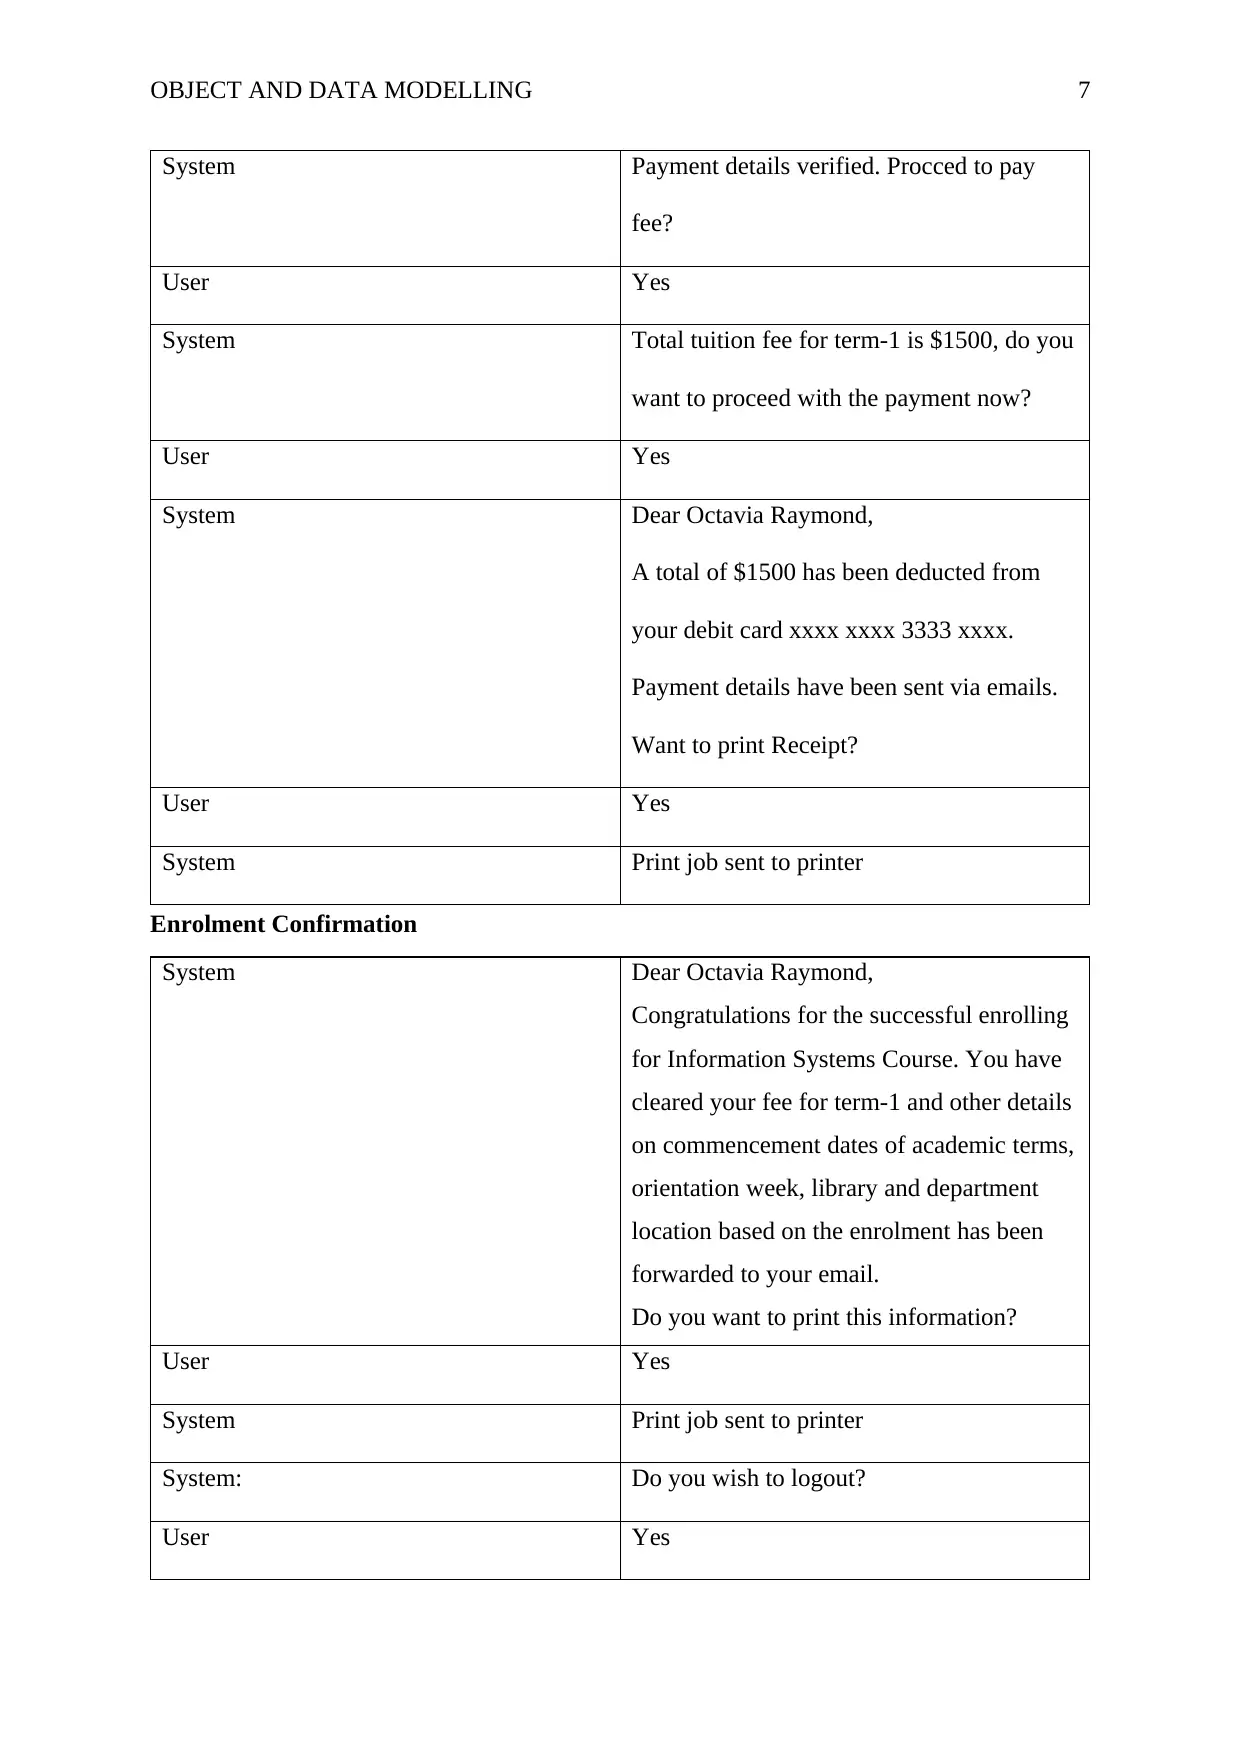
System Payment details verified. Procced to pay
fee?
User Yes
System Total tuition fee for term-1 is $1500, do you
want to proceed with the payment now?
User Yes
System Dear Octavia Raymond,
A total of $1500 has been deducted from
your debit card xxxx xxxx 3333 xxxx.
Payment details have been sent via emails.
Want to print Receipt?
User Yes
System Print job sent to printer
Enrolment Confirmation
System Dear Octavia Raymond,
Congratulations for the successful enrolling
for Information Systems Course. You have
cleared your fee for term-1 and other details
on commencement dates of academic terms,
orientation week, library and department
location based on the enrolment has been
forwarded to your email.
Do you want to print this information?
User Yes
System Print job sent to printer
System: Do you wish to logout?
User Yes
Paraphrase This Document
Need a fresh take? Get an instant paraphrase of this document with our AI Paraphraser
OBJECT AND DATA MODELLING 8
System Logging off….
Creating Storyboards
It is easy to create a storyboard when we view what need to be done form the designer’s
perspective. The most essential fact is that the designers should possess the basic skills in
order to nicely and properly design the storyboards (Ambrose, 2013). Additionally, when
creating storyboards, it is important to maintain logical and convincing arguments. When
designing the various troy boards for the National University enrollment system, there are
three basic elements that need to be captured including: the persona (character), the scene,
and the plot (Scott, 2017).
The persona/character represents the different users of the system including their
expectations, motives, appearance, and behaviors and the decisions that they will make while
using the system. In this case, the persona is the student. If the designers can tell what the
what and how the student will be doing with the system, it would be and added advantage
when designing the storyboard. The scene is basically the platform where the story or the
event takes place and the plot involve the various activities that the user will be performing
on the system.
More often than not, user interface designer tends to ignore the need to directly explain the
various designs in details. The storyboard should have a flow of activities and that is logical
and understandable. It should have a beginning, the middle, and the end activities. It should
have the trigger events that allow the user to make the various decisions while interacting
with the system. In essence, a storyboard uses images and words to communicate a story in a
chronological and hierarchical manner mapping the main events of the story.
OBJECT AND DATA MODELLING 9
In user experience (UX), storyboards and widely used in usability testing to determine how
the different stakeholders will react to the system design and the overall flow of events.
Storyboards gives the stakeholders an imaginary visual illustration of how they will interact
with the system and from this, they will decide if they are satisfied or not. Moreover, they are
used to augment journey maps by including graphical elements of the context of the user in
the different interaction stages. However, it is important to mention that storyboards do not
describe how the system will be developed rather, how the users will interact with the system
after it is completed. While creating the various storyboards for the enrollment system,
several steps were taken in order to achieve the most ideal and attractive storyboards. Six
high level steps were followed to achieve effective storyboards including: data gathering,
choosing fidelity level, defining the basics, planning out the steps, adding captions and
creating visuals, and iterating and distribution. These steps played a significant role in having
great storyboards that describes how the user interacts with the system.
⊘ This is a preview!⊘
Do you want full access?
Subscribe today to unlock all pages.
Trusted by 1+ million students worldwide
OBJECT AND DATA MODELLING 10
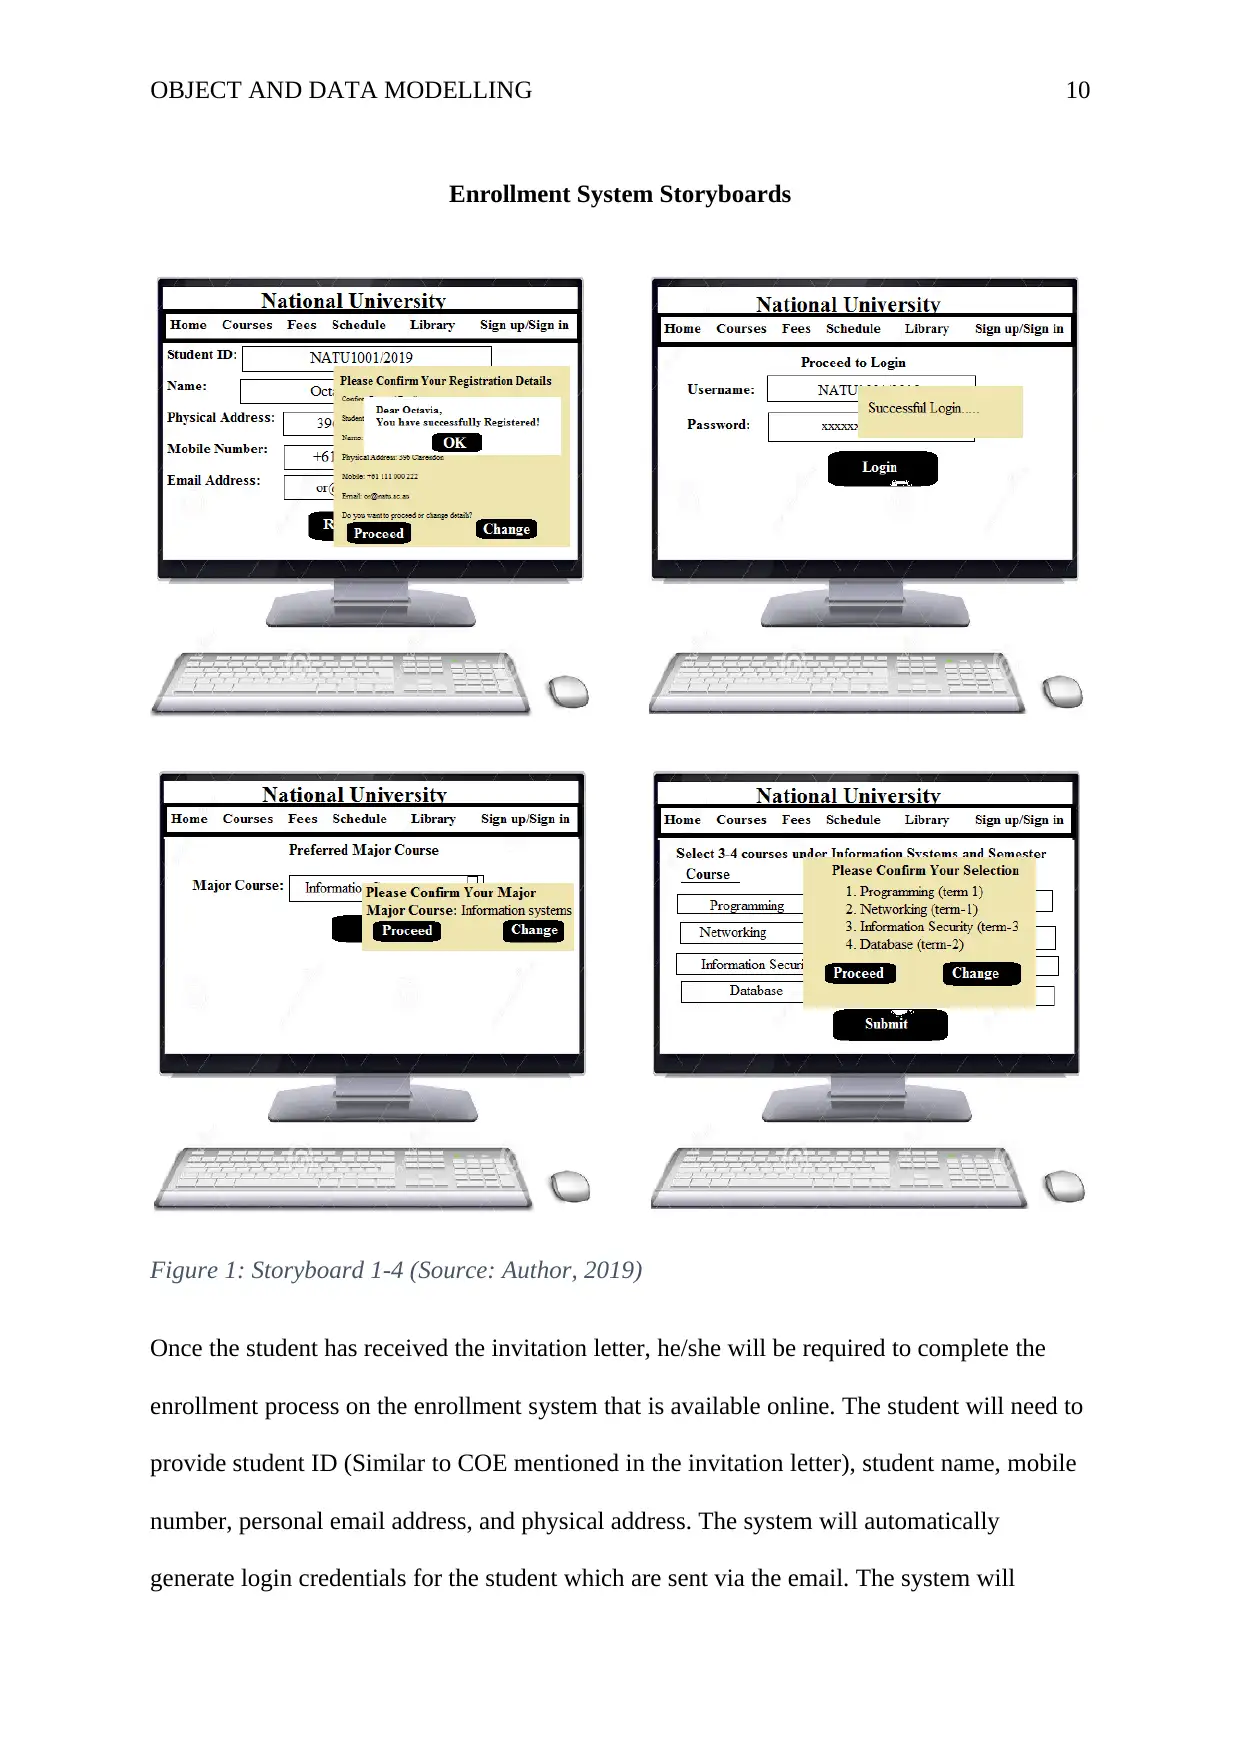
Enrollment System Storyboards
Figure 1: Storyboard 1-4 (Source: Author, 2019)
Once the student has received the invitation letter, he/she will be required to complete the
enrollment process on the enrollment system that is available online. The student will need to
provide student ID (Similar to COE mentioned in the invitation letter), student name, mobile
number, personal email address, and physical address. The system will automatically
generate login credentials for the student which are sent via the email. The system will
Paraphrase This Document
Need a fresh take? Get an instant paraphrase of this document with our AI Paraphraser
OBJECT AND DATA MODELLING 11
authenticate the registration process by checking whether the provided COE matches the
student ID entered into the system. This security check will be implemented in the enrollment
system to prevent unnecessary registration from non-students who want to overload the
database servers.
The student will use credentials sent via email to login to the enrollment system. The student
will use Student ID as username.
The system will prompt the student to choose the major course from the six available courses
and the term they want to get enrolled. The system will verify the student selection before
proceeding. Afterwards, the system will show a list of available courses and allow the student
to select 3 to 4 courses and the corresponding class times.
After selecting the major, the student will be required to choose three to four courses under
the major that he/she will undertake during the course. The student is also required to provide
the term he/she wishes to undertake the course. However, it is important to note that a class
can only take a maximum of 40 students and once it is full the system will automatically
recommend the available classes for the student.
OBJECT AND DATA MODELLING 12
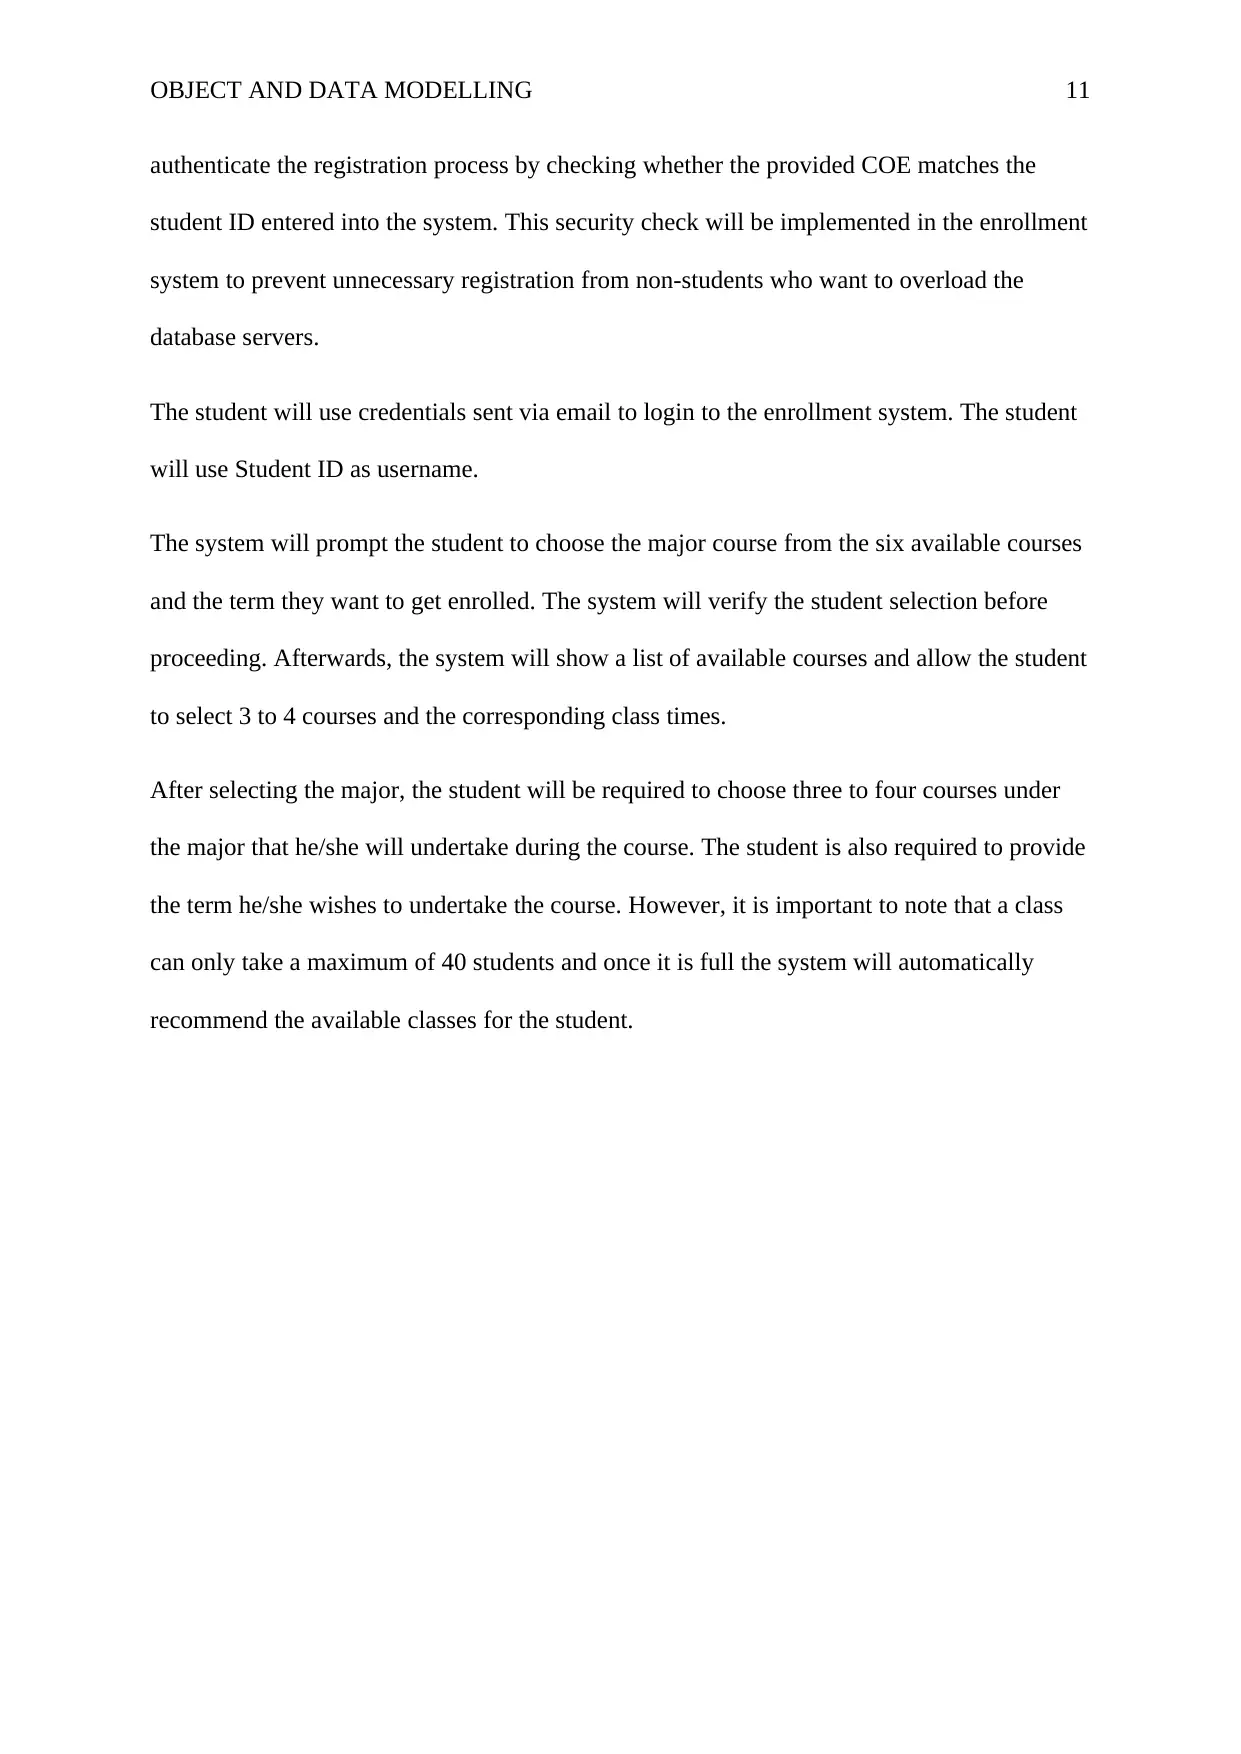
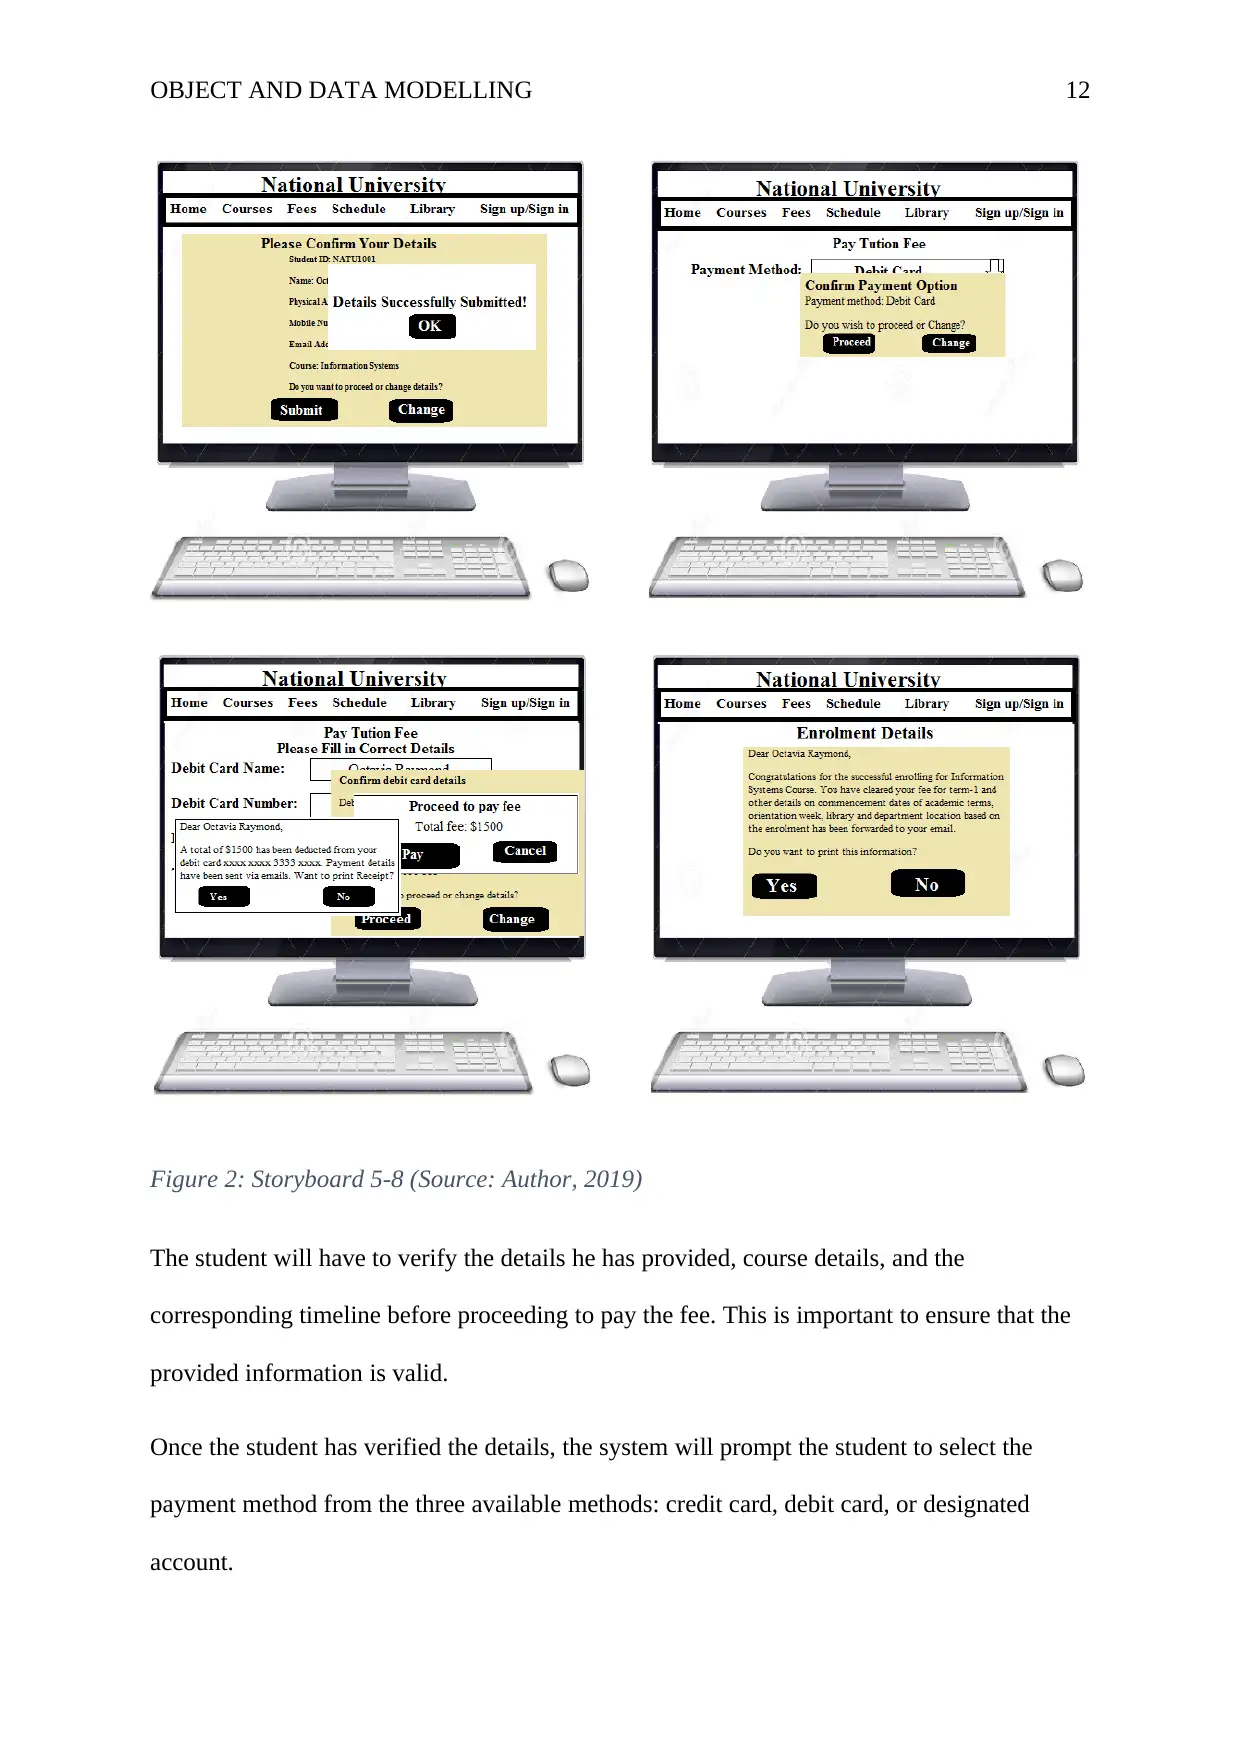
Figure 2: Storyboard 5-8 (Source: Author, 2019)
The student will have to verify the details he has provided, course details, and the
corresponding timeline before proceeding to pay the fee. This is important to ensure that the
provided information is valid.
Once the student has verified the details, the system will prompt the student to select the
payment method from the three available methods: credit card, debit card, or designated
account.
⊘ This is a preview!⊘
Do you want full access?
Subscribe today to unlock all pages.
Trusted by 1+ million students worldwide
1 out of 17


Your All-in-One AI-Powered Toolkit for Academic Success.
+13062052269
info@desklib.com
Available 24*7 on WhatsApp / Email
![[object Object]](/_next/static/media/star-bottom.7253800d.svg)
Unlock your academic potential
Copyright © 2020–2026 A2Z Services. All Rights Reserved. Developed and managed by ZUCOL.