Edith Cowan University: Bunbury Boat Show Customer Survey Report
VerifiedAdded on 2023/06/03
|37
|8446
|265
Report
AI Summary
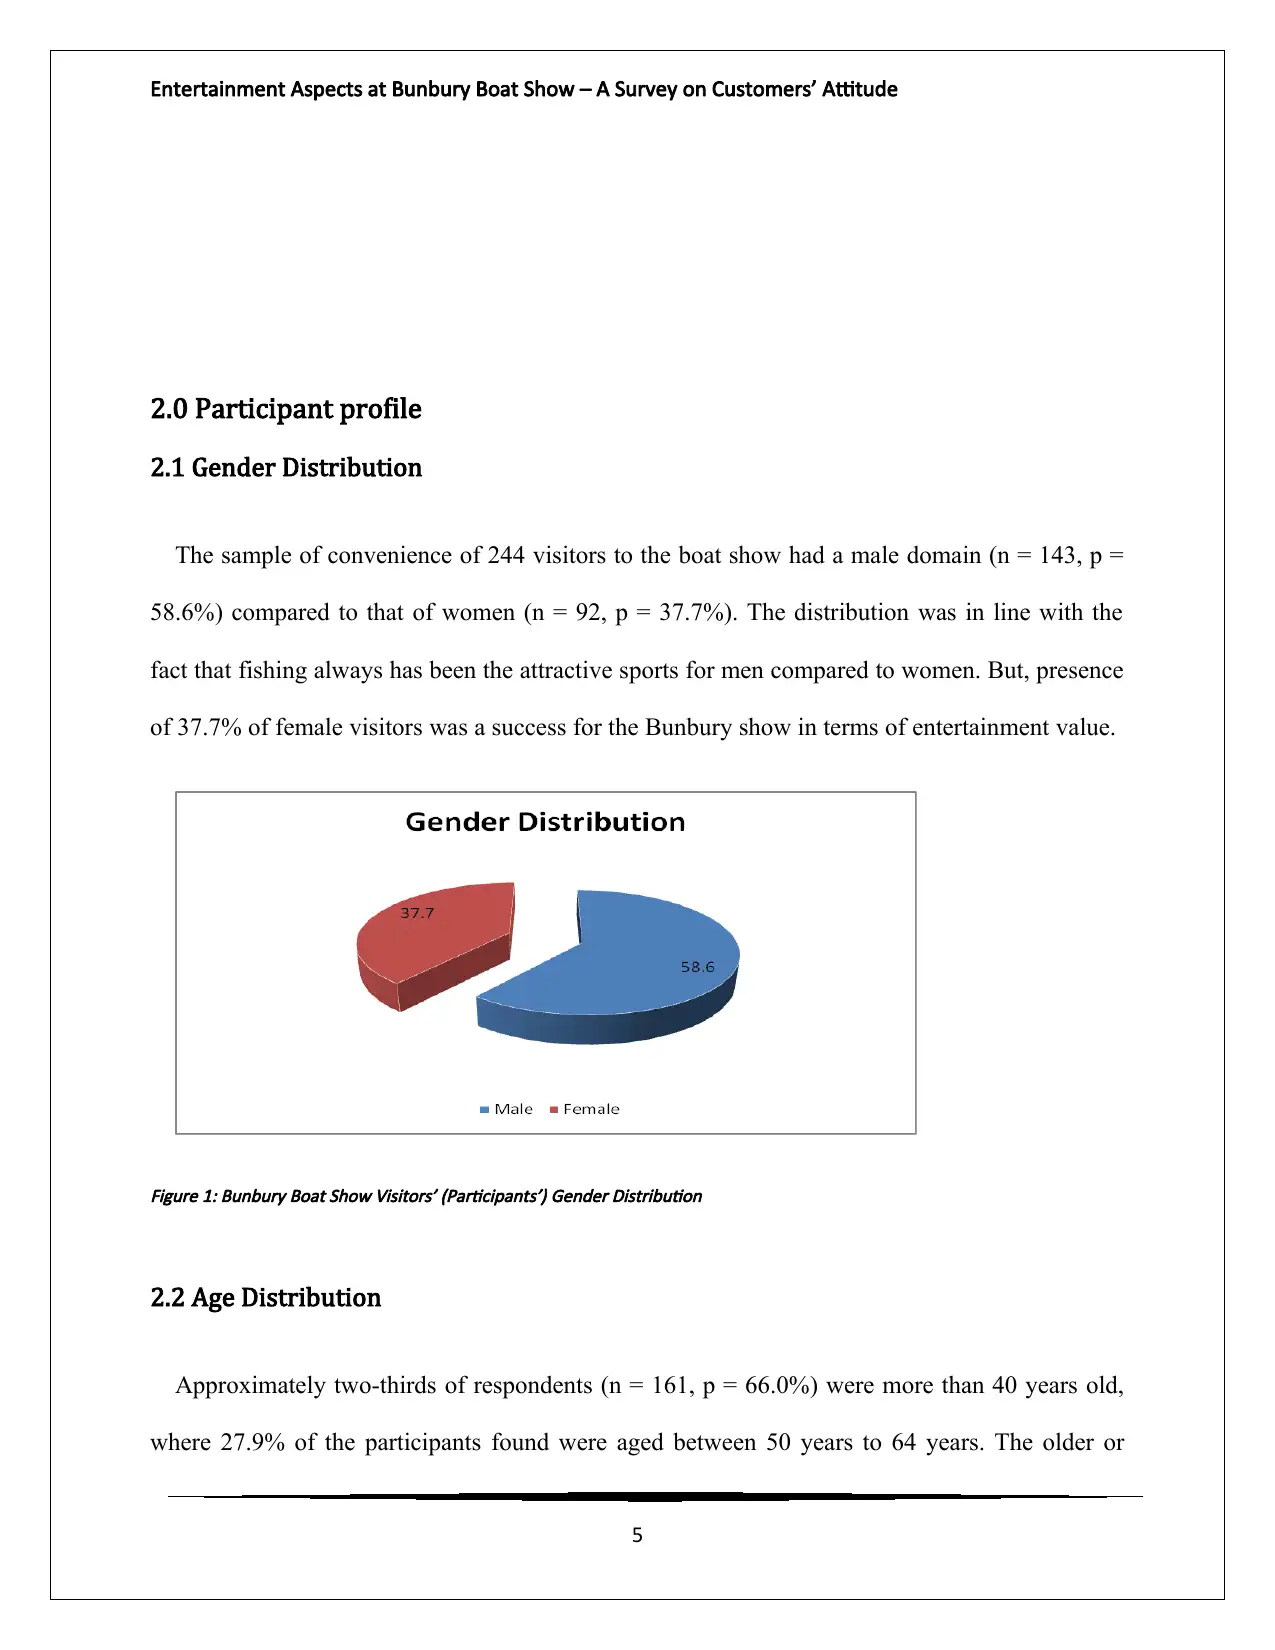
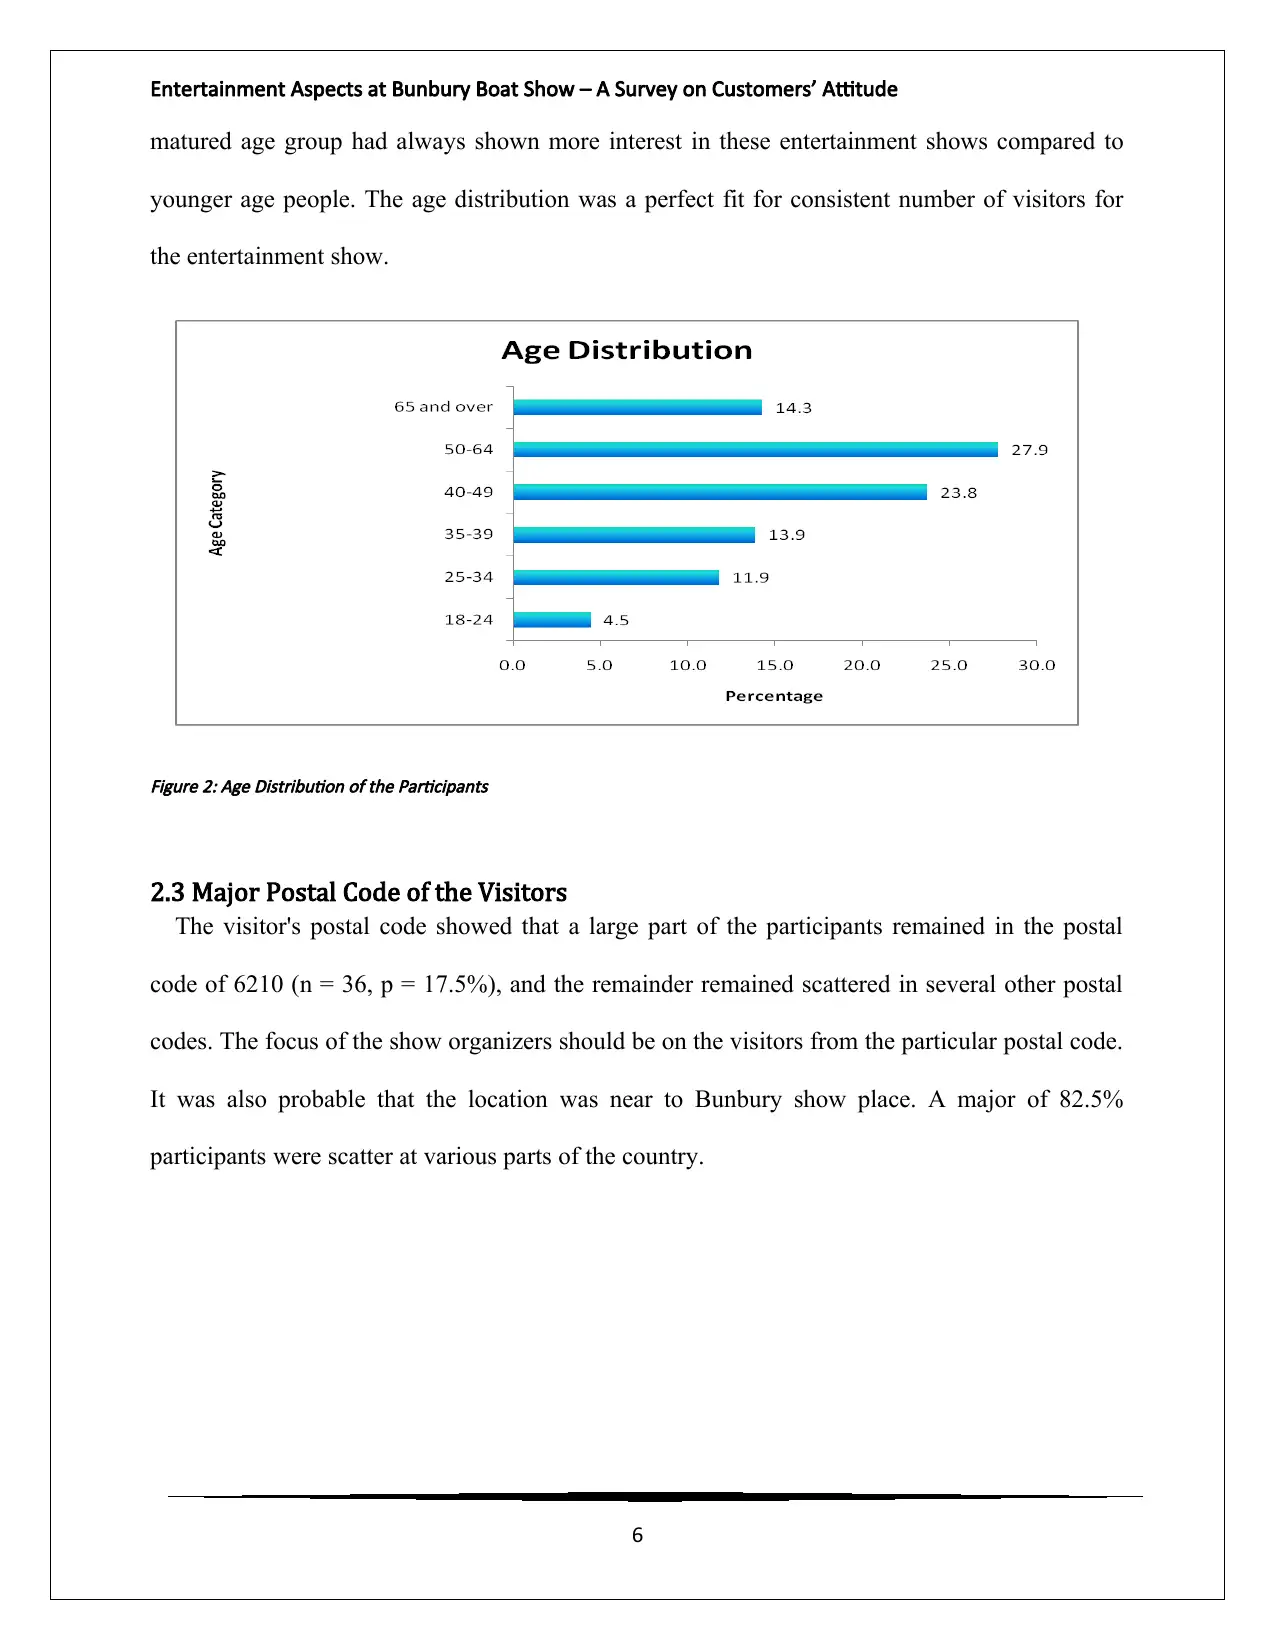
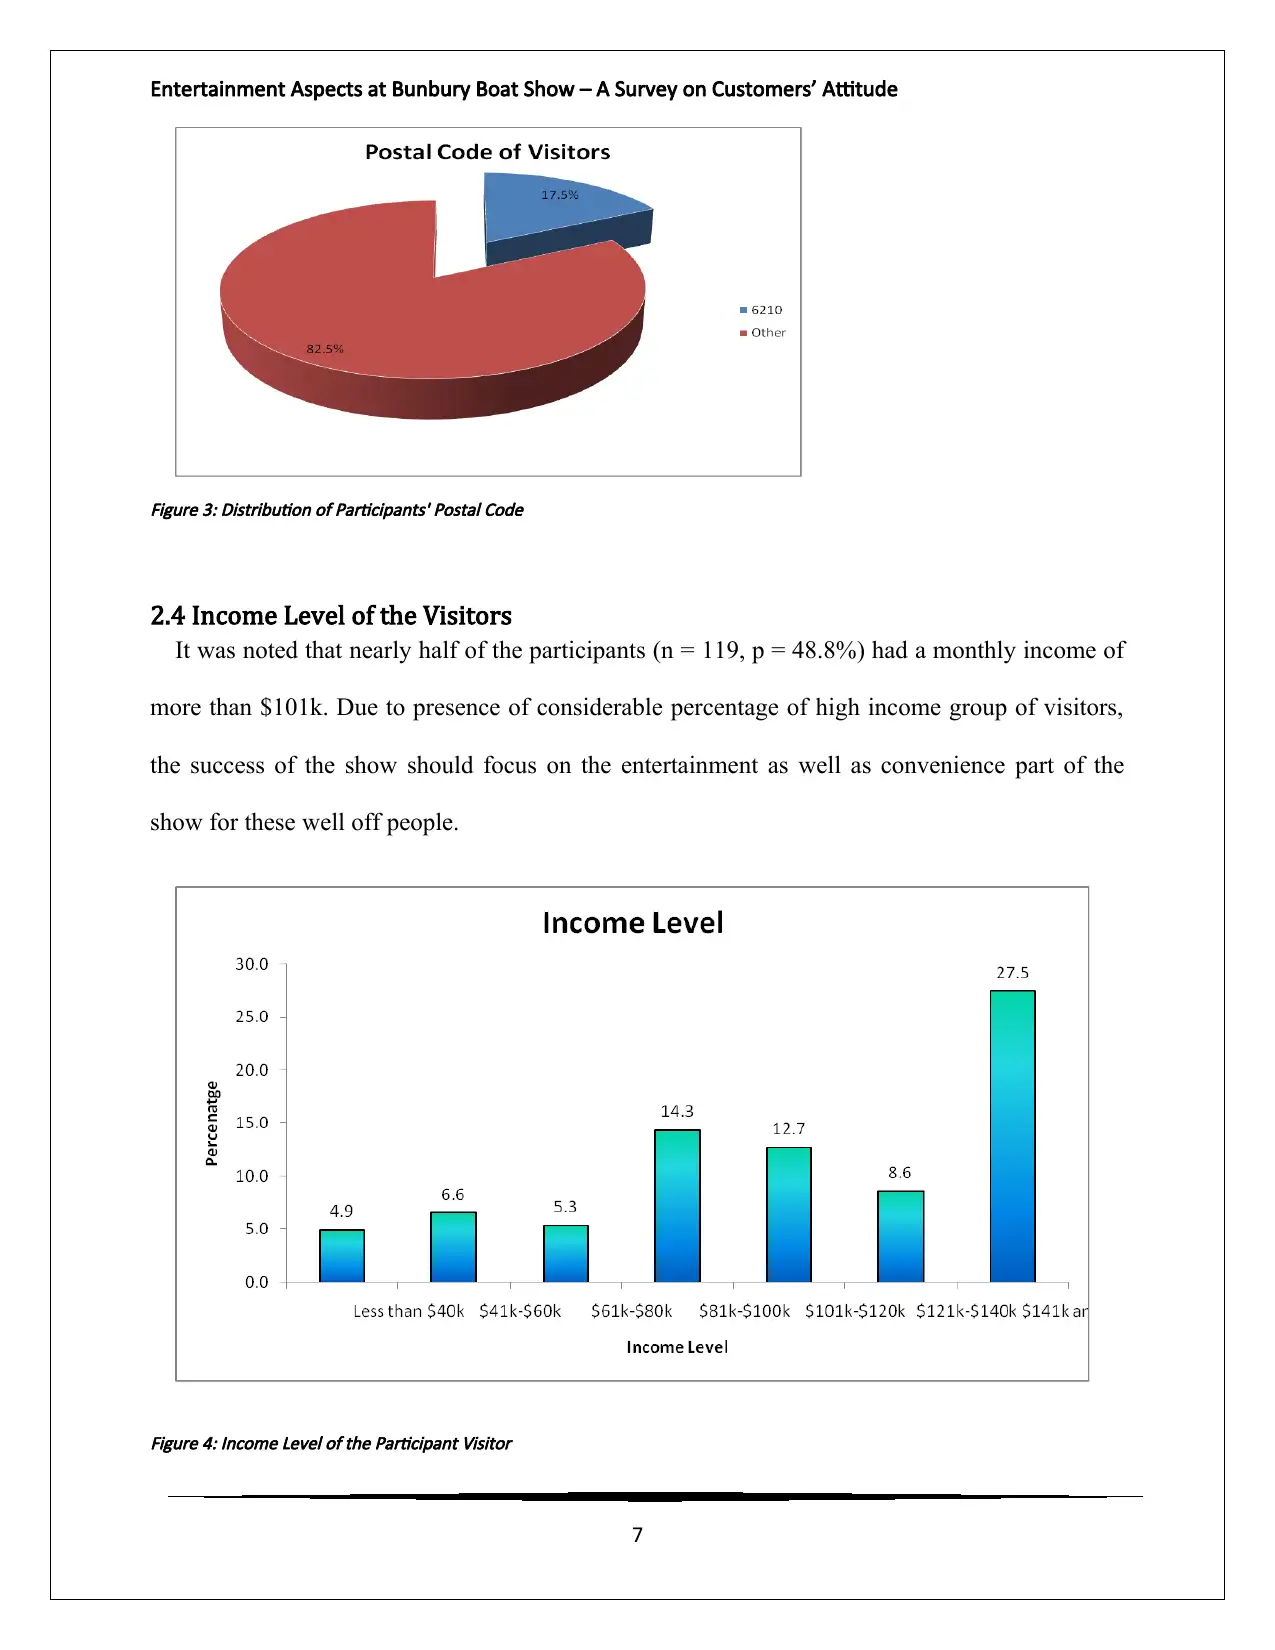
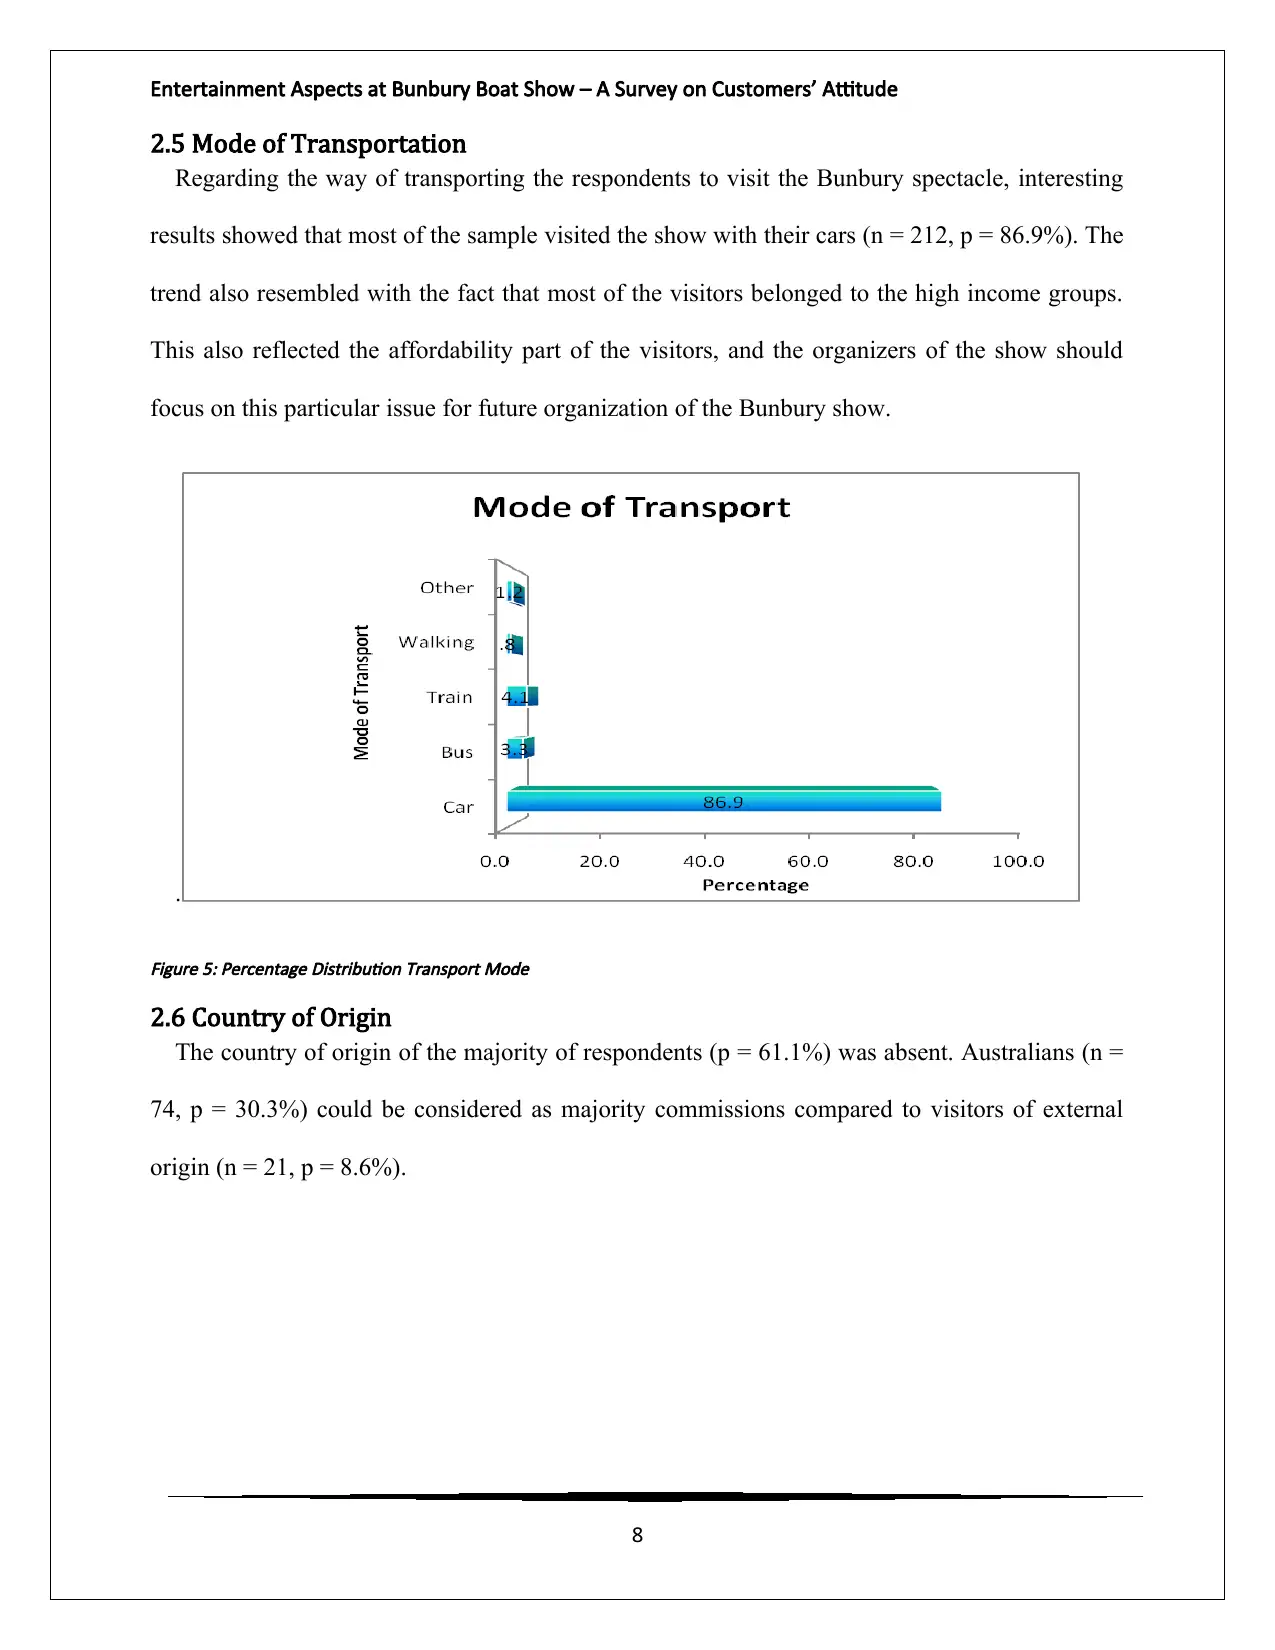
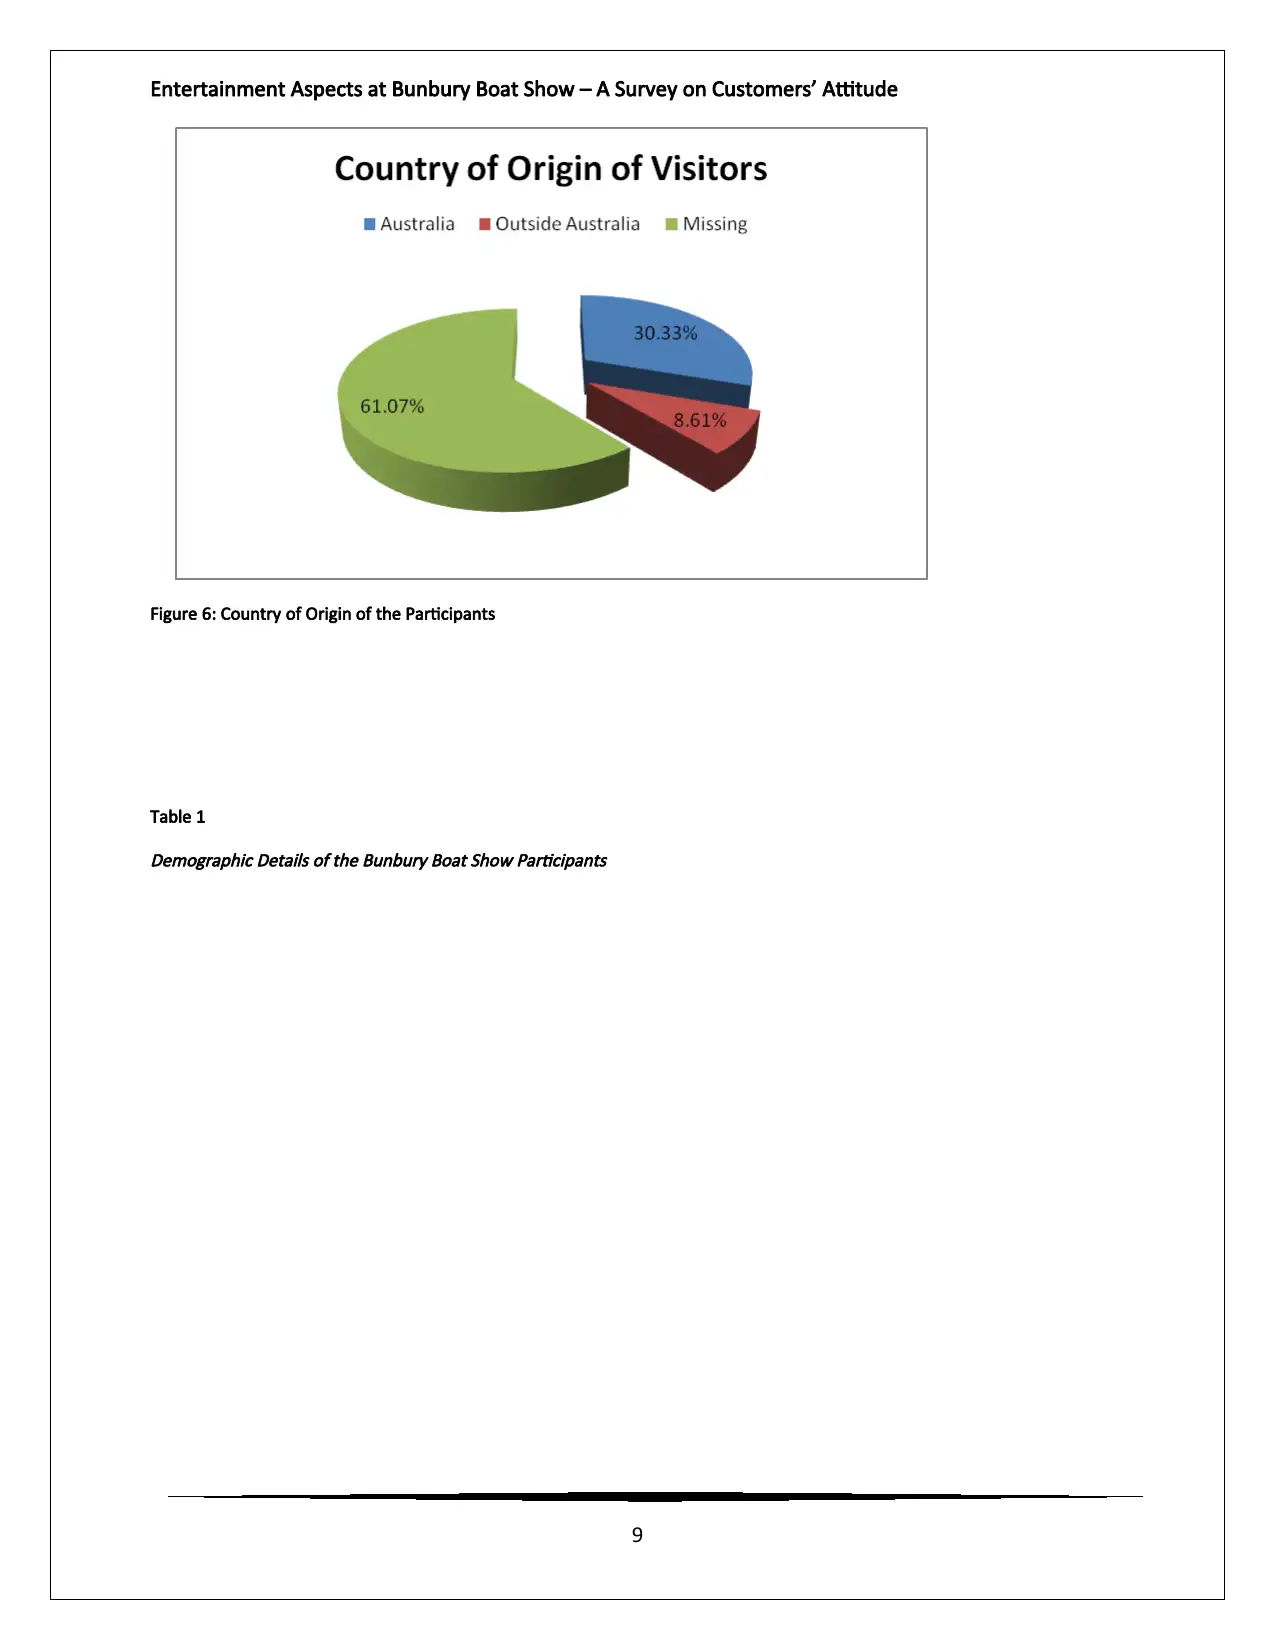
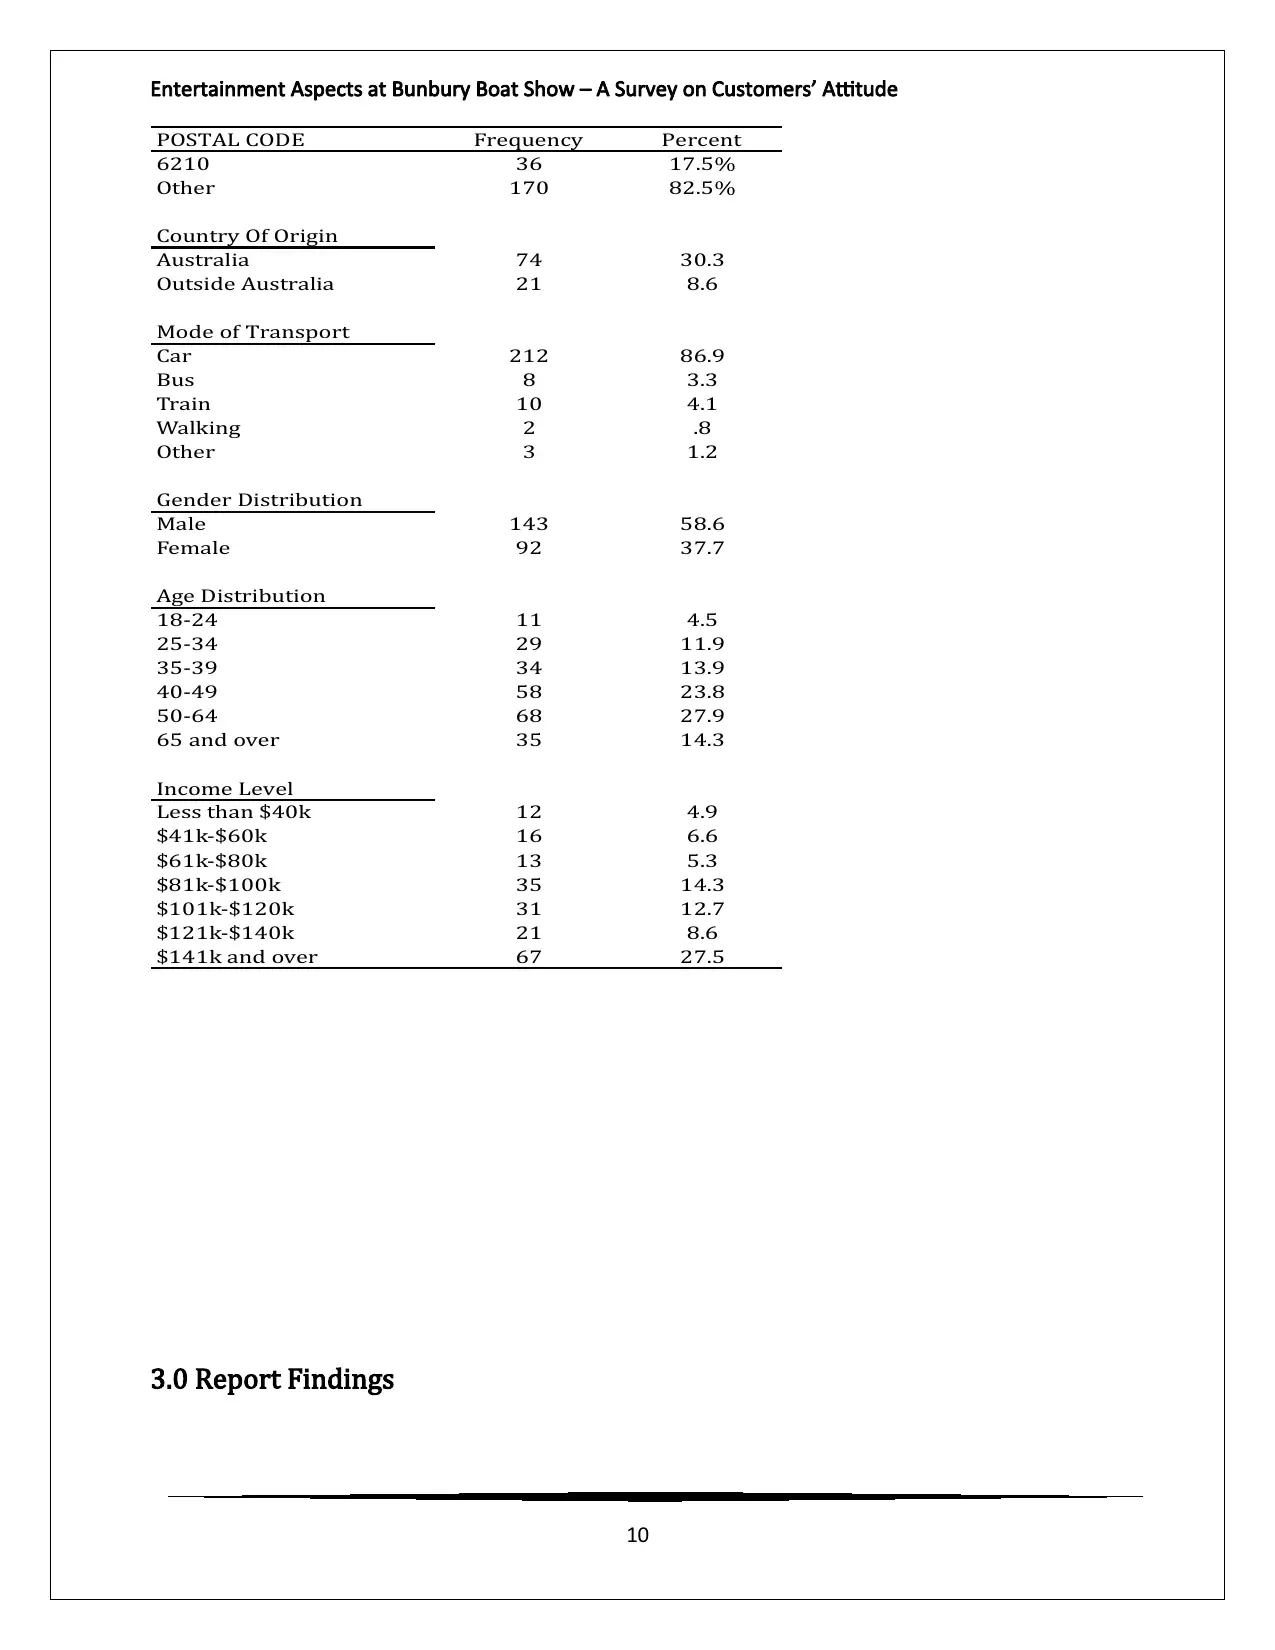
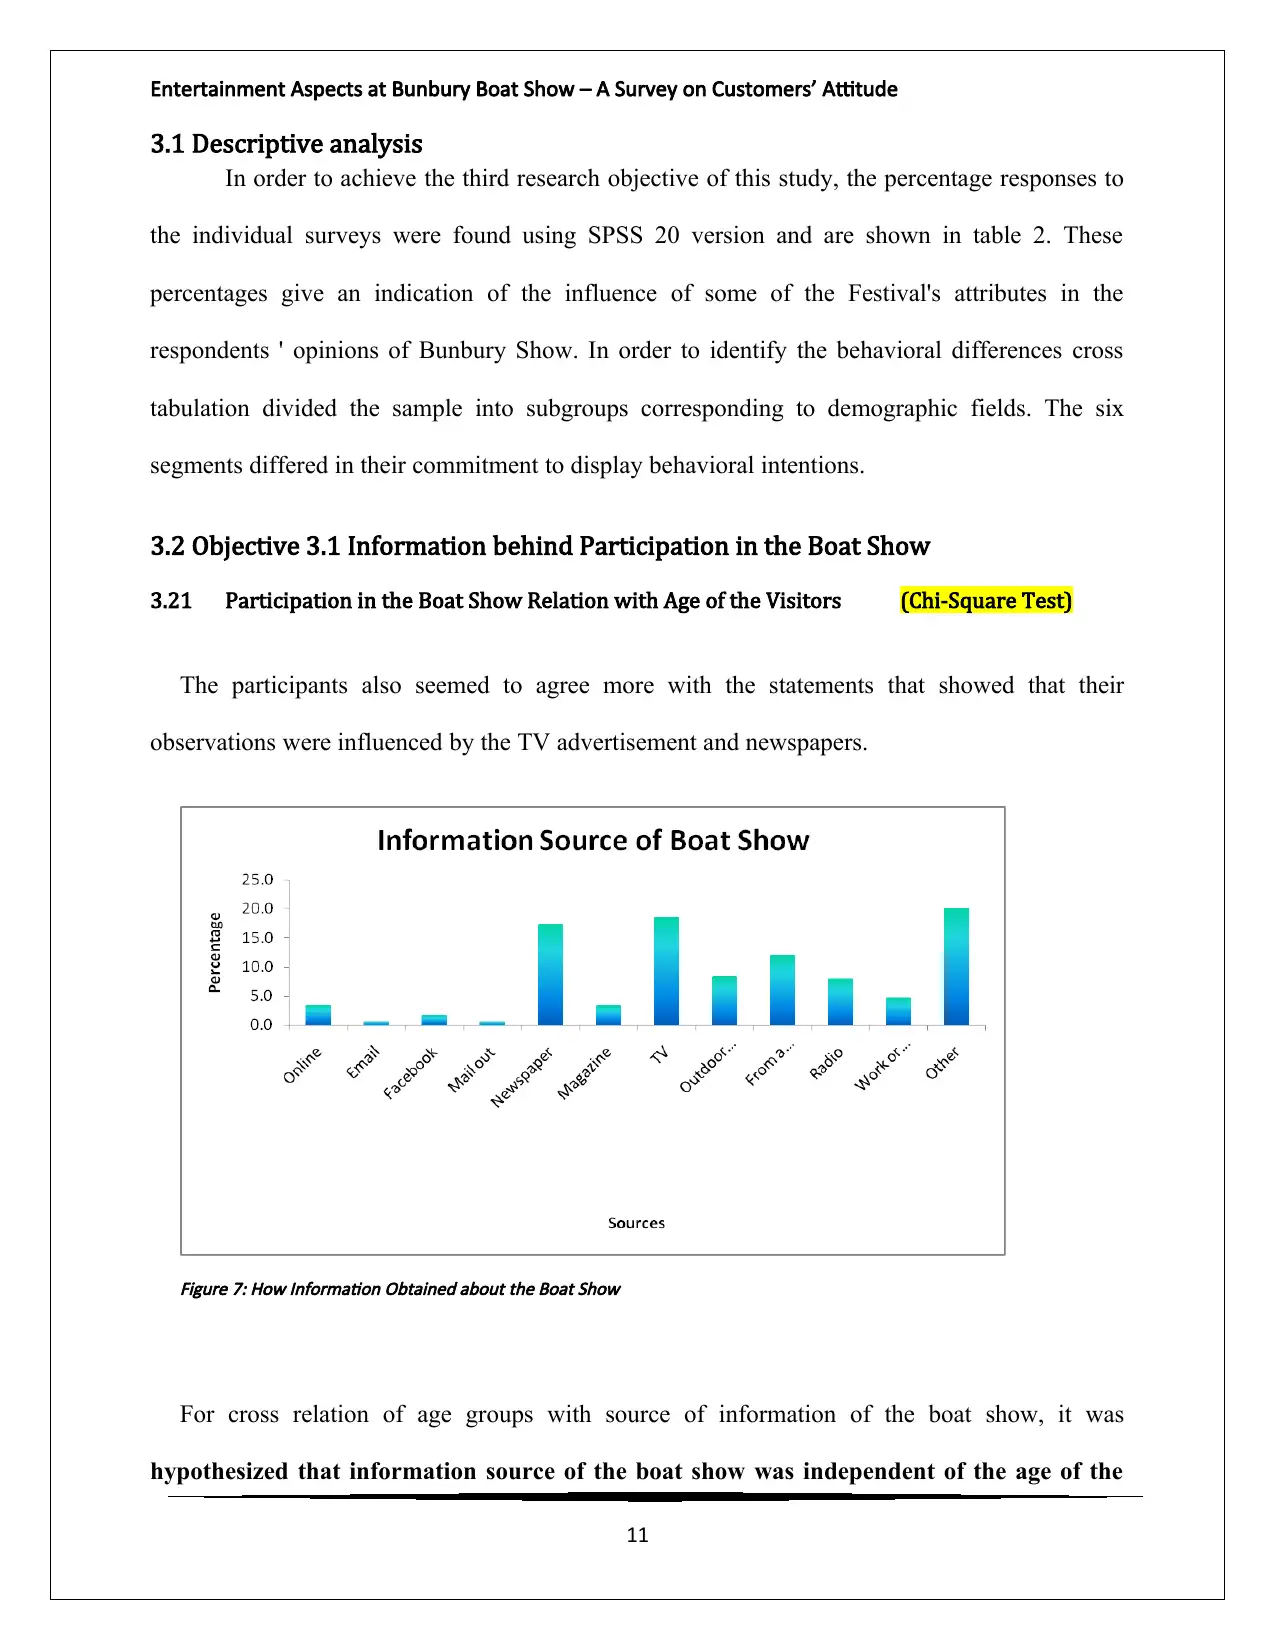
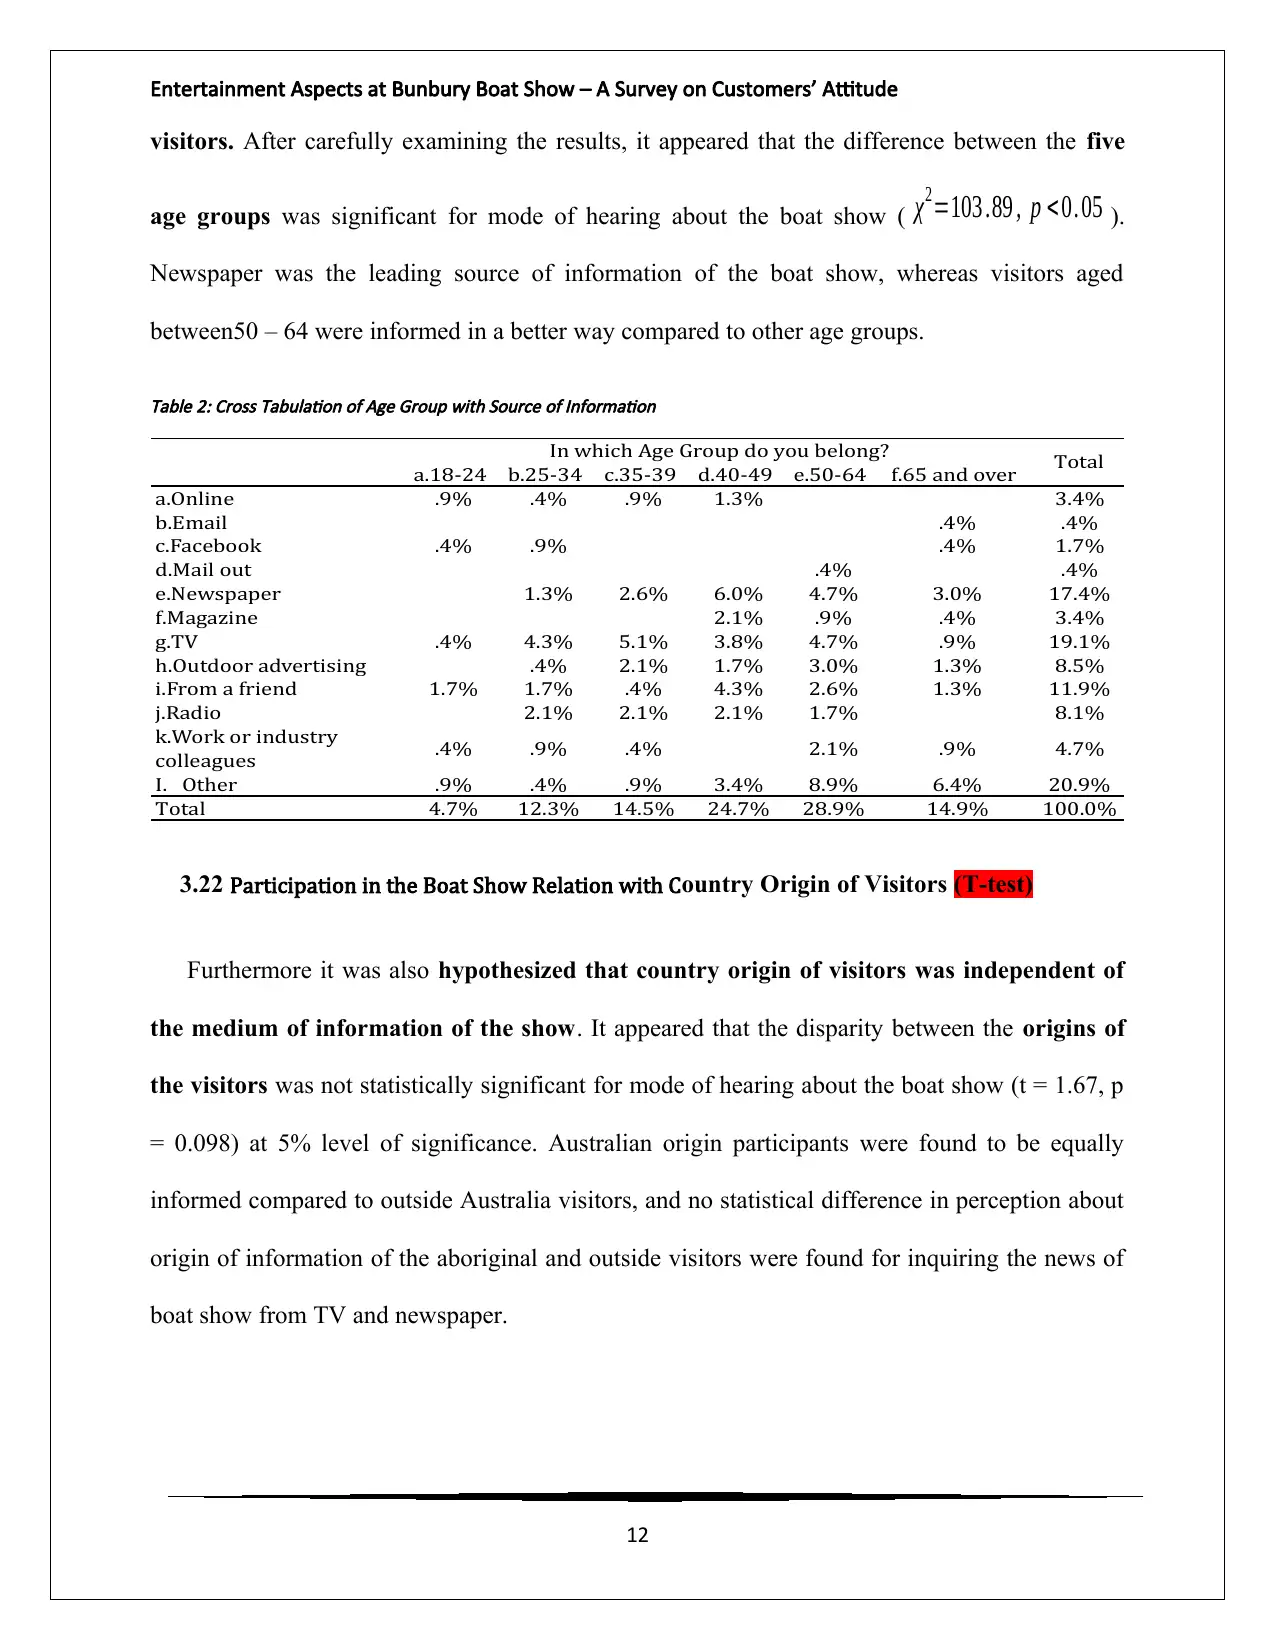
This report presents the findings of a customer survey conducted at the Bunbury Boat Show, aiming to investigate consumer behavior, attitudes, and online activity of visitors. The survey, which collected 244 valid responses, explored various aspects including participant demographics (gender, age, postal code, income, transportation mode, and country of origin), their motivations for attending the show, their attitudes toward water-based activities, perceptions of the show's facilities, value for money, and the influence of exhibitors' websites. The analysis employed descriptive statistics, Chi-Square tests, T-tests, and ANOVA to identify significant relationships between variables. Key findings revealed a male-dominated visitor profile, with a significant portion of visitors aged over 40 and a high income level. The report highlights the importance of newspapers as a primary source of information and examines the influence of family relaxation and outings on visitor perceptions. Furthermore, the report explores the relationship between gender and attitudes toward the benefits of water-based activities. The study provides valuable insights for the management of the Bunbury Boat Show to frame its policies and enhance the event's appeal and effectiveness.

Running Head: Entertainment Aspects at Bunbury Boat Show – A Survey on Customers’ Attitude
Entertainment Aspects at Bunbury Boat Show – A
Survey on Customers’ Attitude
Entertainment Aspects at Bunbury Boat Show – A
Survey on Customers’ Attitude
Paraphrase This Document
Need a fresh take? Get an instant paraphrase of this document with our AI Paraphraser

Entertainment Aspects at Bunbury Boat Show – A Survey on Customers’ Attitude
Table of Contents
Entertainment Aspects at Bunbury Boat Show – A Survey on Customers’ Attitude....1
1.0 Introduction.......................................................................................................... 3
2.0 Participant profile................................................................................................. 4
2.1 Gender Distribution........................................................................................... 4
2.2 Age Distribution................................................................................................. 5
2.3 Major Postal Code of the Visitors.......................................................................5
2.4 Income Level of the Visitors..............................................................................6
2.5 Mode of Transportation..................................................................................... 7
2.6 Country of Origin............................................................................................... 7
3.0 Report Findings.................................................................................................... 9
3.1 Descriptive analysis........................................................................................ 10
3.2 Objective 3.1 Information behind Participation in the Boat Show...................10
3.21 Participation in the Boat Show Relation with Age of the Visitors (Chi-
Square Test)....................................................................................................... 10
3.22 Participation in the Boat Show Relation with Country Origin of Visitors (T-
test).................................................................................................................... 11
3.3 Objective 3.2 Attitude about benefit of participation in water based activities
.............................................................................................................................. 12
3.31 Attitude about benefit of participation with gender of the visitors (T-test) 12
3.32 Attitude about benefit of participation with Age of the visitors (ANOVA)...14
3.4 Objective 3.3 Barrier to participation in boating or water based activities......15
3.41 Barrier to participation with age of the visitors (Chi-Square Test).............15
3.5 Objective 3.4 Visitors’ perception about facilities of the Boat Show...............16
3.51 Visitors’ perception about Marians facility of two genders (T-test)............16
3.52 Visitors’ perception about Marians facility of two genders (Chi-Square Test)
........................................................................................................................... 17
3.53 Visitors’ perception about Boat Ramp facility of Two Genders (T-test)......18
2

Entertainment Aspects at Bunbury Boat Show – A Survey on Customers’ Attitude
3.6 Objective 3.5 Boat Show good value for money..............................................19
3.61 Value for Money on Gender Biasness (T-test)............................................19
3.62 Value for Money on Age Group Biasness (ANOVA).....................................20
3.7 Objective 3.6 Boat Show to be very informative.............................................21
3.71 Informative Attitude on Age Groups (T-test)..............................................21
3.8 Objective 3.7 Influence of exhibitors’ websites on the visitors........................23
3.81 Influence of Exhibitors’ Websites on Origin of the Visitor (T-test)..............23
3.9 Objective 3.8 Reflection of Attachment from time spent at the Boat Show....24
3.91 Reflection of Time Spent on Mode of Transport (Chi-Square).....................24
4.0 Conclusion and Recommendations.....................................................................25
5.0 References......................................................................................................... 27
6.0 Appendices......................................................................................................... 30
Table 14: Descriptive Details of the Customers' Attitude Objectives.................30
3
⊘ This is a preview!⊘
Do you want full access?
Subscribe today to unlock all pages.

Trusted by 1+ million students worldwide

Entertainment Aspects at Bunbury Boat Show – A Survey on Customers’ Attitude
1.0 Introduction
The aim of the scholar was to investigate the consumer behavior, attitudes, and online
activity of visitors to the Bunbury Boat Show. Using a structured questionnaire as a basic
research tool, a large-scale quantitative study was designed and conducted. The
questionnaires were delivered to 300 visitors at the end of the visit. Participants settled in
different parts of Australia were selected for their opinions about the boat show. The study
took place during the "Bunbury Boat Show" (BBS) season, a major annual event that takes
place in late spring. The self-filling method was chosen and the questionnaires were designed
with clear guidelines, an easy-to-read format and a simple structure. Prior to distribution to
the public, the questionnaire was tested and finalized for minor revisions. A practical
sampling procedure was carried out and respondents were asked to complete the tripartite
questionnaire immediately after the visit. Finally, a sample of 244 useful questionnaires was
collected. Perspectives of the research were towards the attitudes and behaviors of consumers
which would guide the management to frame its policies (Ariffin, Abdullah, Baba, Jipiu, &
Anuar, 2016). It was noted that attitudes and consumption behavior with respect to the
exhibition was the primary objective for the management amongst all the aims. The behavior
of the participants towards the benefit from water-based activities, and time spent at BBS
along with demographic profile of the participants were also scrutinized by the scholar.
4
Paraphrase This Document
Need a fresh take? Get an instant paraphrase of this document with our AI Paraphraser

Entertainment Aspects at Bunbury Boat Show – A Survey on Customers’ Attitude
2.0 Participant profile
2.1 Gender Distribution
The sample of convenience of 244 visitors to the boat show had a male domain (n = 143, p =
58.6%) compared to that of women (n = 92, p = 37.7%). The distribution was in line with the
fact that fishing always has been the attractive sports for men compared to women. But, presence
of 37.7% of female visitors was a success for the Bunbury show in terms of entertainment value.
Figure 1: Bunbury Boat Show Visitors’ (Participants’) Gender Distribution
2.2 Age Distribution
Approximately two-thirds of respondents (n = 161, p = 66.0%) were more than 40 years old,
where 27.9% of the participants found were aged between 50 years to 64 years. The older or
5

Entertainment Aspects at Bunbury Boat Show – A Survey on Customers’ Attitude
matured age group had always shown more interest in these entertainment shows compared to
younger age people. The age distribution was a perfect fit for consistent number of visitors for
the entertainment show.
Figure 2: Age Distribution of the Participants
2.3 Major Postal Code of the Visitors
The visitor's postal code showed that a large part of the participants remained in the postal
code of 6210 (n = 36, p = 17.5%), and the remainder remained scattered in several other postal
codes. The focus of the show organizers should be on the visitors from the particular postal code.
It was also probable that the location was near to Bunbury show place. A major of 82.5%
participants were scatter at various parts of the country.
6
⊘ This is a preview!⊘
Do you want full access?
Subscribe today to unlock all pages.

Trusted by 1+ million students worldwide

Entertainment Aspects at Bunbury Boat Show – A Survey on Customers’ Attitude
Figure 3: Distribution of Participants' Postal Code
2.4 Income Level of the Visitors
It was noted that nearly half of the participants (n = 119, p = 48.8%) had a monthly income of
more than $101k. Due to presence of considerable percentage of high income group of visitors,
the success of the show should focus on the entertainment as well as convenience part of the
show for these well off people.
Figure 4: Income Level of the Participant Visitor
7
Paraphrase This Document
Need a fresh take? Get an instant paraphrase of this document with our AI Paraphraser

Entertainment Aspects at Bunbury Boat Show – A Survey on Customers’ Attitude
2.5 Mode of Transportation
Regarding the way of transporting the respondents to visit the Bunbury spectacle, interesting
results showed that most of the sample visited the show with their cars (n = 212, p = 86.9%). The
trend also resembled with the fact that most of the visitors belonged to the high income groups.
This also reflected the affordability part of the visitors, and the organizers of the show should
focus on this particular issue for future organization of the Bunbury show.
.
Figure 5: Percentage Distribution Transport Mode
2.6 Country of Origin
The country of origin of the majority of respondents (p = 61.1%) was absent. Australians (n =
74, p = 30.3%) could be considered as majority commissions compared to visitors of external
origin (n = 21, p = 8.6%).
8

Entertainment Aspects at Bunbury Boat Show – A Survey on Customers’ Attitude
Figure 6: Country of Origin of the Participants
Table 1Demographic Details of the Bunbury Boat Show Participants
9
Figure 6: Country of Origin of the Participants
Table 1Demographic Details of the Bunbury Boat Show Participants
9
⊘ This is a preview!⊘
Do you want full access?
Subscribe today to unlock all pages.

Trusted by 1+ million students worldwide

Entertainment Aspects at Bunbury Boat Show – A Survey on Customers’ Attitude
POSTAL CODE Frequency Percent
6210 36 17.5%
Other 170 82.5%
Country Of Origin
Australia 74 30.3
Outside Australia 21 8.6
Mode of Transport
Car 212 86.9
Bus 8 3.3
Train 10 4.1
Walking 2 .8
Other 3 1.2
Gender Distribution
Male 143 58.6
Female 92 37.7
Age Distribution
18-24 11 4.5
25-34 29 11.9
35-39 34 13.9
40-49 58 23.8
50-64 68 27.9
65 and over 35 14.3
Income Level
Less than $40k 12 4.9
$41k-$60k 16 6.6
$61k-$80k 13 5.3
$81k-$100k 35 14.3
$101k-$120k 31 12.7
$121k-$140k 21 8.6
$141k and over 67 27.5
3.0 Report Findings
10
Paraphrase This Document
Need a fresh take? Get an instant paraphrase of this document with our AI Paraphraser

Entertainment Aspects at Bunbury Boat Show – A Survey on Customers’ Attitude
3.1 Descriptive analysis
In order to achieve the third research objective of this study, the percentage responses to
the individual surveys were found using SPSS 20 version and are shown in table 2. These
percentages give an indication of the influence of some of the Festival's attributes in the
respondents ' opinions of Bunbury Show. In order to identify the behavioral differences cross
tabulation divided the sample into subgroups corresponding to demographic fields. The six
segments differed in their commitment to display behavioral intentions.
3.2 Objective 3.1 Information behind Participation in the Boat Show
3.21 Participation in the Boat Show Relation with Age of the Visitors (Chi-Square Test)
The participants also seemed to agree more with the statements that showed that their
observations were influenced by the TV advertisement and newspapers.
Figure 7: How Information Obtained about the Boat Show
For cross relation of age groups with source of information of the boat show, it was
hypothesized that information source of the boat show was independent of the age of the
11

Entertainment Aspects at Bunbury Boat Show – A Survey on Customers’ Attitude
visitors. After carefully examining the results, it appeared that the difference between the five
age groups was significant for mode of hearing about the boat show ( χ2=103 .89 , p < 0. 05 ).
Newspaper was the leading source of information of the boat show, whereas visitors aged
between50 – 64 were informed in a better way compared to other age groups.
Table 2: Cross Tabulation of Age Group with Source of Information
a.18-24 b.25-34 c.35-39 d.40-49 e.50-64 f.65 and over
a.Online .9% .4% .9% 1.3% 3.4%
b.Email .4% .4%
c.Facebook .4% .9% .4% 1.7%
d.Mail out .4% .4%
e.Newspaper 1.3% 2.6% 6.0% 4.7% 3.0% 17.4%
f.Magazine 2.1% .9% .4% 3.4%
g.TV .4% 4.3% 5.1% 3.8% 4.7% .9% 19.1%
h.Outdoor advertising .4% 2.1% 1.7% 3.0% 1.3% 8.5%
i.From a friend 1.7% 1.7% .4% 4.3% 2.6% 1.3% 11.9%
j.Radio 2.1% 2.1% 2.1% 1.7% 8.1%
k.Work or industry
colleagues .4% .9% .4% 2.1% .9% 4.7%
I. Other .9% .4% .9% 3.4% 8.9% 6.4% 20.9%
Total 4.7% 12.3% 14.5% 24.7% 28.9% 14.9% 100.0%
In which Age Group do you belong? Total
3.22 Participation in the Boat Show Relation with Country Origin of Visitors (T-test)
Furthermore it was also hypothesized that country origin of visitors was independent of
the medium of information of the show. It appeared that the disparity between the origins of
the visitors was not statistically significant for mode of hearing about the boat show (t = 1.67, p
= 0.098) at 5% level of significance. Australian origin participants were found to be equally
informed compared to outside Australia visitors, and no statistical difference in perception about
origin of information of the aboriginal and outside visitors were found for inquiring the news of
boat show from TV and newspaper.
12
⊘ This is a preview!⊘
Do you want full access?
Subscribe today to unlock all pages.

Trusted by 1+ million students worldwide
1 out of 37
Related Documents

Your All-in-One AI-Powered Toolkit for Academic Success.
+13062052269
info@desklib.com
Available 24*7 on WhatsApp / Email
Unlock your academic potential
Copyright © 2020–2025 A2Z Services. All Rights Reserved. Developed and managed by ZUCOL.