Entrepreneurial Finance Project: Analyzing Wesfarmers Limited
VerifiedAdded on 2023/06/05
|12
|2584
|405
Report
AI Summary
This report provides a comprehensive analysis of Wesfarmers Limited's financial performance through balance sheet optimization. It evaluates the company's liquidity and working capital, highlighting that its current ratio and quick ratio are 0.87 and 0.27, respectively, indicating potential challenges in meeting short-term debt obligations. The working capital is also negative, suggesting insufficient funds for daily operations. Recommendations are provided to improve working capital and liquidity, such as incentivizing receivables, managing inventory, and reducing expenses. A competitor comparison with Woolworths Limited reveals differences in cash conversion cycles. The report concludes by emphasizing the need for changes in managing liquidity, working capital, and the cash conversion cycle to mitigate associated risks and improve overall financial health. The document is contributed by a student and available on Desklib, a platform offering study tools and resources for students.
Running Head: Entrepreneurial Finance
1
Project Report: Entrepreneurial Finance
1
Project Report: Entrepreneurial Finance
Paraphrase This Document
Need a fresh take? Get an instant paraphrase of this document with our AI Paraphraser
Entrepreneurial Finance
2
Contents
Balance sheet optimization:......................................................................................................... 3
Introduction:................................................................................................................................. 3
Company overview:..................................................................................................................... 3
Liquidity and working capital analysis:.........................................................................................3
Recommendation to improve the working capital and liquidity:...................................................4
Competitor’s comparison:............................................................................................................ 5
Improvement in KPI:.................................................................................................................... 6
Conclusion:.................................................................................................................................. 6
References:................................................................................................................................. 7
Entrepreneurial Finance
3
Balance sheet optimization:
Introduction:
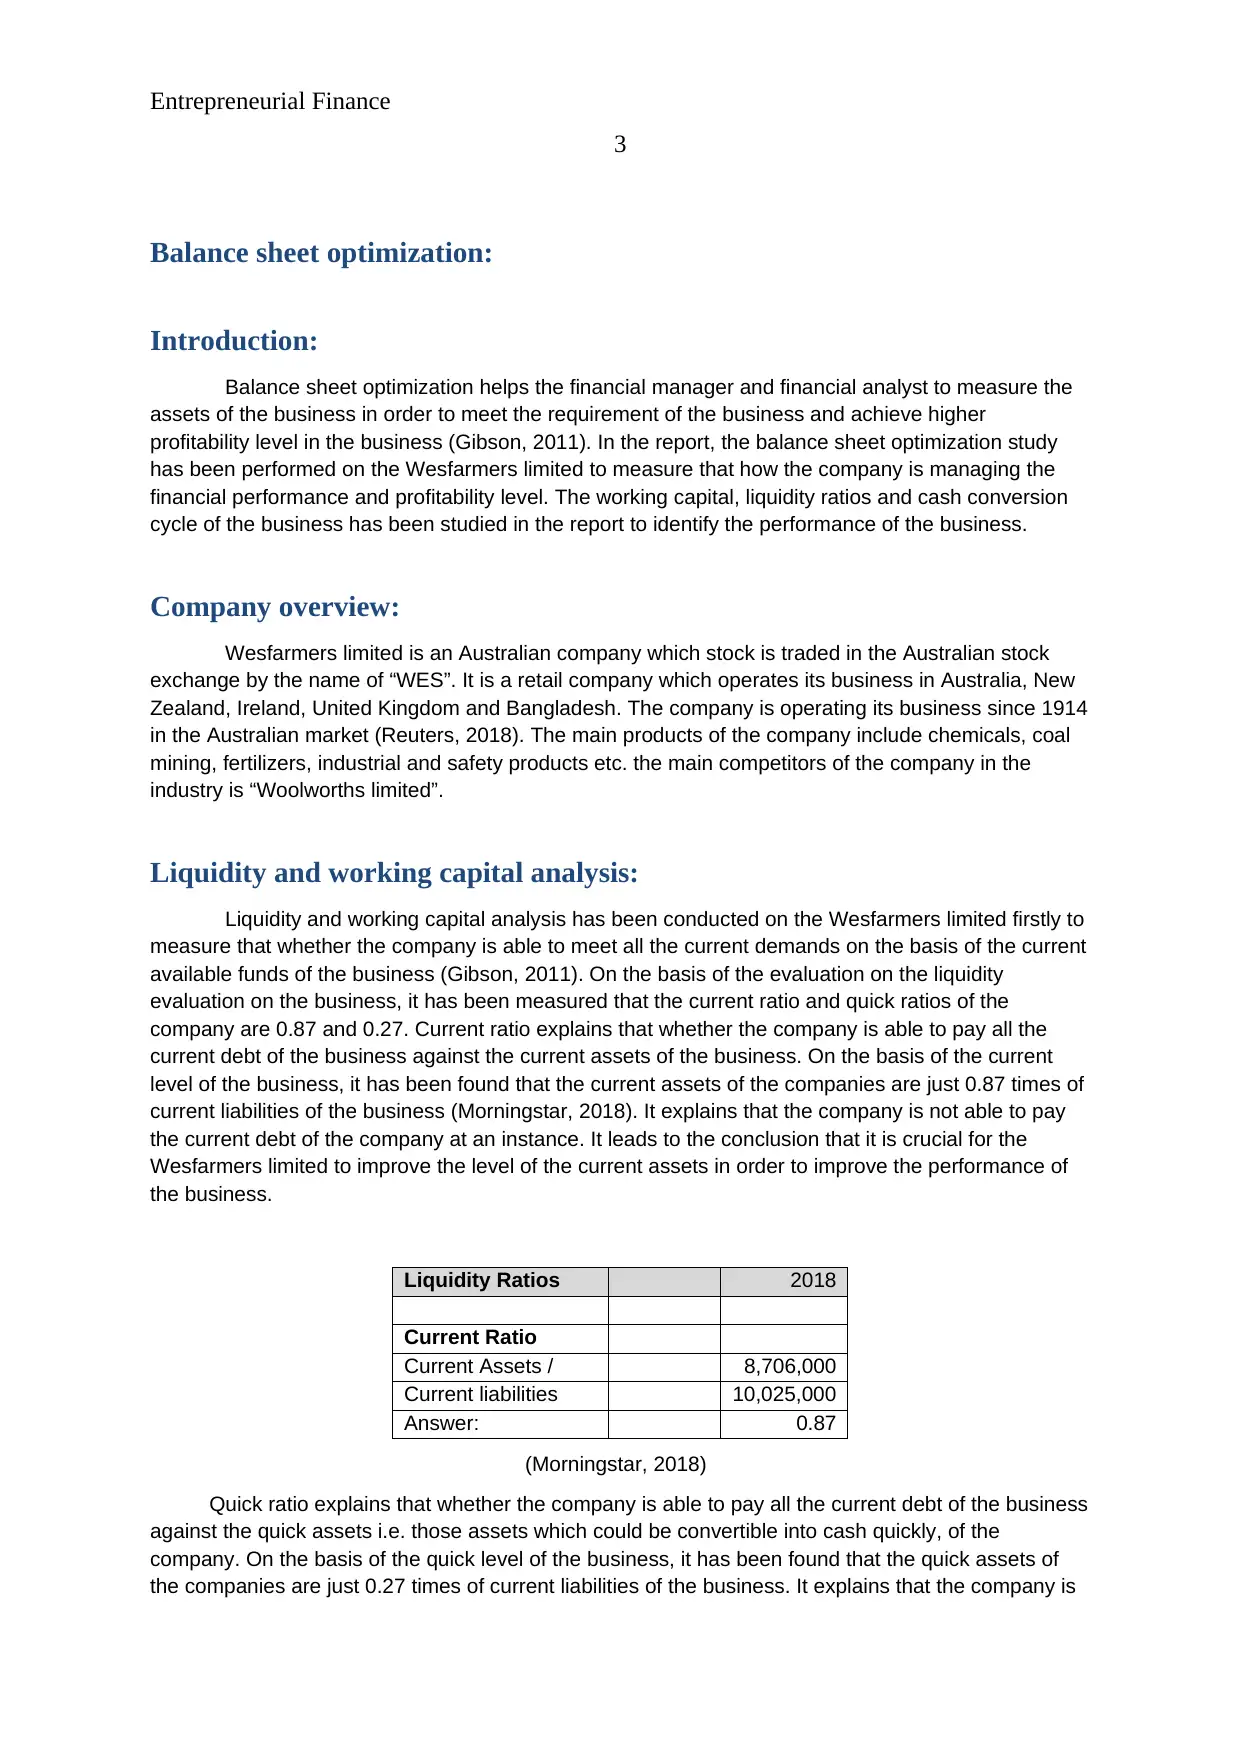
Balance sheet optimization helps the financial manager and financial analyst to measure the
assets of the business in order to meet the requirement of the business and achieve higher
profitability level in the business (Gibson, 2011). In the report, the balance sheet optimization study
has been performed on the Wesfarmers limited to measure that how the company is managing the
financial performance and profitability level. The working capital, liquidity ratios and cash conversion
cycle of the business has been studied in the report to identify the performance of the business.
Company overview:
Wesfarmers limited is an Australian company which stock is traded in the Australian stock
exchange by the name of “WES”. It is a retail company which operates its business in Australia, New
Zealand, Ireland, United Kingdom and Bangladesh. The company is operating its business since 1914
in the Australian market (Reuters, 2018). The main products of the company include chemicals, coal
mining, fertilizers, industrial and safety products etc. the main competitors of the company in the
industry is “Woolworths limited”.
Liquidity and working capital analysis:
Liquidity and working capital analysis has been conducted on the Wesfarmers limited firstly to
measure that whether the company is able to meet all the current demands on the basis of the current
available funds of the business (Gibson, 2011). On the basis of the evaluation on the liquidity
evaluation on the business, it has been measured that the current ratio and quick ratios of the
company are 0.87 and 0.27. Current ratio explains that whether the company is able to pay all the
current debt of the business against the current assets of the business. On the basis of the current
level of the business, it has been found that the current assets of the companies are just 0.87 times of
current liabilities of the business (Morningstar, 2018). It explains that the company is not able to pay
the current debt of the company at an instance. It leads to the conclusion that it is crucial for the
Wesfarmers limited to improve the level of the current assets in order to improve the performance of
the business.
Liquidity Ratios 2018
Current Ratio
Current Assets / 8,706,000
Current liabilities 10,025,000
Answer: 0.87
(Morningstar, 2018)
Quick ratio explains that whether the company is able to pay all the current debt of the business
against the quick assets i.e. those assets which could be convertible into cash quickly, of the
company. On the basis of the quick level of the business, it has been found that the quick assets of
the companies are just 0.27 times of current liabilities of the business. It explains that the company is
3
Balance sheet optimization:
Introduction:
Balance sheet optimization helps the financial manager and financial analyst to measure the
assets of the business in order to meet the requirement of the business and achieve higher
profitability level in the business (Gibson, 2011). In the report, the balance sheet optimization study
has been performed on the Wesfarmers limited to measure that how the company is managing the
financial performance and profitability level. The working capital, liquidity ratios and cash conversion
cycle of the business has been studied in the report to identify the performance of the business.
Company overview:
Wesfarmers limited is an Australian company which stock is traded in the Australian stock
exchange by the name of “WES”. It is a retail company which operates its business in Australia, New
Zealand, Ireland, United Kingdom and Bangladesh. The company is operating its business since 1914
in the Australian market (Reuters, 2018). The main products of the company include chemicals, coal
mining, fertilizers, industrial and safety products etc. the main competitors of the company in the
industry is “Woolworths limited”.
Liquidity and working capital analysis:
Liquidity and working capital analysis has been conducted on the Wesfarmers limited firstly to
measure that whether the company is able to meet all the current demands on the basis of the current
available funds of the business (Gibson, 2011). On the basis of the evaluation on the liquidity
evaluation on the business, it has been measured that the current ratio and quick ratios of the
company are 0.87 and 0.27. Current ratio explains that whether the company is able to pay all the
current debt of the business against the current assets of the business. On the basis of the current
level of the business, it has been found that the current assets of the companies are just 0.87 times of
current liabilities of the business (Morningstar, 2018). It explains that the company is not able to pay
the current debt of the company at an instance. It leads to the conclusion that it is crucial for the
Wesfarmers limited to improve the level of the current assets in order to improve the performance of
the business.
Liquidity Ratios 2018
Current Ratio
Current Assets / 8,706,000
Current liabilities 10,025,000
Answer: 0.87
(Morningstar, 2018)
Quick ratio explains that whether the company is able to pay all the current debt of the business
against the quick assets i.e. those assets which could be convertible into cash quickly, of the
company. On the basis of the quick level of the business, it has been found that the quick assets of
the companies are just 0.27 times of current liabilities of the business. It explains that the company is
⊘ This is a preview!⊘
Do you want full access?
Subscribe today to unlock all pages.
Trusted by 1+ million students worldwide
Entrepreneurial Finance
4
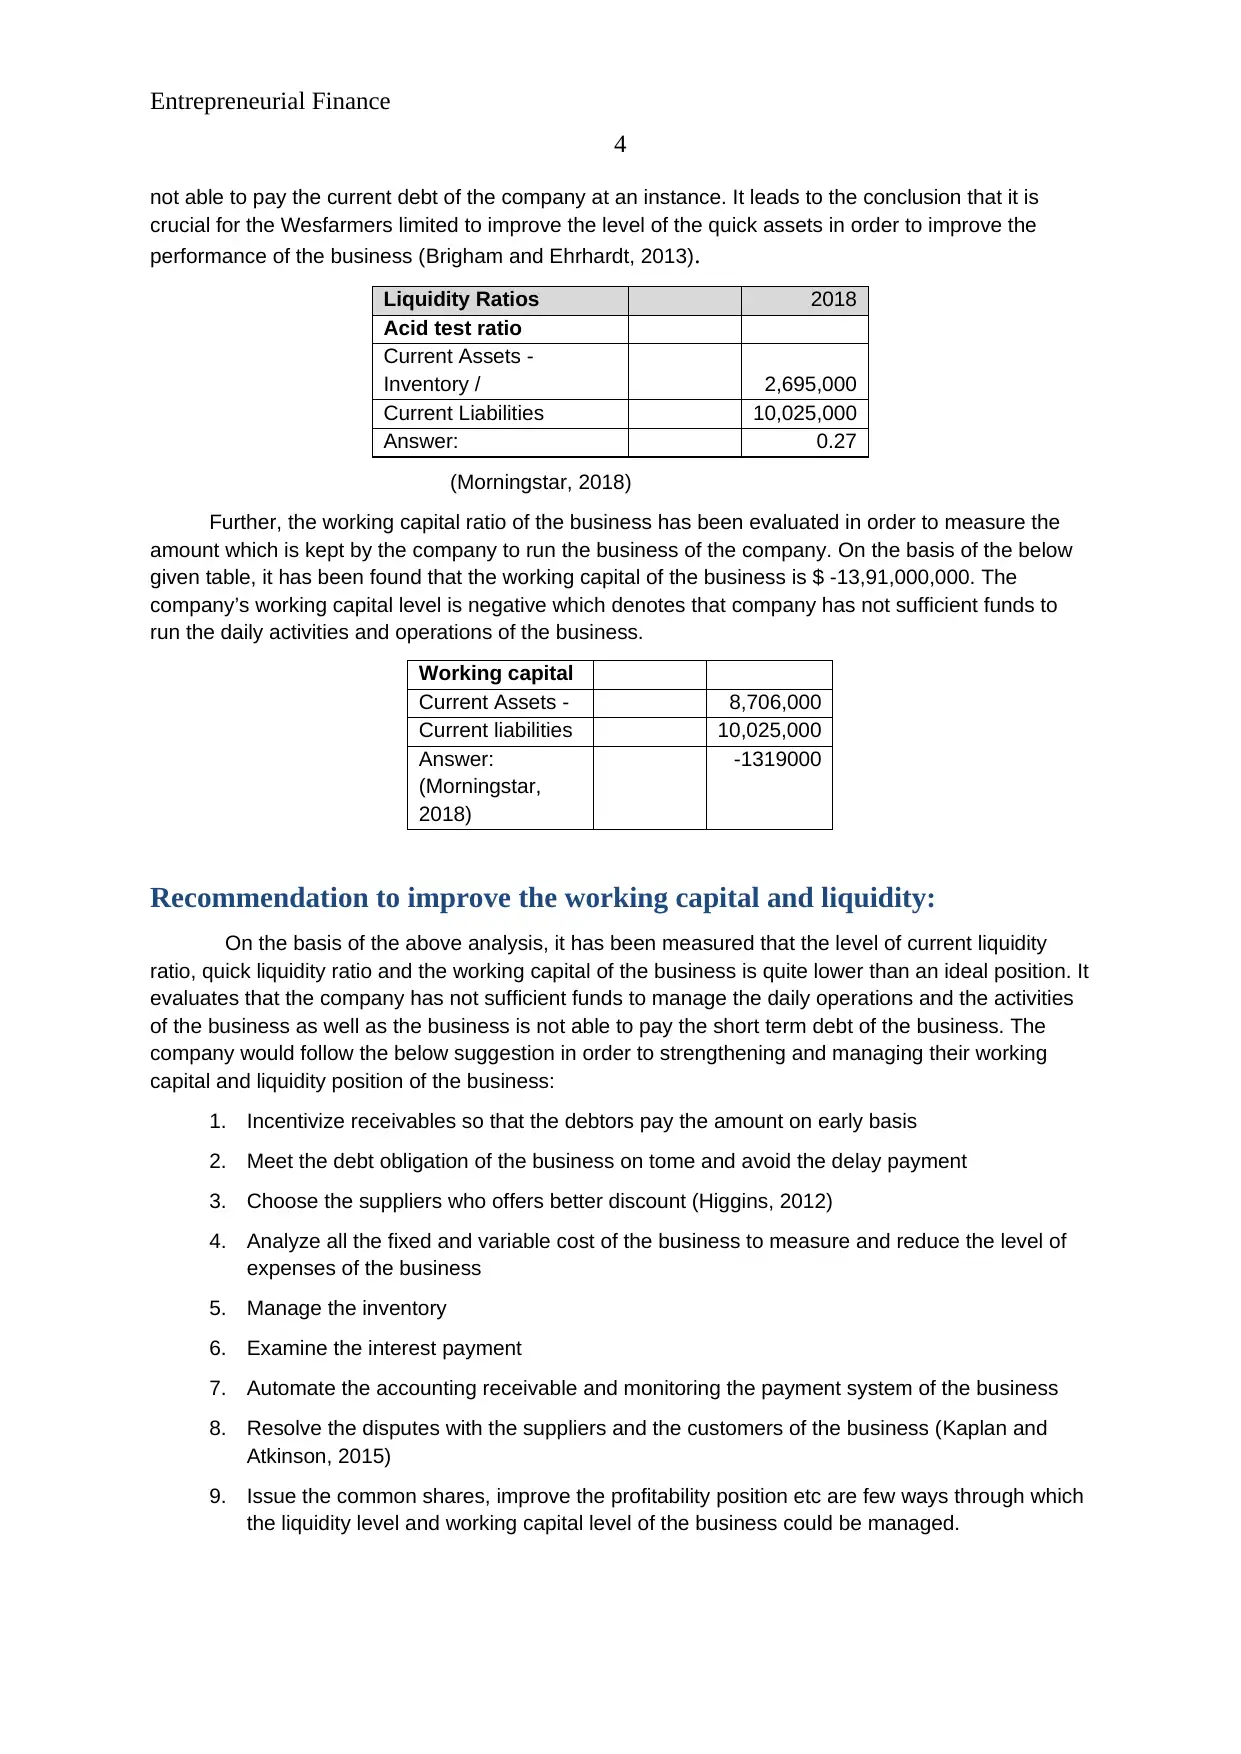
not able to pay the current debt of the company at an instance. It leads to the conclusion that it is
crucial for the Wesfarmers limited to improve the level of the quick assets in order to improve the
performance of the business (Brigham and Ehrhardt, 2013).
Liquidity Ratios 2018
Acid test ratio
Current Assets -
Inventory / 2,695,000
Current Liabilities 10,025,000
Answer: 0.27
(Morningstar, 2018)
Further, the working capital ratio of the business has been evaluated in order to measure the
amount which is kept by the company to run the business of the company. On the basis of the below
given table, it has been found that the working capital of the business is $ -13,91,000,000. The
company’s working capital level is negative which denotes that company has not sufficient funds to
run the daily activities and operations of the business.
Working capital
Current Assets - 8,706,000
Current liabilities 10,025,000
Answer: -1319000
(Morningstar,
2018)
Recommendation to improve the working capital and liquidity:
On the basis of the above analysis, it has been measured that the level of current liquidity
ratio, quick liquidity ratio and the working capital of the business is quite lower than an ideal position. It
evaluates that the company has not sufficient funds to manage the daily operations and the activities
of the business as well as the business is not able to pay the short term debt of the business. The
company would follow the below suggestion in order to strengthening and managing their working
capital and liquidity position of the business:
1. Incentivize receivables so that the debtors pay the amount on early basis
2. Meet the debt obligation of the business on tome and avoid the delay payment
3. Choose the suppliers who offers better discount (Higgins, 2012)
4. Analyze all the fixed and variable cost of the business to measure and reduce the level of
expenses of the business
5. Manage the inventory
6. Examine the interest payment
7. Automate the accounting receivable and monitoring the payment system of the business
8. Resolve the disputes with the suppliers and the customers of the business (Kaplan and
Atkinson, 2015)
9. Issue the common shares, improve the profitability position etc are few ways through which
the liquidity level and working capital level of the business could be managed.
4
not able to pay the current debt of the company at an instance. It leads to the conclusion that it is
crucial for the Wesfarmers limited to improve the level of the quick assets in order to improve the
performance of the business (Brigham and Ehrhardt, 2013).
Liquidity Ratios 2018
Acid test ratio
Current Assets -
Inventory / 2,695,000
Current Liabilities 10,025,000
Answer: 0.27
(Morningstar, 2018)
Further, the working capital ratio of the business has been evaluated in order to measure the
amount which is kept by the company to run the business of the company. On the basis of the below
given table, it has been found that the working capital of the business is $ -13,91,000,000. The
company’s working capital level is negative which denotes that company has not sufficient funds to
run the daily activities and operations of the business.
Working capital
Current Assets - 8,706,000
Current liabilities 10,025,000
Answer: -1319000
(Morningstar,
2018)
Recommendation to improve the working capital and liquidity:
On the basis of the above analysis, it has been measured that the level of current liquidity
ratio, quick liquidity ratio and the working capital of the business is quite lower than an ideal position. It
evaluates that the company has not sufficient funds to manage the daily operations and the activities
of the business as well as the business is not able to pay the short term debt of the business. The
company would follow the below suggestion in order to strengthening and managing their working
capital and liquidity position of the business:
1. Incentivize receivables so that the debtors pay the amount on early basis
2. Meet the debt obligation of the business on tome and avoid the delay payment
3. Choose the suppliers who offers better discount (Higgins, 2012)
4. Analyze all the fixed and variable cost of the business to measure and reduce the level of
expenses of the business
5. Manage the inventory
6. Examine the interest payment
7. Automate the accounting receivable and monitoring the payment system of the business
8. Resolve the disputes with the suppliers and the customers of the business (Kaplan and
Atkinson, 2015)
9. Issue the common shares, improve the profitability position etc are few ways through which
the liquidity level and working capital level of the business could be managed.
Paraphrase This Document
Need a fresh take? Get an instant paraphrase of this document with our AI Paraphraser
Entrepreneurial Finance
5
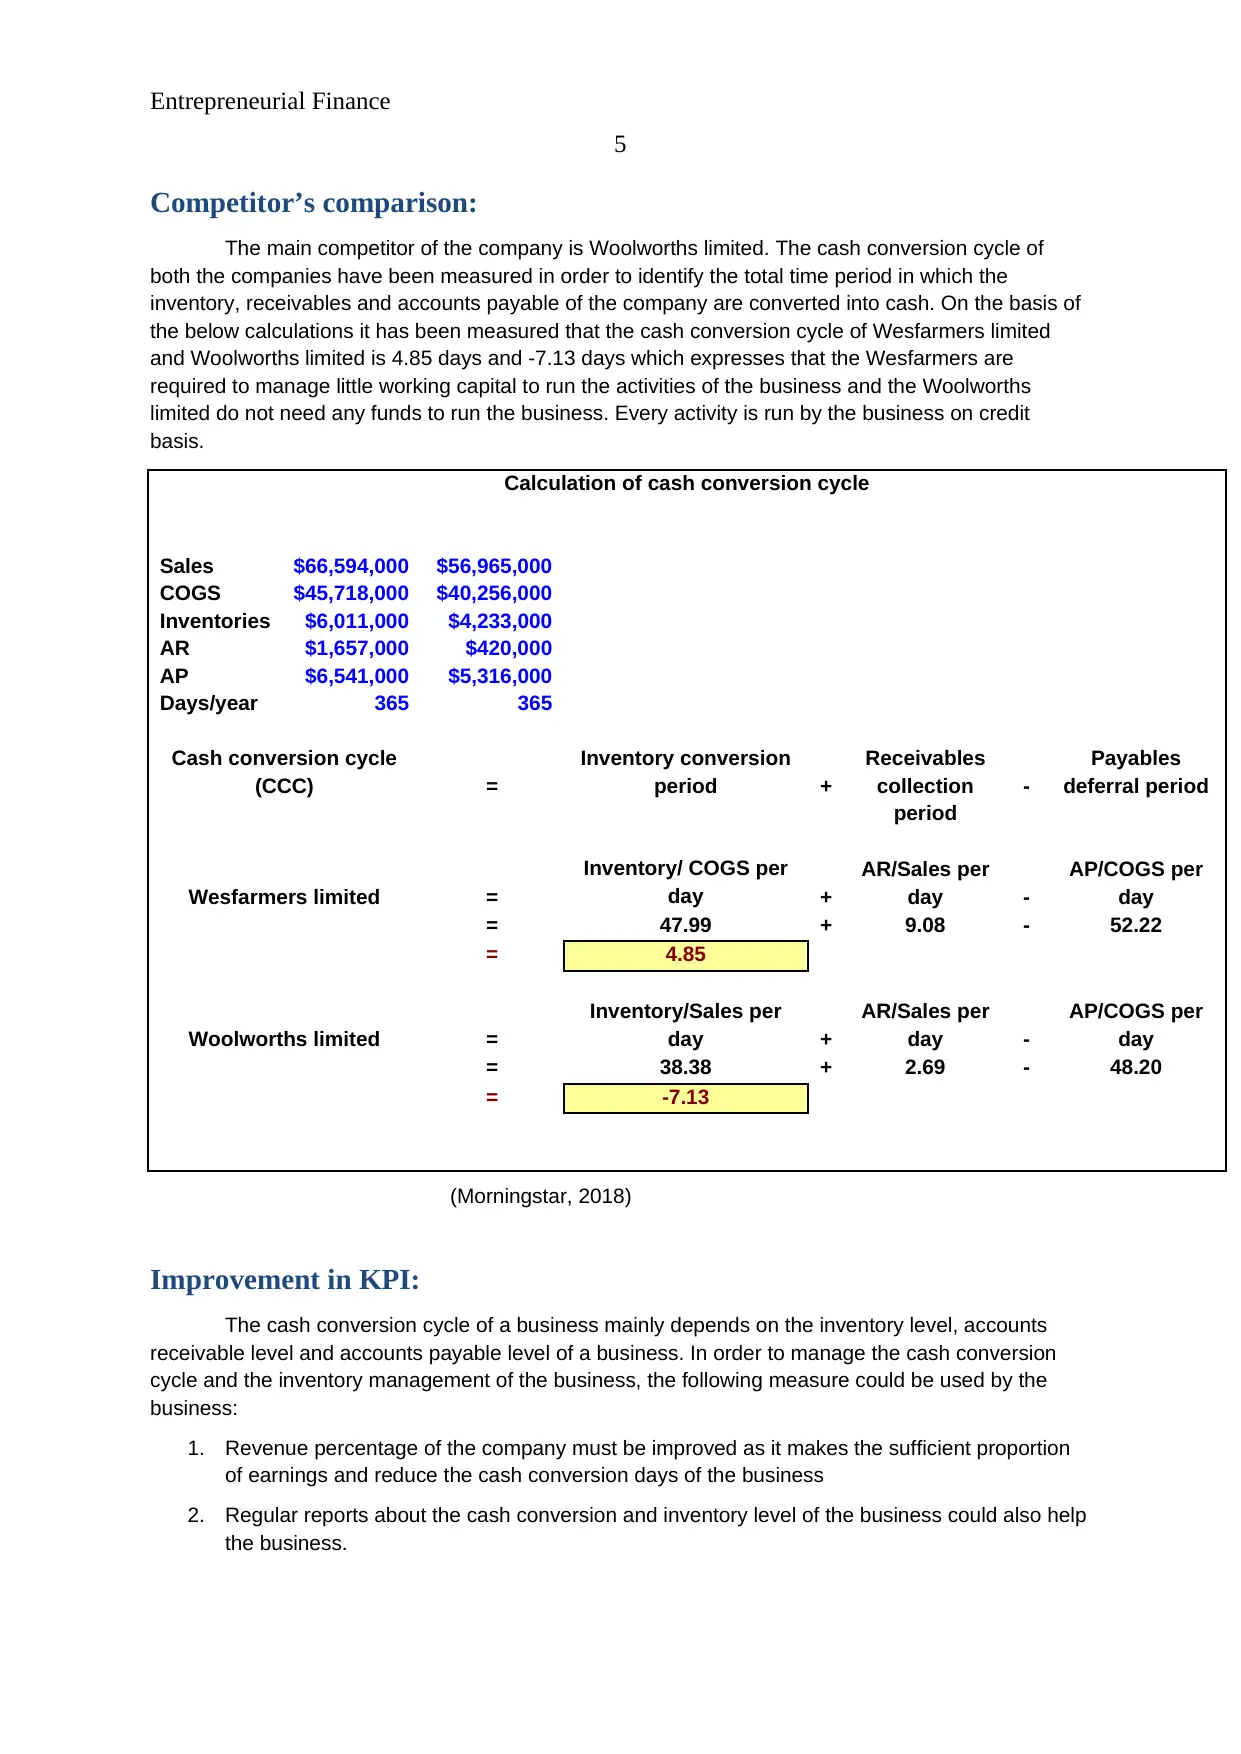
Competitor’s comparison:
The main competitor of the company is Woolworths limited. The cash conversion cycle of
both the companies have been measured in order to identify the total time period in which the
inventory, receivables and accounts payable of the company are converted into cash. On the basis of
the below calculations it has been measured that the cash conversion cycle of Wesfarmers limited
and Woolworths limited is 4.85 days and -7.13 days which expresses that the Wesfarmers are
required to manage little working capital to run the activities of the business and the Woolworths
limited do not need any funds to run the business. Every activity is run by the business on credit
basis.
Calculation of cash conversion cycle
Sales $66,594,000 $56,965,000
COGS $45,718,000 $40,256,000
Inventories $6,011,000 $4,233,000
AR $1,657,000 $420,000
AP $6,541,000 $5,316,000
Days/year 365 365
Cash conversion cycle
(CCC) =
Inventory conversion
period +
Receivables
collection
period
-
Payables
deferral period
Wesfarmers limited =
Inventory/ COGS per
day +
AR/Sales per
day -
AP/COGS per
day
= 47.99 + 9.08 - 52.22
= 4.85
Woolworths limited =
Inventory/Sales per
day +
AR/Sales per
day -
AP/COGS per
day
= 38.38 + 2.69 - 48.20
= -7.13
(Morningstar, 2018)
Improvement in KPI:
The cash conversion cycle of a business mainly depends on the inventory level, accounts
receivable level and accounts payable level of a business. In order to manage the cash conversion
cycle and the inventory management of the business, the following measure could be used by the
business:
1. Revenue percentage of the company must be improved as it makes the sufficient proportion
of earnings and reduce the cash conversion days of the business
2. Regular reports about the cash conversion and inventory level of the business could also help
the business.
5
Competitor’s comparison:
The main competitor of the company is Woolworths limited. The cash conversion cycle of
both the companies have been measured in order to identify the total time period in which the
inventory, receivables and accounts payable of the company are converted into cash. On the basis of
the below calculations it has been measured that the cash conversion cycle of Wesfarmers limited
and Woolworths limited is 4.85 days and -7.13 days which expresses that the Wesfarmers are
required to manage little working capital to run the activities of the business and the Woolworths
limited do not need any funds to run the business. Every activity is run by the business on credit
basis.
Calculation of cash conversion cycle
Sales $66,594,000 $56,965,000
COGS $45,718,000 $40,256,000
Inventories $6,011,000 $4,233,000
AR $1,657,000 $420,000
AP $6,541,000 $5,316,000
Days/year 365 365
Cash conversion cycle
(CCC) =
Inventory conversion
period +
Receivables
collection
period
-
Payables
deferral period
Wesfarmers limited =
Inventory/ COGS per
day +
AR/Sales per
day -
AP/COGS per
day
= 47.99 + 9.08 - 52.22
= 4.85
Woolworths limited =
Inventory/Sales per
day +
AR/Sales per
day -
AP/COGS per
day
= 38.38 + 2.69 - 48.20
= -7.13
(Morningstar, 2018)
Improvement in KPI:
The cash conversion cycle of a business mainly depends on the inventory level, accounts
receivable level and accounts payable level of a business. In order to manage the cash conversion
cycle and the inventory management of the business, the following measure could be used by the
business:
1. Revenue percentage of the company must be improved as it makes the sufficient proportion
of earnings and reduce the cash conversion days of the business
2. Regular reports about the cash conversion and inventory level of the business could also help
the business.
Entrepreneurial Finance
6
3. Automation in the business could also help to manage the inventory level and cash
conversion cycle of the business (Madura, 2011)
4. Regular reports are also helpful to identify the requirements of the business and the
management of the inventory level and cash conversion cycle of the business
5. Days sales outstanding calculations could also help the business to measure the total cash
required for the business.
Conclusion:
To conclude, the performance of Wesfarmers is required to be changes in terms of
management of the liquidity, working capital and cash conversion cycle of the business. These
changes would help the business to manage the business effectively and reduce the associated
working capital and liquidity risk of the business.
⊘ This is a preview!⊘
Do you want full access?
Subscribe today to unlock all pages.
Trusted by 1+ million students worldwide
Entrepreneurial Finance
7
References:
Brigham, E.F. and Ehrhardt, M.C., 2013. Financial management: Theory & practice. Cengage
Learning.
Gibson, C.H., 2011. Financial reporting and analysis. South-Western Cengage Learning.
Higgins, R.C., 2012. Analysis for financial management. McGraw-Hill/Irwin.
Kaplan, R.S. and Atkinson, A.A., 2015. Advanced management accounting. PHI Learning.
Koller, T., Goedhart, M. and Wessels, D., 2010. Valuation: measuring and managing the value of
companies (Vol. 499). john Wiley and sons.
Madura, J., 2011. International financial management. Cengage Learning.
Morningstar. 2018. Wesfarmers Limited. (Online). Available at: http://financials.morningstar.com/cash-
flow/cf.html?t=WES®ion=aus&culture=en-US (accessed 4/10/2018).
Morningstar. 2018. Woolworths Limited. (Online). Available at: http://financials.morningstar.com/cash-
flow/cf.html?t=WOW®ion=aus&culture=en-US (accessed 4/10/2018).
Reuters. 2018. Woolworths Limited. (Online). Available at:,
https://www.reuters.com/finance/stocks/company-profile/WOW.AX (accessed 4/10/2018).
Paraphrase This Document
Need a fresh take? Get an instant paraphrase of this document with our AI Paraphraser
Entrepreneurial Finance
8
Appendix:
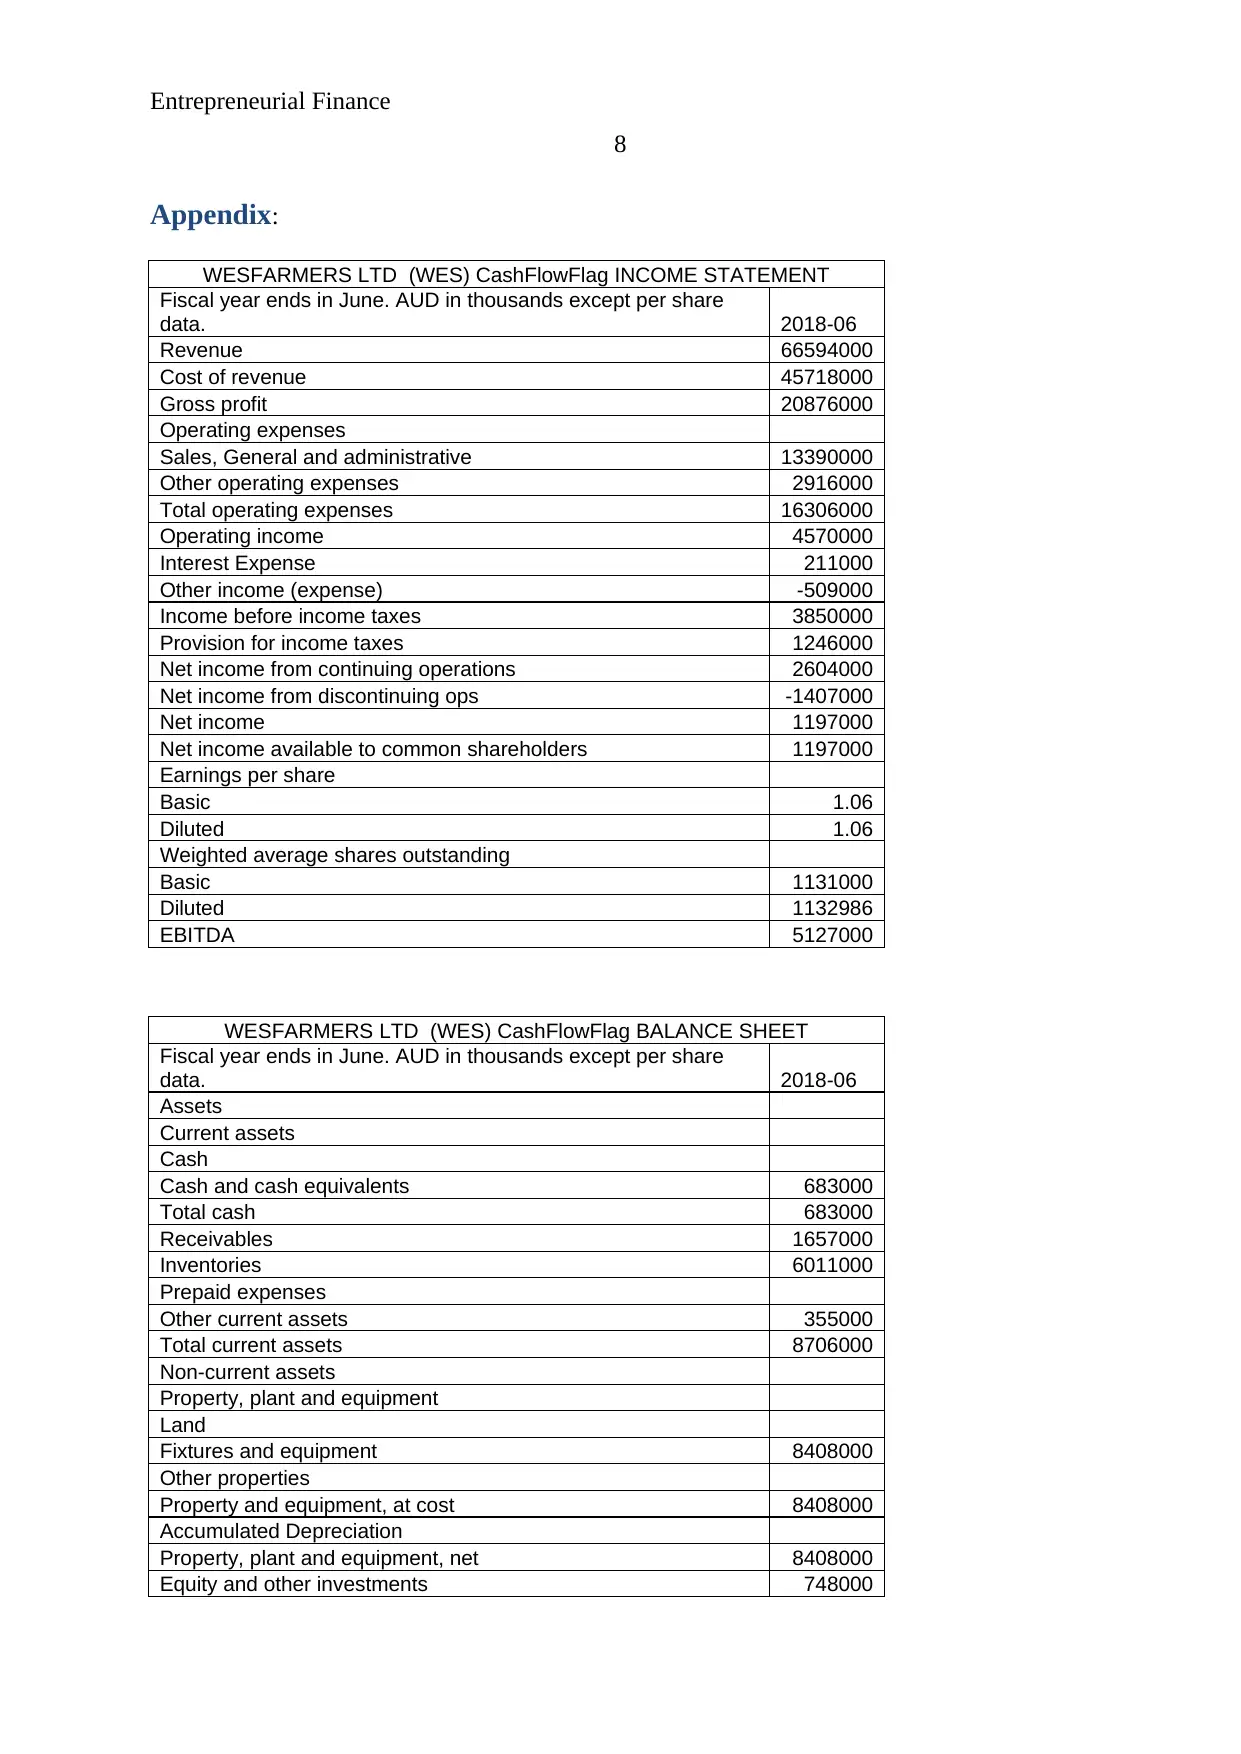
WESFARMERS LTD (WES) CashFlowFlag INCOME STATEMENT
Fiscal year ends in June. AUD in thousands except per share
data. 2018-06
Revenue 66594000
Cost of revenue 45718000
Gross profit 20876000
Operating expenses
Sales, General and administrative 13390000
Other operating expenses 2916000
Total operating expenses 16306000
Operating income 4570000
Interest Expense 211000
Other income (expense) -509000
Income before income taxes 3850000
Provision for income taxes 1246000
Net income from continuing operations 2604000
Net income from discontinuing ops -1407000
Net income 1197000
Net income available to common shareholders 1197000
Earnings per share
Basic 1.06
Diluted 1.06
Weighted average shares outstanding
Basic 1131000
Diluted 1132986
EBITDA 5127000
WESFARMERS LTD (WES) CashFlowFlag BALANCE SHEET
Fiscal year ends in June. AUD in thousands except per share
data. 2018-06
Assets
Current assets
Cash
Cash and cash equivalents 683000
Total cash 683000
Receivables 1657000
Inventories 6011000
Prepaid expenses
Other current assets 355000
Total current assets 8706000
Non-current assets
Property, plant and equipment
Land
Fixtures and equipment 8408000
Other properties
Property and equipment, at cost 8408000
Accumulated Depreciation
Property, plant and equipment, net 8408000
Equity and other investments 748000
8
Appendix:
WESFARMERS LTD (WES) CashFlowFlag INCOME STATEMENT
Fiscal year ends in June. AUD in thousands except per share
data. 2018-06
Revenue 66594000
Cost of revenue 45718000
Gross profit 20876000
Operating expenses
Sales, General and administrative 13390000
Other operating expenses 2916000
Total operating expenses 16306000
Operating income 4570000
Interest Expense 211000
Other income (expense) -509000
Income before income taxes 3850000
Provision for income taxes 1246000
Net income from continuing operations 2604000
Net income from discontinuing ops -1407000
Net income 1197000
Net income available to common shareholders 1197000
Earnings per share
Basic 1.06
Diluted 1.06
Weighted average shares outstanding
Basic 1131000
Diluted 1132986
EBITDA 5127000
WESFARMERS LTD (WES) CashFlowFlag BALANCE SHEET
Fiscal year ends in June. AUD in thousands except per share
data. 2018-06
Assets
Current assets
Cash
Cash and cash equivalents 683000
Total cash 683000
Receivables 1657000
Inventories 6011000
Prepaid expenses
Other current assets 355000
Total current assets 8706000
Non-current assets
Property, plant and equipment
Land
Fixtures and equipment 8408000
Other properties
Property and equipment, at cost 8408000
Accumulated Depreciation
Property, plant and equipment, net 8408000
Equity and other investments 748000
Entrepreneurial Finance
9
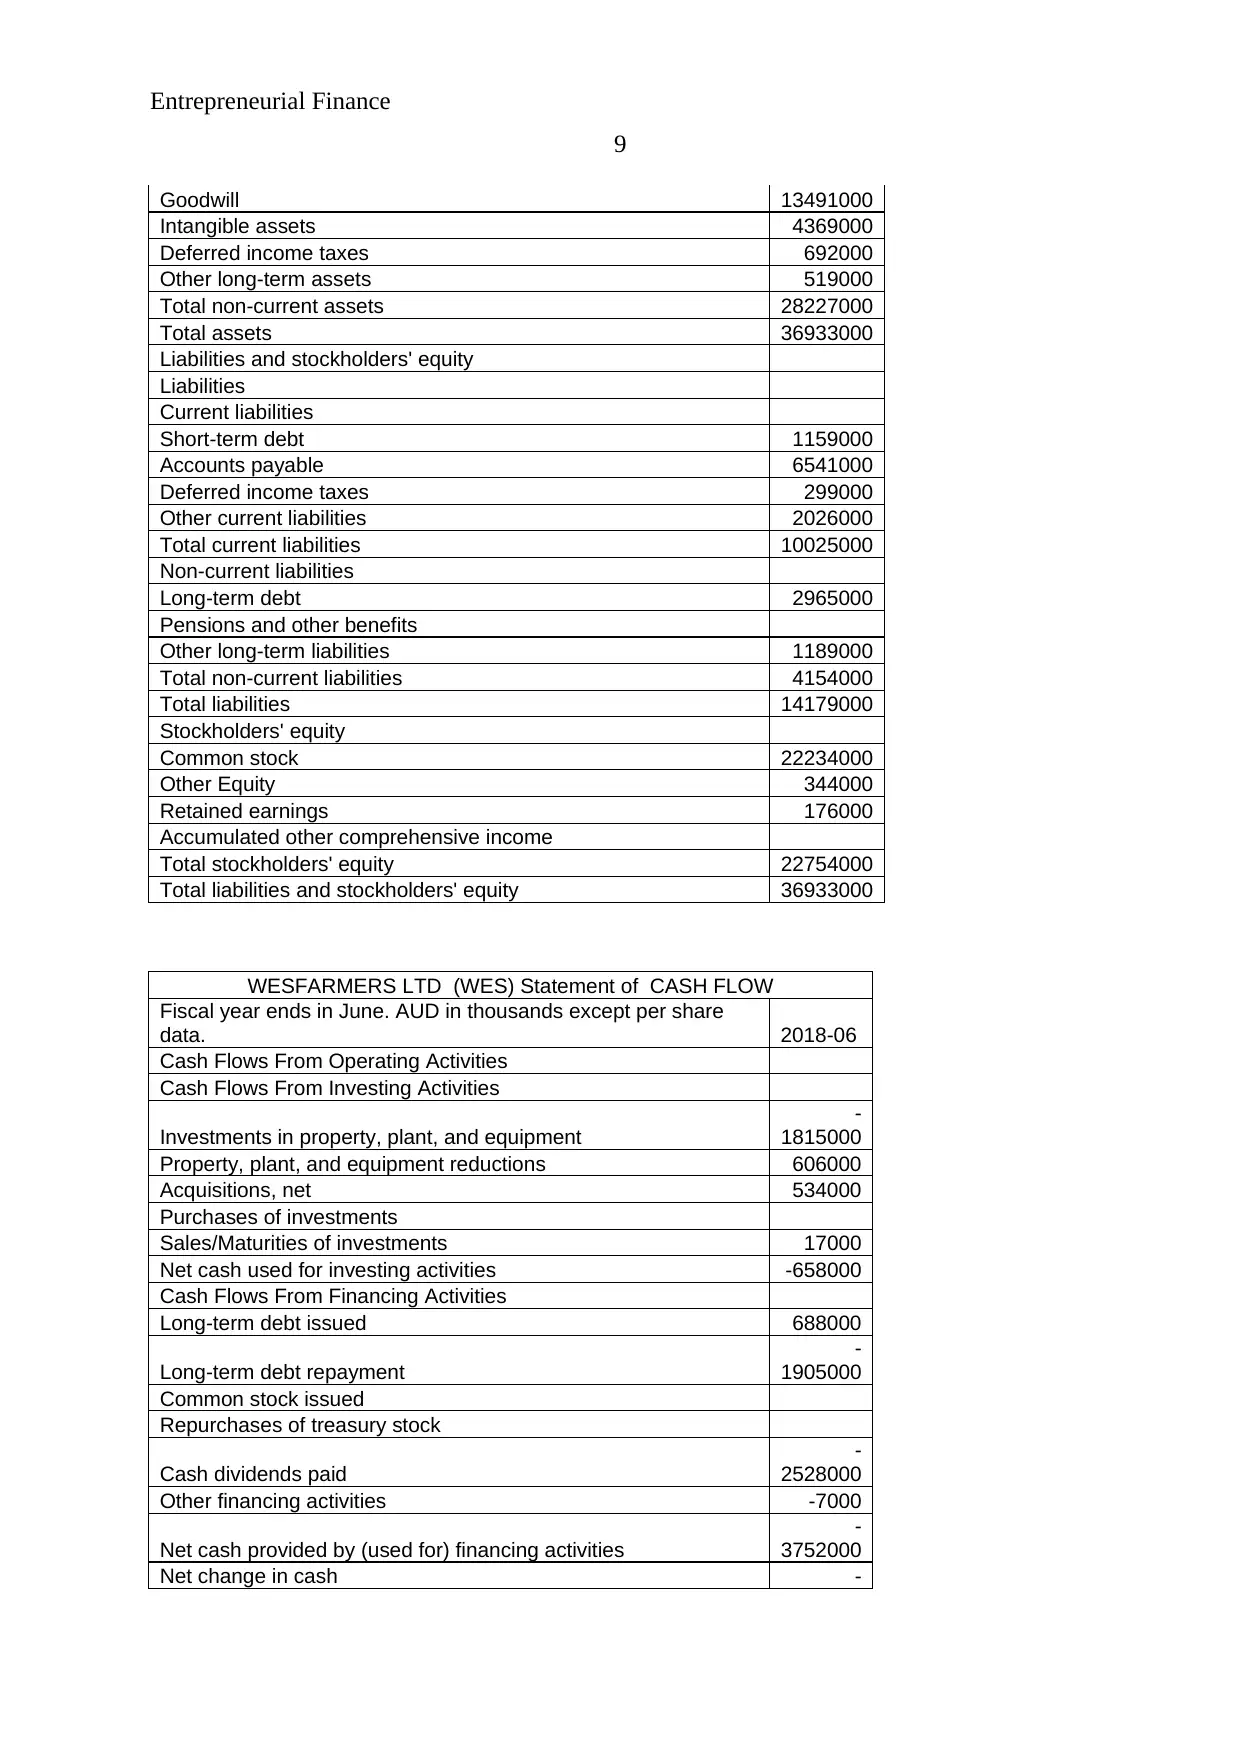
Goodwill 13491000
Intangible assets 4369000
Deferred income taxes 692000
Other long-term assets 519000
Total non-current assets 28227000
Total assets 36933000
Liabilities and stockholders' equity
Liabilities
Current liabilities
Short-term debt 1159000
Accounts payable 6541000
Deferred income taxes 299000
Other current liabilities 2026000
Total current liabilities 10025000
Non-current liabilities
Long-term debt 2965000
Pensions and other benefits
Other long-term liabilities 1189000
Total non-current liabilities 4154000
Total liabilities 14179000
Stockholders' equity
Common stock 22234000
Other Equity 344000
Retained earnings 176000
Accumulated other comprehensive income
Total stockholders' equity 22754000
Total liabilities and stockholders' equity 36933000
WESFARMERS LTD (WES) Statement of CASH FLOW
Fiscal year ends in June. AUD in thousands except per share
data. 2018-06
Cash Flows From Operating Activities
Cash Flows From Investing Activities
Investments in property, plant, and equipment
-
1815000
Property, plant, and equipment reductions 606000
Acquisitions, net 534000
Purchases of investments
Sales/Maturities of investments 17000
Net cash used for investing activities -658000
Cash Flows From Financing Activities
Long-term debt issued 688000
Long-term debt repayment
-
1905000
Common stock issued
Repurchases of treasury stock
Cash dividends paid
-
2528000
Other financing activities -7000
Net cash provided by (used for) financing activities
-
3752000
Net change in cash -
9
Goodwill 13491000
Intangible assets 4369000
Deferred income taxes 692000
Other long-term assets 519000
Total non-current assets 28227000
Total assets 36933000
Liabilities and stockholders' equity
Liabilities
Current liabilities
Short-term debt 1159000
Accounts payable 6541000
Deferred income taxes 299000
Other current liabilities 2026000
Total current liabilities 10025000
Non-current liabilities
Long-term debt 2965000
Pensions and other benefits
Other long-term liabilities 1189000
Total non-current liabilities 4154000
Total liabilities 14179000
Stockholders' equity
Common stock 22234000
Other Equity 344000
Retained earnings 176000
Accumulated other comprehensive income
Total stockholders' equity 22754000
Total liabilities and stockholders' equity 36933000
WESFARMERS LTD (WES) Statement of CASH FLOW
Fiscal year ends in June. AUD in thousands except per share
data. 2018-06
Cash Flows From Operating Activities
Cash Flows From Investing Activities
Investments in property, plant, and equipment
-
1815000
Property, plant, and equipment reductions 606000
Acquisitions, net 534000
Purchases of investments
Sales/Maturities of investments 17000
Net cash used for investing activities -658000
Cash Flows From Financing Activities
Long-term debt issued 688000
Long-term debt repayment
-
1905000
Common stock issued
Repurchases of treasury stock
Cash dividends paid
-
2528000
Other financing activities -7000
Net cash provided by (used for) financing activities
-
3752000
Net change in cash -
⊘ This is a preview!⊘
Do you want full access?
Subscribe today to unlock all pages.
Trusted by 1+ million students worldwide
Entrepreneurial Finance
10
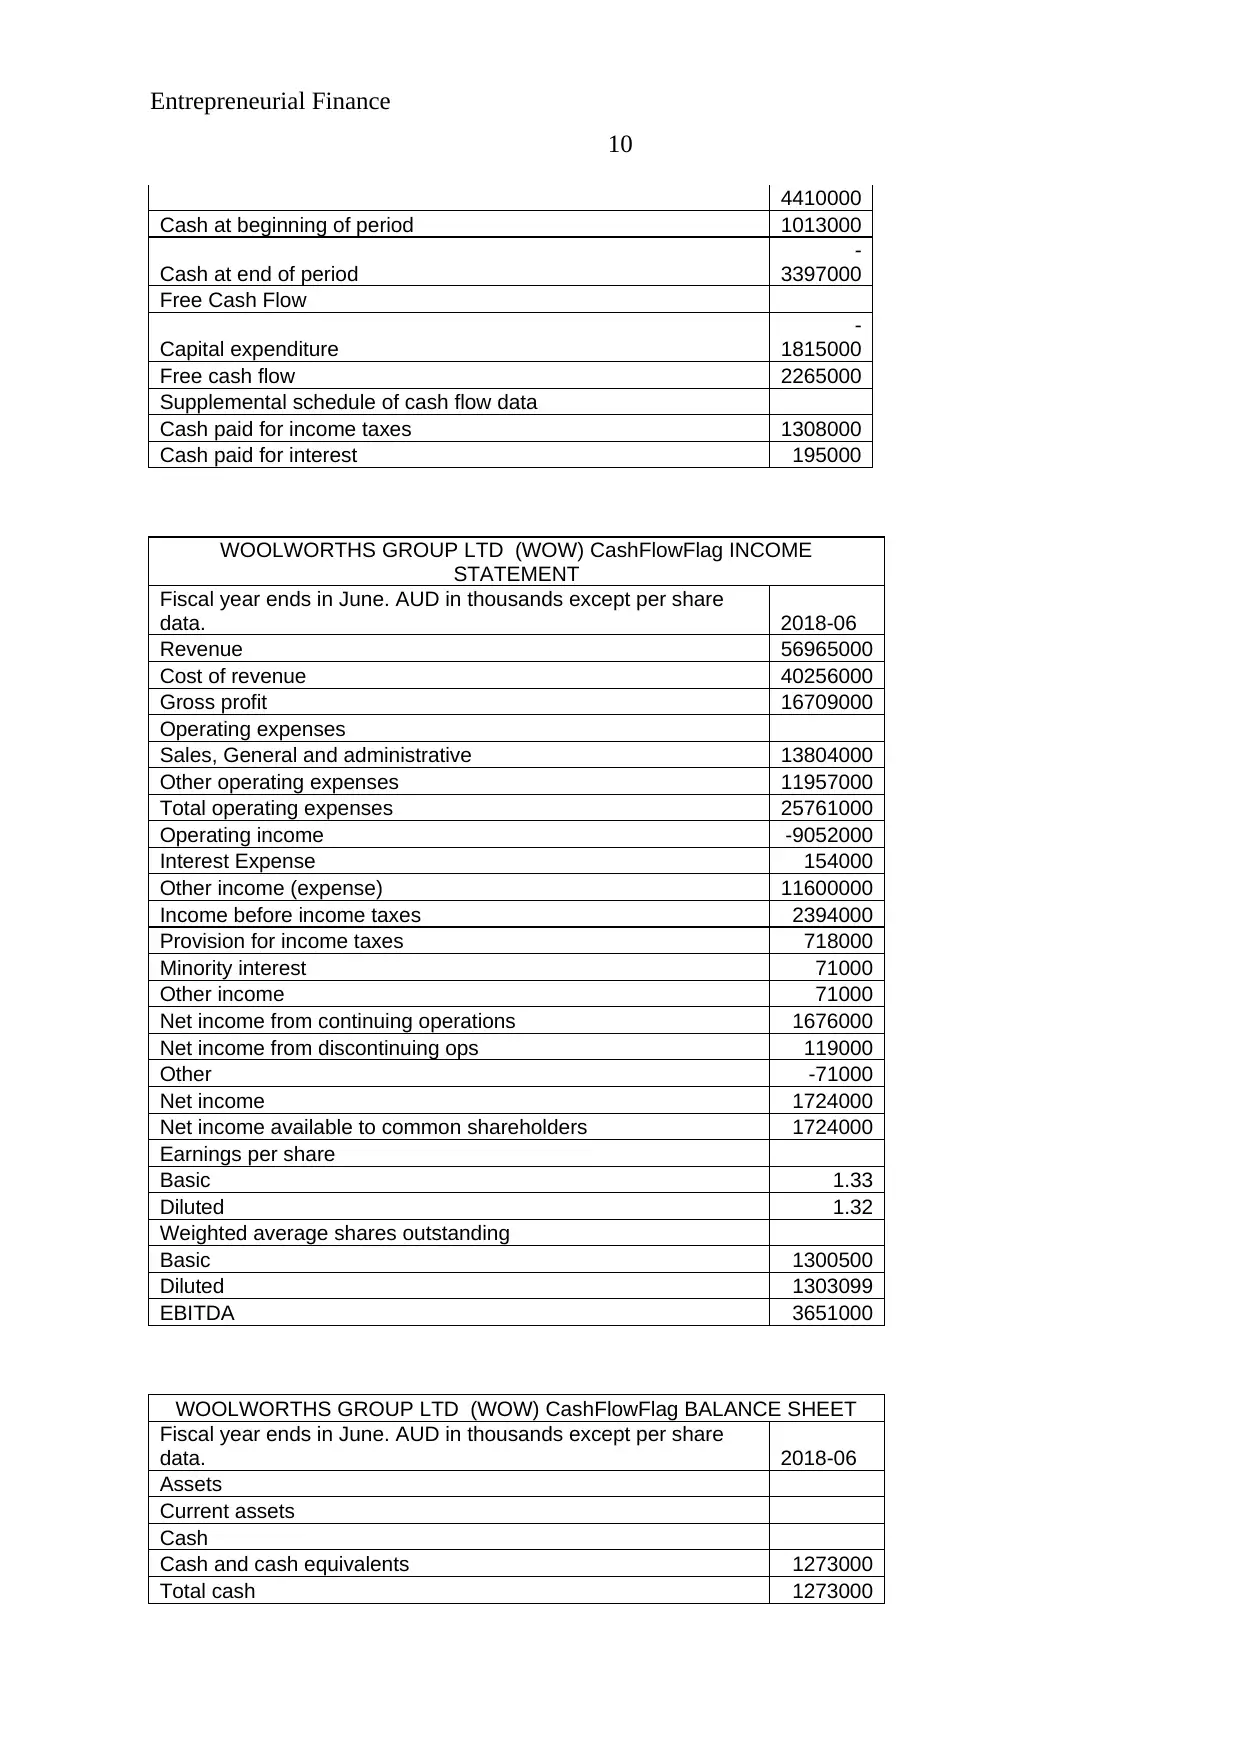
4410000
Cash at beginning of period 1013000
Cash at end of period
-
3397000
Free Cash Flow
Capital expenditure
-
1815000
Free cash flow 2265000
Supplemental schedule of cash flow data
Cash paid for income taxes 1308000
Cash paid for interest 195000
WOOLWORTHS GROUP LTD (WOW) CashFlowFlag INCOME
STATEMENT
Fiscal year ends in June. AUD in thousands except per share
data. 2018-06
Revenue 56965000
Cost of revenue 40256000
Gross profit 16709000
Operating expenses
Sales, General and administrative 13804000
Other operating expenses 11957000
Total operating expenses 25761000
Operating income -9052000
Interest Expense 154000
Other income (expense) 11600000
Income before income taxes 2394000
Provision for income taxes 718000
Minority interest 71000
Other income 71000
Net income from continuing operations 1676000
Net income from discontinuing ops 119000
Other -71000
Net income 1724000
Net income available to common shareholders 1724000
Earnings per share
Basic 1.33
Diluted 1.32
Weighted average shares outstanding
Basic 1300500
Diluted 1303099
EBITDA 3651000
WOOLWORTHS GROUP LTD (WOW) CashFlowFlag BALANCE SHEET
Fiscal year ends in June. AUD in thousands except per share
data. 2018-06
Assets
Current assets
Cash
Cash and cash equivalents 1273000
Total cash 1273000
10
4410000
Cash at beginning of period 1013000
Cash at end of period
-
3397000
Free Cash Flow
Capital expenditure
-
1815000
Free cash flow 2265000
Supplemental schedule of cash flow data
Cash paid for income taxes 1308000
Cash paid for interest 195000
WOOLWORTHS GROUP LTD (WOW) CashFlowFlag INCOME
STATEMENT
Fiscal year ends in June. AUD in thousands except per share
data. 2018-06
Revenue 56965000
Cost of revenue 40256000
Gross profit 16709000
Operating expenses
Sales, General and administrative 13804000
Other operating expenses 11957000
Total operating expenses 25761000
Operating income -9052000
Interest Expense 154000
Other income (expense) 11600000
Income before income taxes 2394000
Provision for income taxes 718000
Minority interest 71000
Other income 71000
Net income from continuing operations 1676000
Net income from discontinuing ops 119000
Other -71000
Net income 1724000
Net income available to common shareholders 1724000
Earnings per share
Basic 1.33
Diluted 1.32
Weighted average shares outstanding
Basic 1300500
Diluted 1303099
EBITDA 3651000
WOOLWORTHS GROUP LTD (WOW) CashFlowFlag BALANCE SHEET
Fiscal year ends in June. AUD in thousands except per share
data. 2018-06
Assets
Current assets
Cash
Cash and cash equivalents 1273000
Total cash 1273000
Paraphrase This Document
Need a fresh take? Get an instant paraphrase of this document with our AI Paraphraser
Entrepreneurial Finance
11
Receivables 420000
Inventories 4233000
Prepaid expenses 381000
Other current assets 874000
Total current assets 7181000
Non-current assets
Property, plant and equipment
Land 1335000
Fixtures and equipment 9870000
Other properties 3540000
Property and equipment, at cost 14745000
Accumulated Depreciation -5719000
Property, plant and equipment, net 9026000
Equity and other investments 156000
Goodwill 4155000
Intangible assets 2310000
Deferred income taxes 271000
Other long-term assets 459000
Total non-current assets 16377000
Total assets 23558000
Liabilities and stockholders' equity
Liabilities
Current liabilities
Short-term debt 604000
Capital leases
Accounts payable 5316000
Deferred income taxes 110000
Other current liabilities 3166000
Total current liabilities 9196000
Non-current liabilities
Long-term debt 2199000
Capital leases
Pensions and other benefits 100000
Minority interest 368000
Other long-term liabilities 1214000
Total non-current liabilities 3881000
Total liabilities 13077000
Stockholders' equity
Common stock 6055000
Other Equity 278000
Retained earnings 4073000
Accumulated other comprehensive income 75000
Total stockholders' equity 10481000
Total liabilities and stockholders' equity 23558000
WOOLWORTHS GROUP LTD (WOW) Statement of CASH FLOW
Fiscal year ends in June. AUD in thousands except per share
data. 2018-06
Cash Flows From Operating Activities
Cash Flows From Investing Activities
Investments in property, plant, and equipment
-
1848000
Entrepreneurial Finance
12
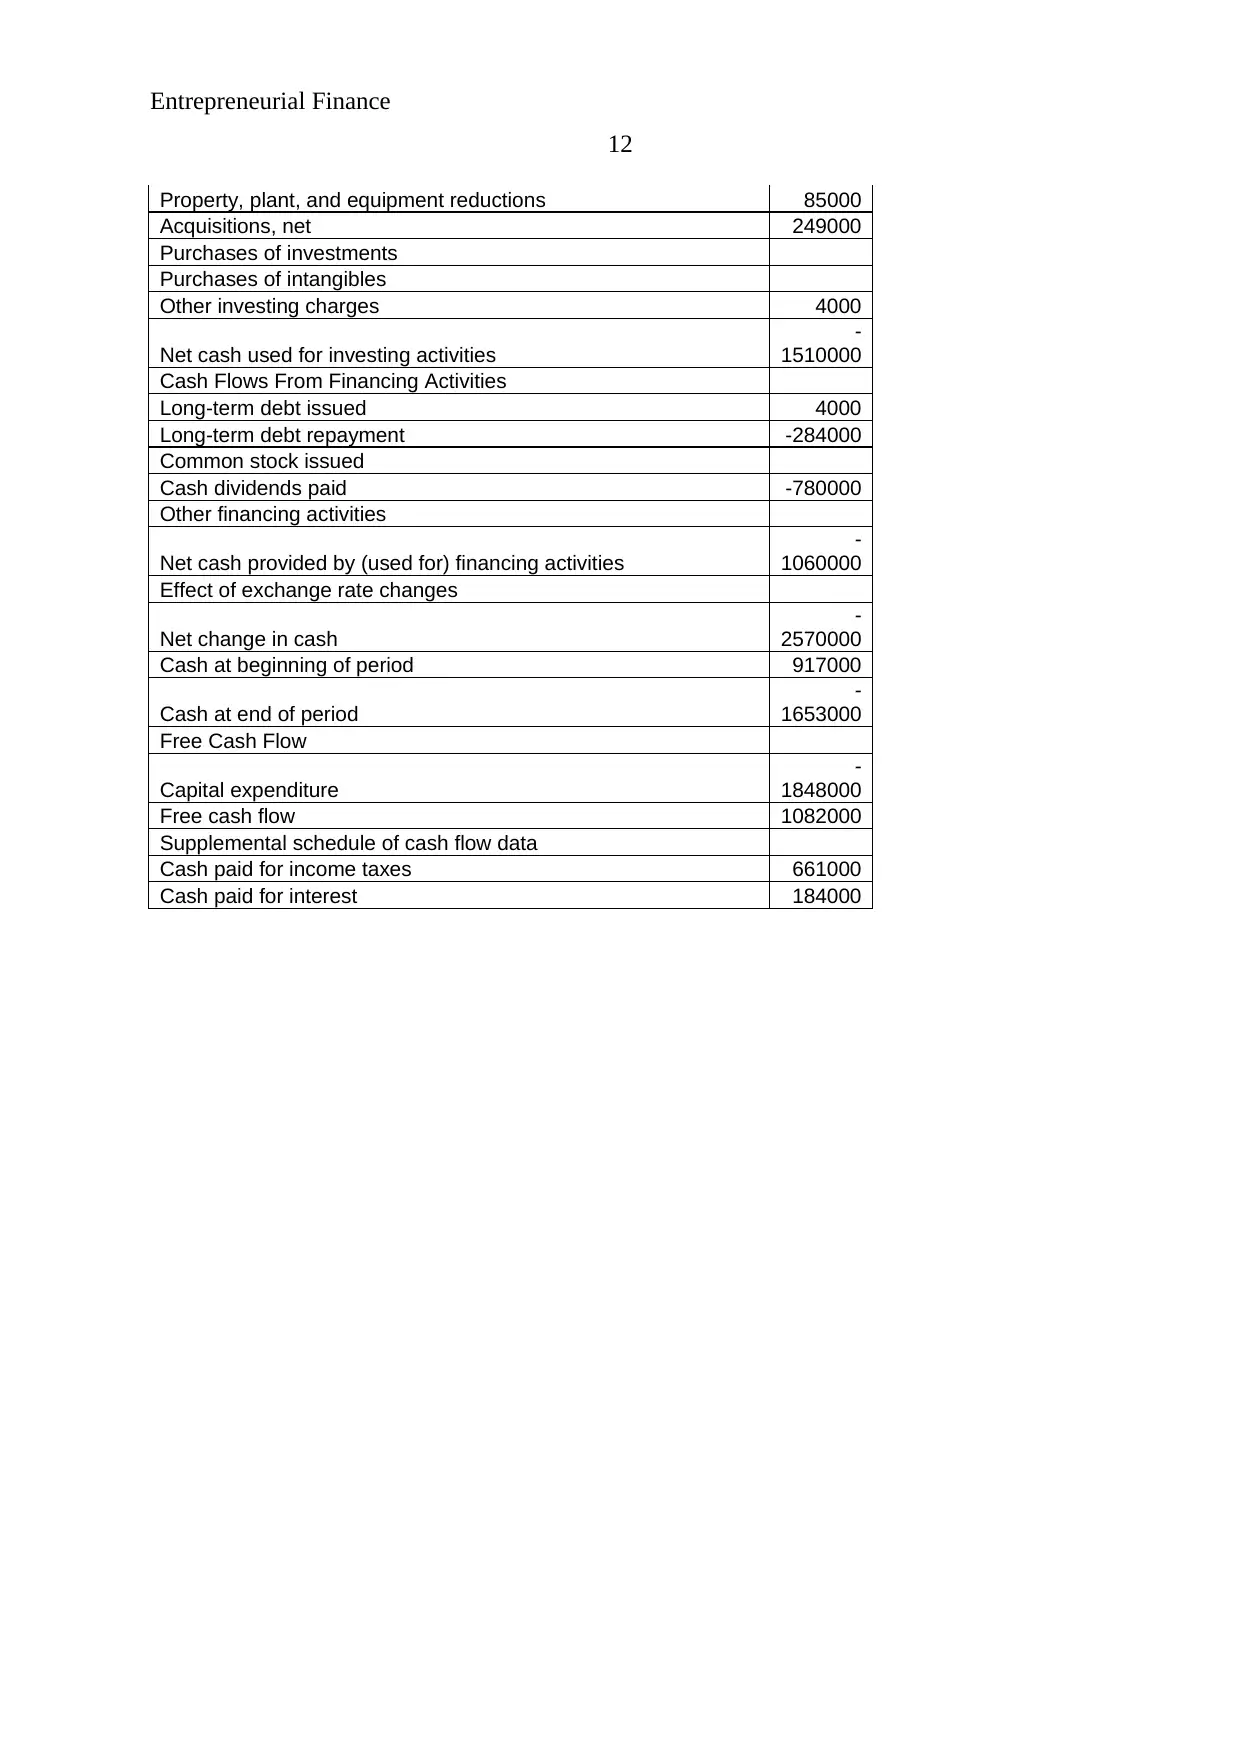
Property, plant, and equipment reductions 85000
Acquisitions, net 249000
Purchases of investments
Purchases of intangibles
Other investing charges 4000
Net cash used for investing activities
-
1510000
Cash Flows From Financing Activities
Long-term debt issued 4000
Long-term debt repayment -284000
Common stock issued
Cash dividends paid -780000
Other financing activities
Net cash provided by (used for) financing activities
-
1060000
Effect of exchange rate changes
Net change in cash
-
2570000
Cash at beginning of period 917000
Cash at end of period
-
1653000
Free Cash Flow
Capital expenditure
-
1848000
Free cash flow 1082000
Supplemental schedule of cash flow data
Cash paid for income taxes 661000
Cash paid for interest 184000
12
Property, plant, and equipment reductions 85000
Acquisitions, net 249000
Purchases of investments
Purchases of intangibles
Other investing charges 4000
Net cash used for investing activities
-
1510000
Cash Flows From Financing Activities
Long-term debt issued 4000
Long-term debt repayment -284000
Common stock issued
Cash dividends paid -780000
Other financing activities
Net cash provided by (used for) financing activities
-
1060000
Effect of exchange rate changes
Net change in cash
-
2570000
Cash at beginning of period 917000
Cash at end of period
-
1653000
Free Cash Flow
Capital expenditure
-
1848000
Free cash flow 1082000
Supplemental schedule of cash flow data
Cash paid for income taxes 661000
Cash paid for interest 184000
⊘ This is a preview!⊘
Do you want full access?
Subscribe today to unlock all pages.
Trusted by 1+ million students worldwide
1 out of 12
Related Documents


Your All-in-One AI-Powered Toolkit for Academic Success.
+13062052269
info@desklib.com
Available 24*7 on WhatsApp / Email
![[object Object]](/_next/static/media/star-bottom.7253800d.svg)
Unlock your academic potential
Copyright © 2020–2026 A2Z Services. All Rights Reserved. Developed and managed by ZUCOL.