ITECH7406: Environmental Issues and BI Reporting Solution
VerifiedAdded on 2023/03/31
|17
|2322
|480
Report
AI Summary
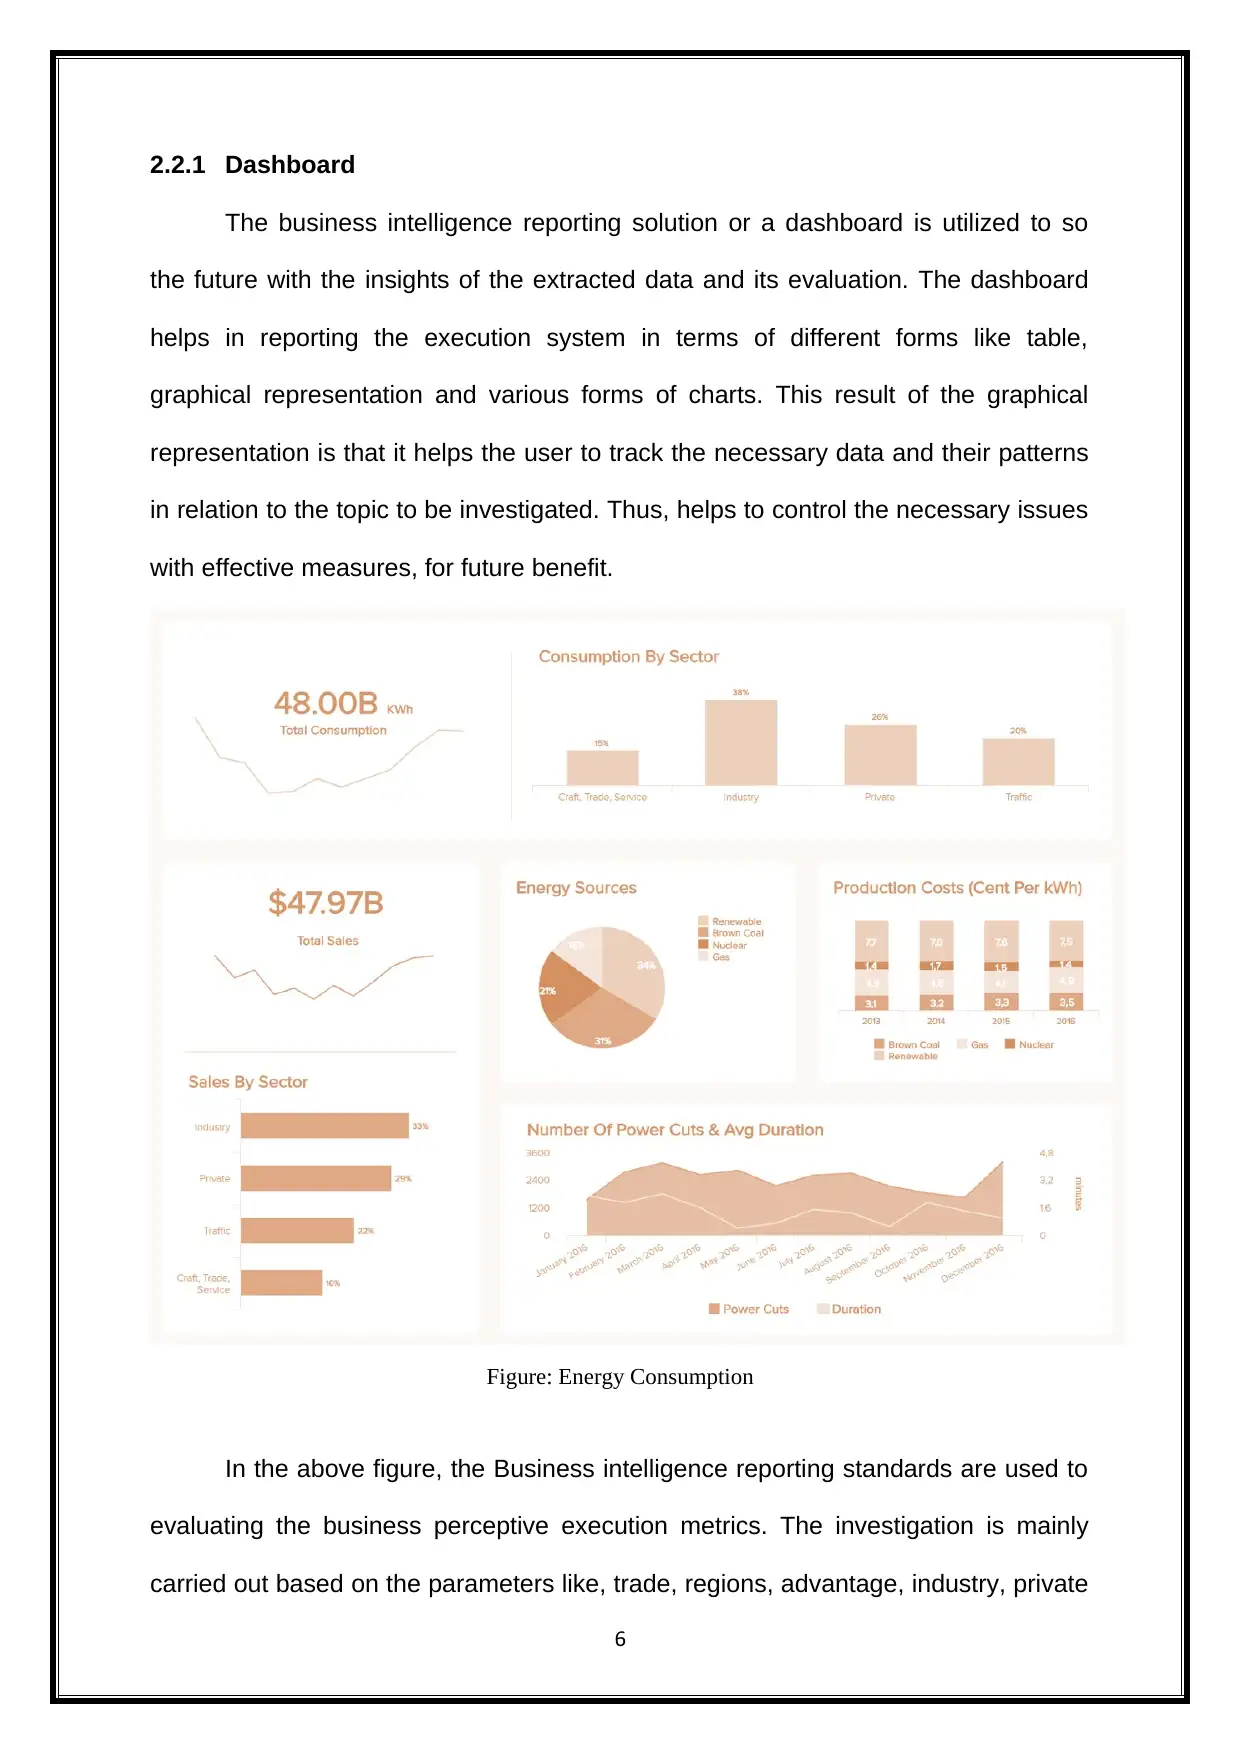
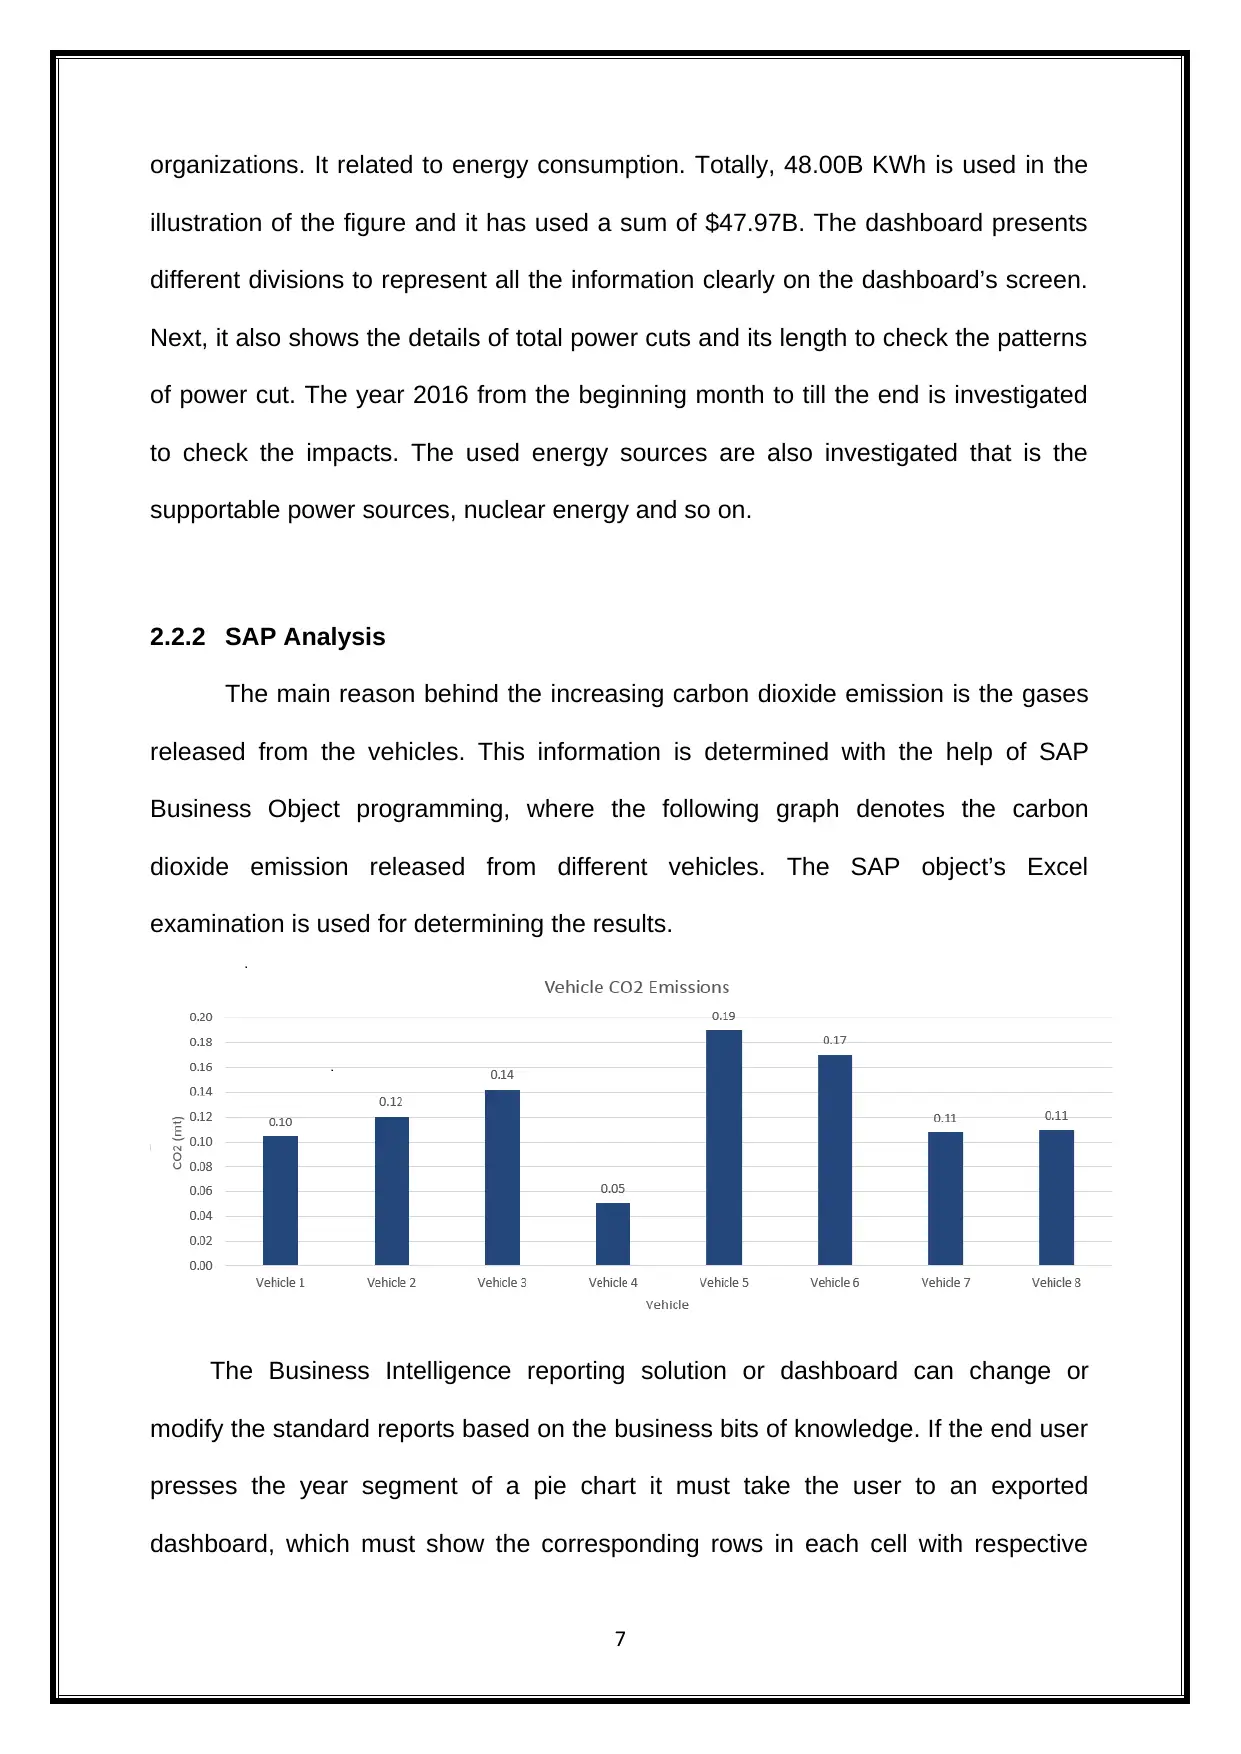
This report provides an executive summary of a business intelligence (BI) project focused on environmental issues. The project utilizes SAP Analytics tools to explore, extract, and analyze enterprise data related to climate change, carbon footprint, energy consumption, and other environmental concerns. The report discusses the application of descriptive and prescriptive analytics, showcasing the use of dashboards and SAP analysis for data visualization and predictive modeling. A real-world dataset is used to illustrate the approach, with a design model for a mobile application using a QSR code. The report justifies the BI reporting solution, highlighting its benefits in data visualization, analysis, and decision-making. The report also includes sections on background environmental issues, BI reporting solutions, dashboard prototypes, and a conclusion summarizing the findings. The report aims to generate innovative analytics solutions and provide practical experience in using SAP Business Objects/Predictive Analytics for environmental data analysis.

Environmental Issues
Paraphrase This Document
Need a fresh take? Get an instant paraphrase of this document with our AI Paraphraser

Executive Summary
This report talks about the Business intelligence tools. The purpose of this report is
to provide on-hands experiences on utilizing the SAP Analytics tools for the students,
so that they can explore, extract and analyse the provided enterprise data. The topic
to be discussed is environmental issues. The intension of this project is to generate
innovative analytics solutions, with the application of SAP Business Object/Predictive
Analytics to design a visualization solution and a predictive model for environment
such as climate change, carbon footprint, energy consumption, greenhouse gas
emission, pollution dashboard, and so on. A real-world dataset is used for illustrating
the used approach. The usage of dashboard to support the Earth’s environmental
issues is presented. A discussion on descriptive analysis and Prescriptive analysis is
discussed with a SAP analysis. A design model application is developed. Suggestion
to resolve environmental issues are presented depending on a dashboard analysis.
Finally, justification for the Business intelligence Reporting solution is provided.

Table of Contents
1. Background of Environmental Issues.................................................................................1
2. Used Business Intelligence Reporting Solution...............................................................1
2.1 Descriptive Analysis........................................................................................................2
2.1.1 Dashboard..................................................................................................................2
2.1.2 SAP Analysis..............................................................................................................4
2.2 Prescriptive Analysis.......................................................................................................5
2.2.1 Dashboard..................................................................................................................6
2.2.2 SAP Analysis..............................................................................................................7
2.3 Dashboard’s Prototype....................................................................................................8
3. Design Mobile application using QSR code.......................................................................9
4. Justification of BI Reporting Solution/Dashboards.......................................................11
5. Conclusion...............................................................................................................................13
References.......................................................................................................................................14
⊘ This is a preview!⊘
Do you want full access?
Subscribe today to unlock all pages.

Trusted by 1+ million students worldwide

1. Background of Environmental Issues
The environmental issues are discussed to see the level of environmental
harm to the earth which results in global warming. CO2 emission is considered as the
primary reason to face global warming. Thus, it is very important to control global
warming to save our planet Earth.
Some of the gases that are released into the atmosphere includes, carbon
dioxide is released when the fossil fuels are burnt along with other greenhouse
gases are also released. The gases released form the vehicles also contribute to air
pollution and all these emissions increases climate change, ozone layer depletion
and results in global warming. The environment at present is highly vulnerable to
these emissions, as it leads to calamities and serious threat to human life of earth.
The case of Turkey is considered as an example where there is high need to
decrease the greenhouse gas emissions for controlling the climate changes (Yüksel
& Sandalci, 2011)
Hence, it is important to find solutions to stop these greenhouse gases. This
research demands identification of potential environmental issues, which impacts on
electricity supply. This report’s investigation uses the analytic tools to provide best
solution to the identified environmental issues, including on energy consumption
aspects.
2. Used Business Intelligence Reporting Solution
This section discusses about the Business Intelligence reporting
solution/dashboards that are used to develop for environmental dataset. The two
types of analytics are:
1
Paraphrase This Document
Need a fresh take? Get an instant paraphrase of this document with our AI Paraphraser

1) Descriptive analytics
2) Prescriptive analytics
2.1 Descriptive Analysis
It is a basic analytics form, so almost ninety percent of the organizations
utilize this type of analytics. It helps to get answers to question like, “What has
happened?”
It mainly intends to find the real reason behind the past success or failure by
utilizing real-time and historical data, to get useful insights. Google Analytics tools can
be considered as the best example for descriptive analytics ("Types of Analytics:
descriptive, predictive, prescriptive analytics", 2018).
Figure: Descriptive Analytics ("Types of Analytics: descriptive, predictive,
prescriptive analytics", 2018)
2.1.1 Dashboard
A dashboard allows to view the metrics of data in an understandable form.
Dashboards can be customized based on the user’s preferences for various
purposes. The below figure displays a dashboard to show the energy consumption
by a specific building in a particular area.
2

The above illustrated figure shows the display screen of a dashboard. It is
viewed that "Zion Dado Building” is targeted which is present in the United States of
America, for energy consumption analysis. Respectively, the dashboard shows
3
viewed that "Zion Dado Building” is targeted which is present in the United States of
America, for energy consumption analysis. Respectively, the dashboard shows
3
⊘ This is a preview!⊘
Do you want full access?
Subscribe today to unlock all pages.

Trusted by 1+ million students worldwide

several elements such as benchmarking, energy consumption based on months,
present and past electricity use in the building and the normal temperature of the
building. The time variation is taken to evaluate the use of electricity, for instance
between 7 am to 8 am and 6 am to 10 pm. The benchmarking is supported to
determine the results.
2.1.2 SAP Analysis
The SAP analysis intends to conduct various roles like management,
Information Technology, and so on. This analysis ensures to check the emission of
CO2 in a particular period to seen the pattern and determine the results. The below
mentioned figure depicts the values estimated from the year 2012 to 2016. SAP
evolution is used for this estimation. The dataset uses the bits of knowledge for
outlining the important points with the assistance of SAP business Object’s Excel
records.
4
Paraphrase This Document
Need a fresh take? Get an instant paraphrase of this document with our AI Paraphraser

During the year 2013, the CO2 is estimated as 545 kilotons, whereas in 2014 it
was seen to decrease by 45 kilotons (i.e., 500 kilotons) and it continued to decrease
even in 2015 (i.e., 455 kilotons) and in 2016 (i.e., 380 kilotons).
The bits of knowledge requires illustrative investigation such as midpoints,
rate changes and so on.
2.2 Prescriptive Analysis
It is a business analytics for identifying the best action for a provided
circumstance, from a set of choices (Tucci & Rouse, 2012). It is a type of analytics
which intends to identify the problems prior to their occurrence. ("Predictive Analytics
vs. Prescriptive Analytics: What Is the Difference?", 2018). It follows an improved
analytics concept which includes the following ("Types of Analytics: descriptive,
predictive, prescriptive analytics", 2018):
a) Optimization ensures to accomplish the best results.
b) It uses stochastic optimization which supports in understanding how
best result can be achieved and it finds data uncertainties for making
better decisions.
It is a mix of mathematical models, data, and several business rules. It uses
both the internal and external data. However, when compared to other analytics it is
a complicated one which is the reason that it is not used by most of the businesses
foe their daily business activities. The reason behind this is management difficulty.
But, the large scale organizations use it for scheduling and optimizing ("Types of
Analytics: descriptive, predictive, prescriptive analytics", 2018).
5

2.2.1 Dashboard
The business intelligence reporting solution or a dashboard is utilized to so
the future with the insights of the extracted data and its evaluation. The dashboard
helps in reporting the execution system in terms of different forms like table,
graphical representation and various forms of charts. This result of the graphical
representation is that it helps the user to track the necessary data and their patterns
in relation to the topic to be investigated. Thus, helps to control the necessary issues
with effective measures, for future benefit.
Figure: Energy Consumption
In the above figure, the Business intelligence reporting standards are used to
evaluating the business perceptive execution metrics. The investigation is mainly
carried out based on the parameters like, trade, regions, advantage, industry, private
6
⊘ This is a preview!⊘
Do you want full access?
Subscribe today to unlock all pages.

Trusted by 1+ million students worldwide

organizations. It related to energy consumption. Totally, 48.00B KWh is used in the
illustration of the figure and it has used a sum of $47.97B. The dashboard presents
different divisions to represent all the information clearly on the dashboard’s screen.
Next, it also shows the details of total power cuts and its length to check the patterns
of power cut. The year 2016 from the beginning month to till the end is investigated
to check the impacts. The used energy sources are also investigated that is the
supportable power sources, nuclear energy and so on.
2.2.2 SAP Analysis
The main reason behind the increasing carbon dioxide emission is the gases
released from the vehicles. This information is determined with the help of SAP
Business Object programming, where the following graph denotes the carbon
dioxide emission released from different vehicles. The SAP object’s Excel
examination is used for determining the results.
The Business Intelligence reporting solution or dashboard can change or
modify the standard reports based on the business bits of knowledge. If the end user
presses the year segment of a pie chart it must take the user to an exported
dashboard, which must show the corresponding rows in each cell with respective
7
Paraphrase This Document
Need a fresh take? Get an instant paraphrase of this document with our AI Paraphraser

source data that is copied back to the respective location. The pie chart gets
dynamically updated for displaying the data in the respective location. It is an
effective method to use as it helps in clearly understanding and also shows the
updated data for a selected year. The SAP dashboards are designed easily with an
impressive dashboard design which has various interactive tables, charts, and
configurable sections. With the completion of the dashboard design, the interactive
dashboard could be published in various formats to be shared with various
departments in an organization. It mainly helps with proving insights and executes
the results accurately. It has the capacity of effectively tracking the data, which can
benefit in ensuring security checks along with response quality.
2.3 Dashboard’s Prototype
The design model of a dashboard is developed. This section presents some
of the characteristics of a dashboard. The following are some of the important
features of a dashboard:
1) It is well-known for graphical representation of data.
2) It is compatible with various devices.
3) It helps to manage the data.
4) It facilities to easily understand the data.
5) It helps in tracking the information.
6) It shows the patterns of the data being investigated.
7) It can be used for executing daily, weekly, monthly, quarterly and
yearly data.
8) It comprises of key execution markers.
8

The created dashboard shows the following features:
A. It shows a bar outline.
B. It has different sections to represent data.
C. It shows calendar whenever needed.
D. It inspects the data by filtration process (The data here is filtered based
on the country, date, state and city.).
E. Using the square feet unit, the area of a site is viewed.
F. The details of the site are provided like, location, city, country and
region.
G. The energy usage is evaluated.
H. It provided benchmarks.
I. It shows monthly based energy usage and building temperature data.
J. The territory’s atmosphere status is provided.
K. Kilowatt hour (Kwh) is used to calculate energy usage.
L. It allows picking the required key markers.
M. The atmosphere conditions are shown irrespective of time.
N. The real-time data is used.
O. The necessary information is shared with compatible devices.
3. Design Mobile application using QSR code
With the use of QSR code a mobile application is designed. This design
illustrates the environmental issues. The Predictive analytics application is used.
9
⊘ This is a preview!⊘
Do you want full access?
Subscribe today to unlock all pages.

Trusted by 1+ million students worldwide
1 out of 17
Related Documents

Your All-in-One AI-Powered Toolkit for Academic Success.
+13062052269
info@desklib.com
Available 24*7 on WhatsApp / Email
Unlock your academic potential
Copyright © 2020–2025 A2Z Services. All Rights Reserved. Developed and managed by ZUCOL.