Environmental Management: Quantitative Methods Assignment 3 Analysis
VerifiedAdded on 2022/10/02
|9
|1996
|423
Homework Assignment
AI Summary
This assignment analyzes the economic value of a potential Marine Protected Area (MPA) in Hokkaido, Japan, using the contingent valuation (CV) method. The study utilizes data collected by the Ministry of Environment, including variables such as age, income, and willingness to pay (WTP) bids. The analysis employs both single-bounded dichotomous choice (SBDC) and double-bounded dichotomous choice (DBDC) models to estimate WTP. The results indicate that as the bid value increases, the proportion of people willing to pay decreases. The SBDC model yielded a median WTP of 22.86 yens, while the DBDC model, which incorporated follow-up questions, resulted in a median WTP of 11.83 yens. The findings suggest that older individuals and females exhibited lower WTP, highlighting the need for targeted sensitization to enhance their support for the MPA.
1
Name:
Student No.:
Unit: Quantitative Methods in Environmental Management 2267
Assessment: Assignment 3
Statement of honesty
I, , confirm that this assignment represents my own work and that I have
retained a copy of the work, including the script file for the statistical analysis.
Date:
Name:
Student No.:
Unit: Quantitative Methods in Environmental Management 2267
Assessment: Assignment 3
Statement of honesty
I, , confirm that this assignment represents my own work and that I have
retained a copy of the work, including the script file for the statistical analysis.
Date:
Paraphrase This Document
Need a fresh take? Get an instant paraphrase of this document with our AI Paraphraser
2
Introduction
There are no doubts some goods are not traded in the economic markets thus, they do not
have economic value, which makes it challenging during the trading process. However, through
Contingent valuation (CV) the value of the goods or resources is determined (Jones, 2019).
Contingent valuation is a survey-based method utilized in determining the economic value of a
non-market goods, especially the natural and environmental resources. It is evident that the
Ministry of Environment in Japan seeks to establish a new Marine Protected Area (MPA) in
Hokkaido. However, it is essential to evaluate the community’s willingness to pay (WTP) for the
MPA. Therefore, the following study seeks to utilize the contingent valuation technique to assess
the sustainability of developing the new MPA.
Methods
Notably, the ministry collected data that comprised of 7 variables, which include gender,
age, income, WTP value (Bid 1 and Bid 2), and responses to the first and second question (Ans1
and Ans2). Notably, to achieve the main objective, the study will incorporate numerous
statistical techniques and measures. The study will exhibit the structure of the data to show case
the number of observations and variables; besides, the structure will exhibit the variable type.
Since there was a follow-up question the study will use both the single-bounded and double
bounded dichotomous choice question model (Fogarty & Aizaki, 2018). The SBDC questions
have bipolar ends, whereby at the end of the bidding a respondent is asked only one dichotomous
question and the amount is assumed to be the threshold. Thus, in this case if the respondent is
willing to pay for the MAP at a given threshold then he or she will answer “yes” otherwise “no”.
However, it is model is less efficient and requires a larger sample to attain a given level of
precision. Hence, to curb the above challenge the study incorporated the DBDC, which improves
3
the choices by engaging the respondent in two rounds of biddings. For instance, in this case the
respondents will be asked the second question involving a lower amount depending on the first
question. Moreover, the study will include distribution tables to exhibit the distribution of WTP
at different BID values. Consequently, the research will use data visualization techniques to
expose the trend of BID values. Notably, the among the two measures of central tendency
exhibited in the models the study will use the median value as the point estimate.
Results
Data Structure
The primal step in any statistical analysis is to identify the variable names, number of
variables, variable types, and number of observation.
'data.frame': 312 obs. of 7 variables:
$ Age : int 1 2 3 2 6 3 4 3 5 5 ...
$ Income: int 2 3 3 1 1 1 1 2 2 2 ...
$ Bid_1 : int 4 4 4 4 4 4 4 4 4 4 ...
$ Gender: Factor w/ 2 levels "F","M": 1 1 2 2 1 2 1 1 1 1 ...
$ Ans_1 : int 1 1 1 0 0 1 0 1 1 0 ...
$ Ans_2 : int 1 1 1 0 0 0 0 0 1 0 ...
$ Bid_2 : int 10 10 10 2 2 10 2 10 10 2 ...
It is evident that the study incorporated 312 respondents or participants and 7 variables.
Besides, it is evident that apart form Gender, which is factor variable the other variables are
intergers.
Single-Bounded Dichotomous Choice Model (SBDC)
Distribution first WTP value
Bid_1
Ans_1 4 8 16 32
0 26 34 40 41
1 50 43 42 36
The table above shows that there were 4 groups of WTP value, which include 100, 400,
800, 1600, and 3200 yens. Besides, it is evident that the number of people WTP (Yes or 0) tends
⊘ This is a preview!⊘
Do you want full access?
Subscribe today to unlock all pages.
Trusted by 1+ million students worldwide
4
to decrease as the WTP value increases. On the other side, the number of people declining to
declining to pay tend to increase as the WTP value increases. For instance, 76 responses at WTP
value of 400 yen whereby 26 respondents declined to pay, whereas 50 accepted to pay. Besides,
at 800 yens WTP value 40 respondents declined to pay whereas 42 accepted to pay.
Consequently, at 1600 yen Generally, 141 participants ere not willing to pay the first WTP value
whereas 171 accepted to pay.
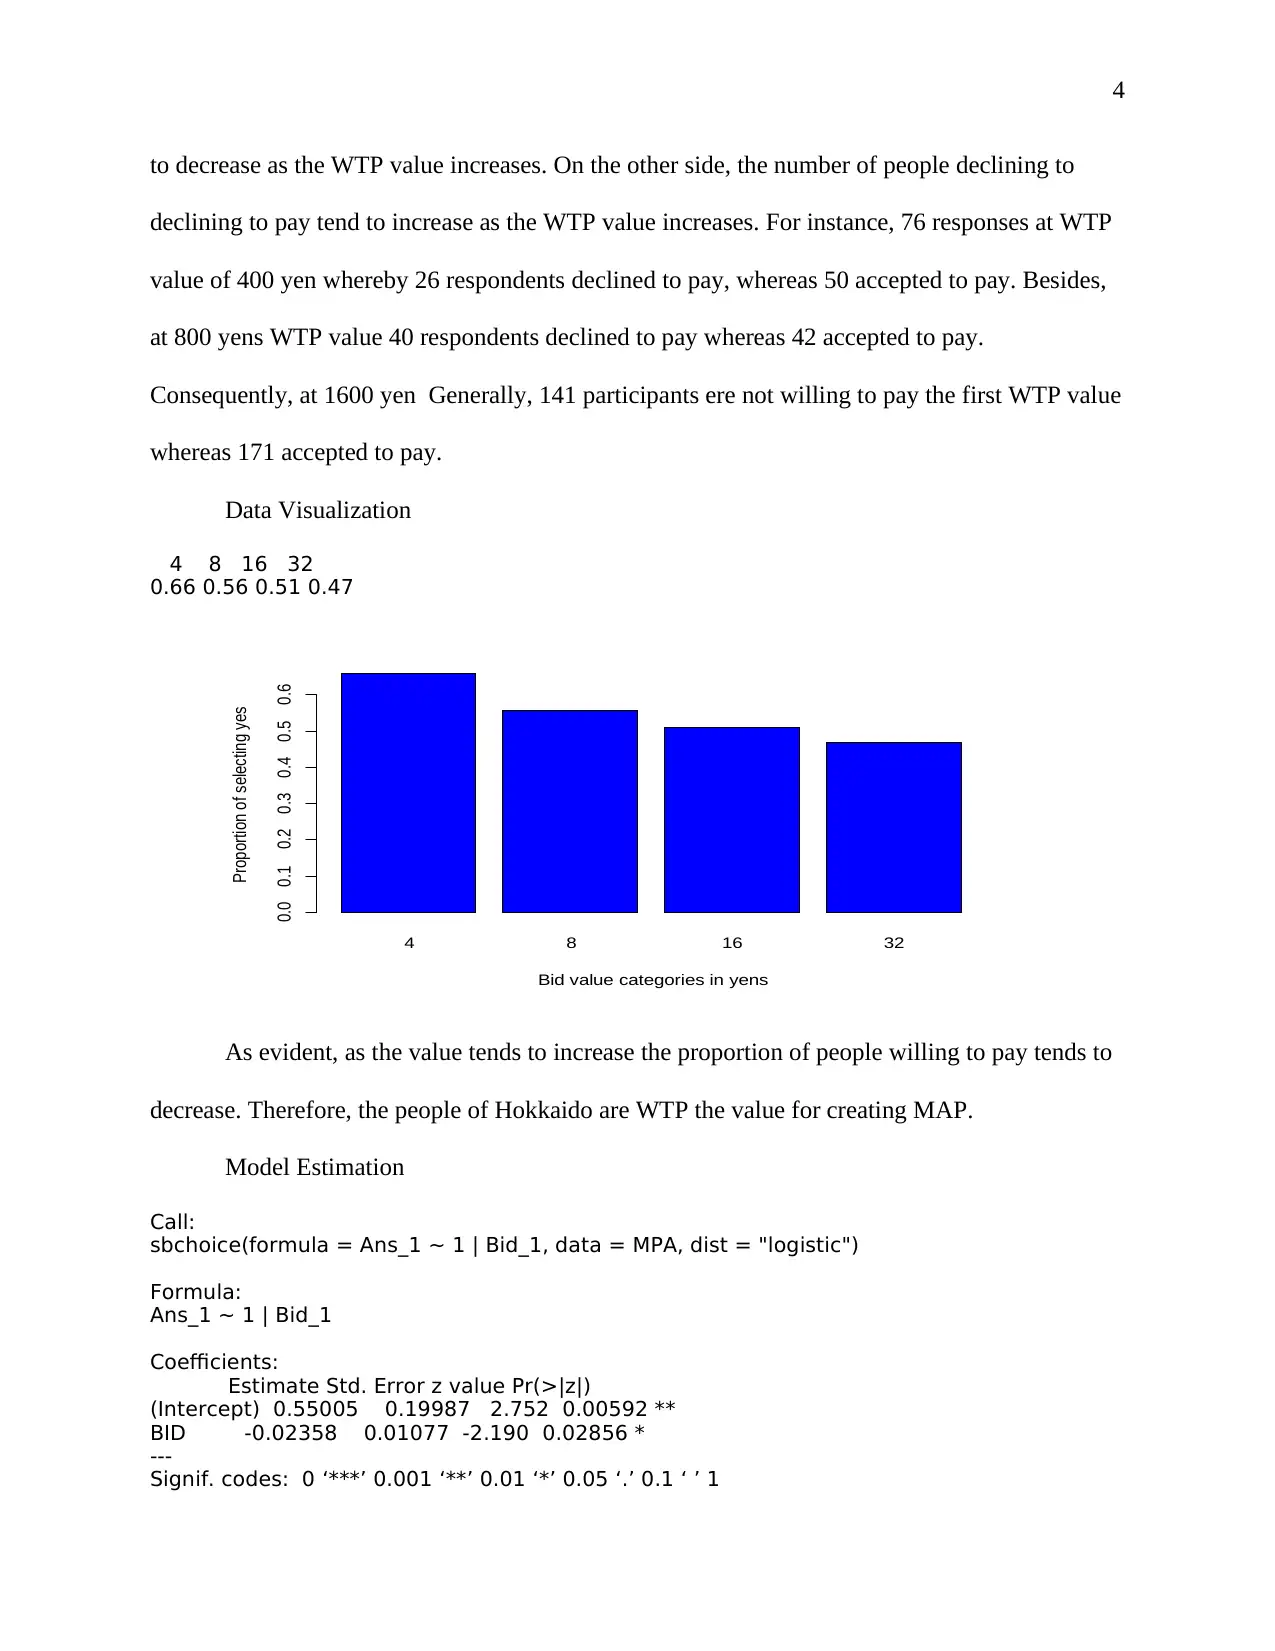
Data Visualization
4 8 16 32
0.66 0.56 0.51 0.47
As evident, as the value tends to increase the proportion of people willing to pay tends to
decrease. Therefore, the people of Hokkaido are WTP the value for creating MAP.
Model Estimation
Call:
sbchoice(formula = Ans_1 ~ 1 | Bid_1, data = MPA, dist = "logistic")
Formula:
Ans_1 ~ 1 | Bid_1
Coefficients:
Estimate Std. Error z value Pr(>|z|)
(Intercept) 0.55005 0.19987 2.752 0.00592 **
BID -0.02358 0.01077 -2.190 0.02856 *
---
Signif. codes: 0 ‘***’ 0.001 ‘**’ 0.01 ‘*’ 0.05 ‘.’ 0.1 ‘ ’ 1
4 8 16 32
Bid value categories in yens
Proportion of selecting yes
0.0 0.1 0.2 0.3 0.4 0.5 0.6
to decrease as the WTP value increases. On the other side, the number of people declining to
declining to pay tend to increase as the WTP value increases. For instance, 76 responses at WTP
value of 400 yen whereby 26 respondents declined to pay, whereas 50 accepted to pay. Besides,
at 800 yens WTP value 40 respondents declined to pay whereas 42 accepted to pay.
Consequently, at 1600 yen Generally, 141 participants ere not willing to pay the first WTP value
whereas 171 accepted to pay.
Data Visualization
4 8 16 32
0.66 0.56 0.51 0.47
As evident, as the value tends to increase the proportion of people willing to pay tends to
decrease. Therefore, the people of Hokkaido are WTP the value for creating MAP.
Model Estimation
Call:
sbchoice(formula = Ans_1 ~ 1 | Bid_1, data = MPA, dist = "logistic")
Formula:
Ans_1 ~ 1 | Bid_1
Coefficients:
Estimate Std. Error z value Pr(>|z|)
(Intercept) 0.55005 0.19987 2.752 0.00592 **
BID -0.02358 0.01077 -2.190 0.02856 *
---
Signif. codes: 0 ‘***’ 0.001 ‘**’ 0.01 ‘*’ 0.05 ‘.’ 0.1 ‘ ’ 1
4 8 16 32
Bid value categories in yens
Proportion of selecting yes
0.0 0.1 0.2 0.3 0.4 0.5 0.6
Paraphrase This Document
Need a fresh take? Get an instant paraphrase of this document with our AI Paraphraser
5
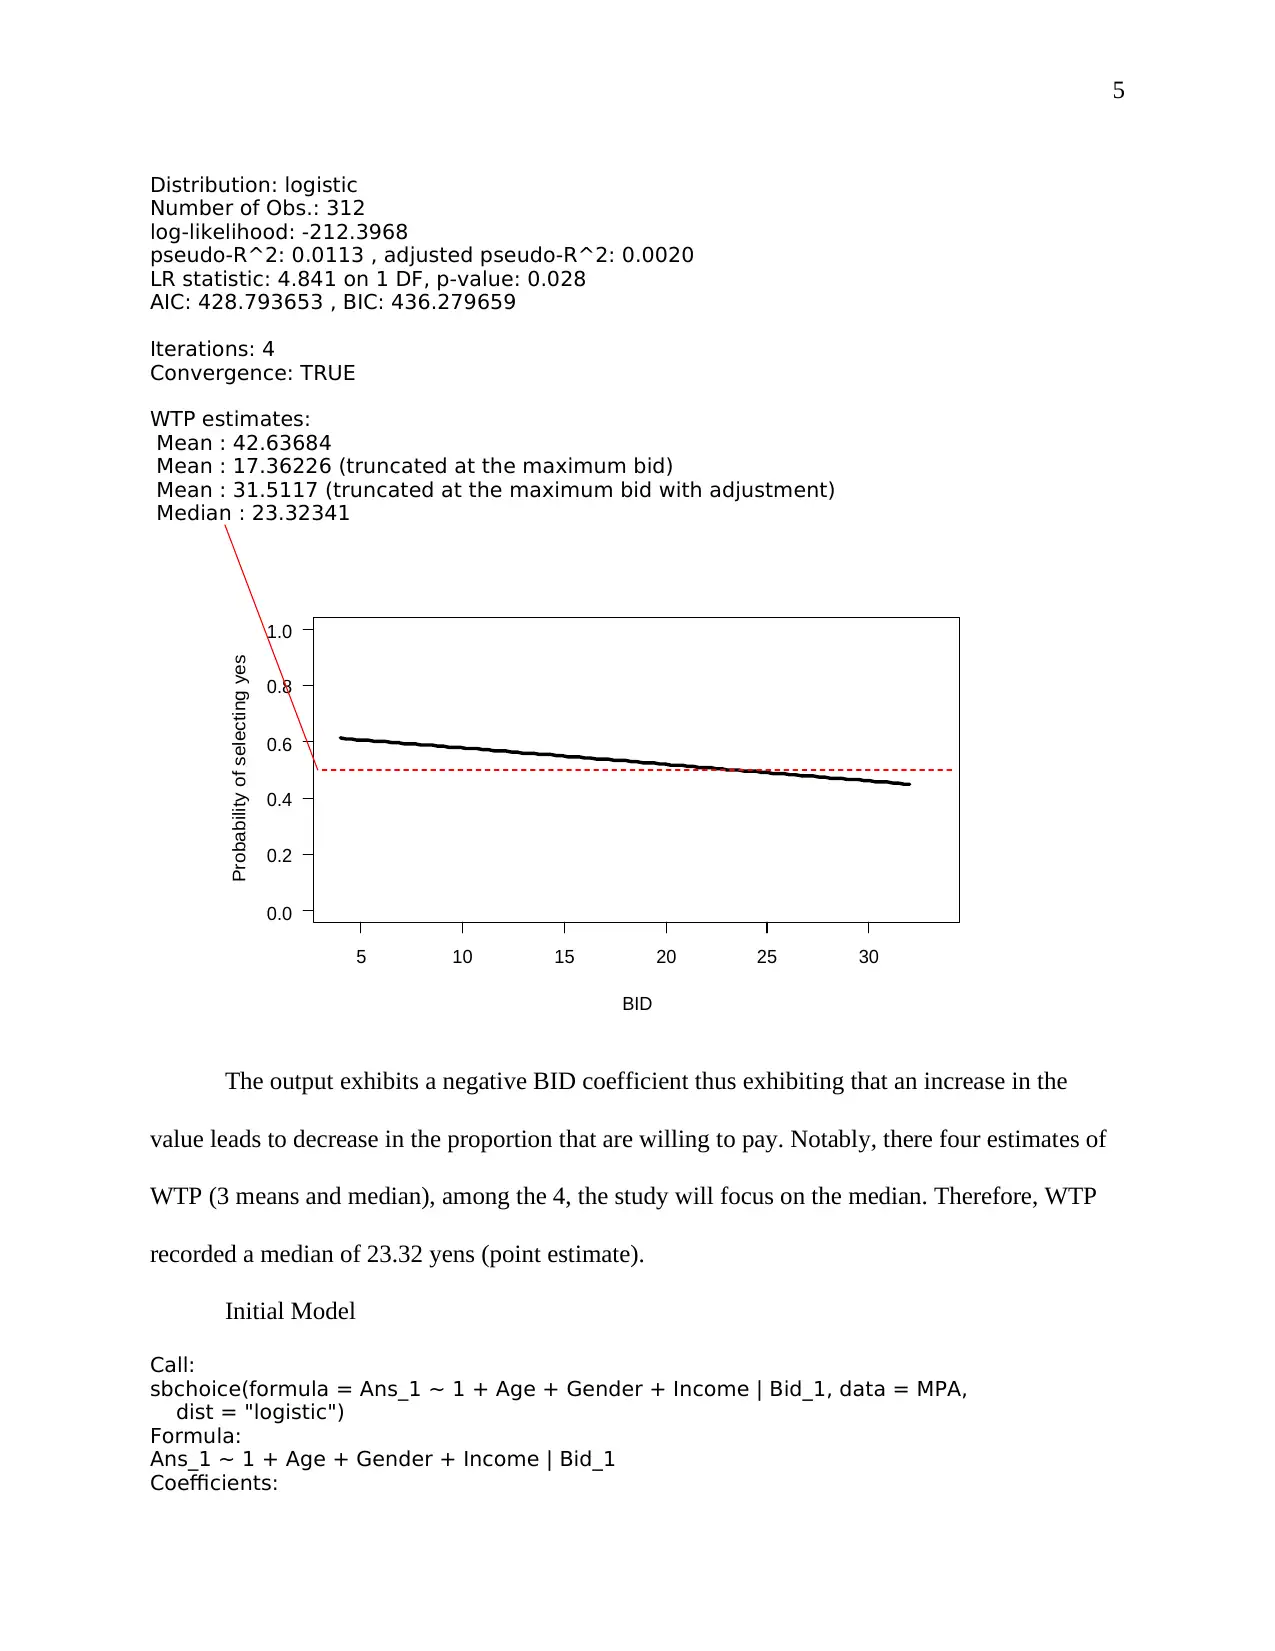
Distribution: logistic
Number of Obs.: 312
log-likelihood: -212.3968
pseudo-R^2: 0.0113 , adjusted pseudo-R^2: 0.0020
LR statistic: 4.841 on 1 DF, p-value: 0.028
AIC: 428.793653 , BIC: 436.279659
Iterations: 4
Convergence: TRUE
WTP estimates:
Mean : 42.63684
Mean : 17.36226 (truncated at the maximum bid)
Mean : 31.5117 (truncated at the maximum bid with adjustment)
Median : 23.32341
The output exhibits a negative BID coefficient thus exhibiting that an increase in the
value leads to decrease in the proportion that are willing to pay. Notably, there four estimates of
WTP (3 means and median), among the 4, the study will focus on the median. Therefore, WTP
recorded a median of 23.32 yens (point estimate).
Initial Model
Call:
sbchoice(formula = Ans_1 ~ 1 + Age + Gender + Income | Bid_1, data = MPA,
dist = "logistic")
Formula:
Ans_1 ~ 1 + Age + Gender + Income | Bid_1
Coefficients:
5 10 15 20 25 30
0.0
0.2
0.4
0.6
0.8
1.0
BID
Probability of selecting yes
6
Estimate Std. Error z value Pr(>|z|)
(Intercept) 0.87994 0.47111 1.868 0.0618 .
Age -0.36838 0.08511 -4.328 1.5e-05 ***
GenderM 0.60295 0.24986 2.413 0.0158 *
Income 0.25364 0.10547 2.405 0.0162 *
BID -0.02926 0.01157 -2.529 0.0114 *
---
Signif. codes: 0 ‘***’ 0.001 ‘**’ 0.01 ‘*’ 0.05 ‘.’ 0.1 ‘ ’ 1
Distribution: logistic
Number of Obs.: 312
log-likelihood: -191.2161
pseudo-R^2: 0.1099 , adjusted pseudo-R^2: 0.0866
LR statistic: 47.203 on 4 DF, p-value: 0.000
AIC: 392.432129 , BIC: 411.147145
Iterations: 4
Convergence: TRUE
WTP estimates:
Mean : 36.99305
Mean : 17.57259 (truncated at the maximum bid)
Mean : 31.02139 (truncated at the maximum bid with adjustment)
Median : 22.86107
The output above shows that older people (a unit increase in age reduce WTP by 0.368
units) are WTP less, males are WTP more, people of higher income are also WTP more (a unit
increase in income increases the level of WTP by 0.254 units), and increase in BID reduces the
WTP. Consequently, the WTP median is 22.86 yens.
Double-Bounded Dichotomous Model (DBDC)
Call:
dbchoice(formula = Ans_1 + Ans_2 ~ 1 + Age + Gender + Income | Bid_1 +
Bid_2, data = MPA, dist = "logistic")
0 20 40 60 80
0.0
0.2
0.4
0.6
0.8
1.0
SBDC model
Bid amounts in yens
Probability of selecting yes
Median WTP estimate = 22.86 yens
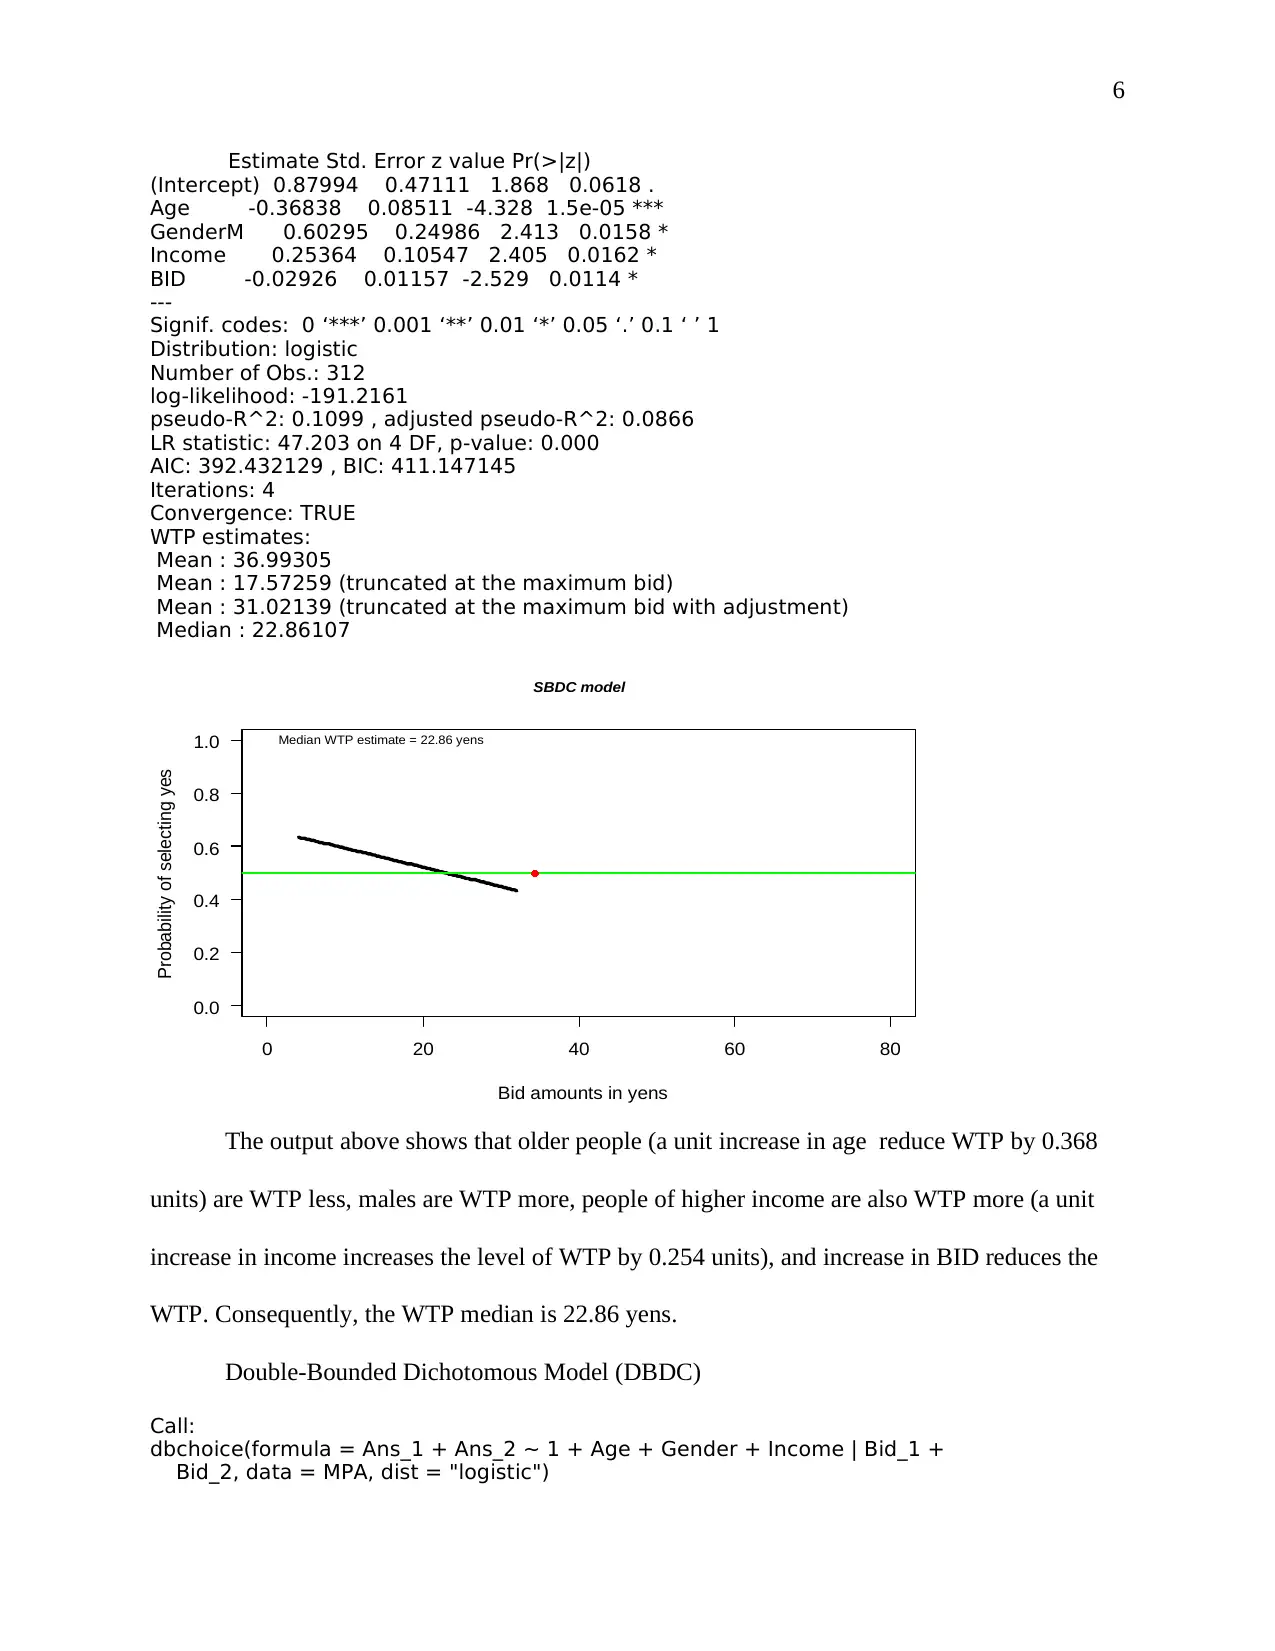
⊘ This is a preview!⊘
Do you want full access?
Subscribe today to unlock all pages.
Trusted by 1+ million students worldwide
7
Formula:
Ans_1 + Ans_2 ~ 1 + Age + Gender + Income | Bid_1 + Bid_2
Coefficients:
Estimate Std. Error z value Pr(>|z|)
(Intercept) 1.098571 0.388428 2.828 0.004680 **
Age -0.319722 0.075456 -4.237 2.3e-05 ***
GenderM 0.252395 0.215898 1.169 0.242383
Income 0.241582 0.088403 2.733 0.006281 **
BID -0.071814 0.006097 -11.778 < 2.2e-16 ***
---
Signif. codes: 0 ‘***’ 0.001 ‘**’ 0.01 ‘*’ 0.05 ‘.’ 0.1 ‘ ’ 1
Distribution: logistic
Number of Obs.: 312
Log-likelihood: -396.538523
LR statistic: 37.621 on 3 DF, p-value: 0.000
AIC: 803.077046 , BIC: 821.792062
Iterations: 48 10
Convergence: TRUE
WTP estimates:
Mean : 16.78814
Mean : 16.75516 (truncated at the maximum bid)
Mean : 16.79488 (truncated at the maximum bid with adjustment)
Median: 11.83125
The output above shows that older people are WTP less (a unit increase in age reduces
the WTP by 0.3I97units ), males are WTP more(Males are likely to increase WTP by 0.252 units
compared to females), people of higher income are also WTP more (A unit increase in the level
of income increase WTP by 0.242 units), and increase in BID (BID -0.072) reduces the WTP.
Consequently, the WTP median is 11.83 yens.
Paraphrase This Document
Need a fresh take? Get an instant paraphrase of this document with our AI Paraphraser
8
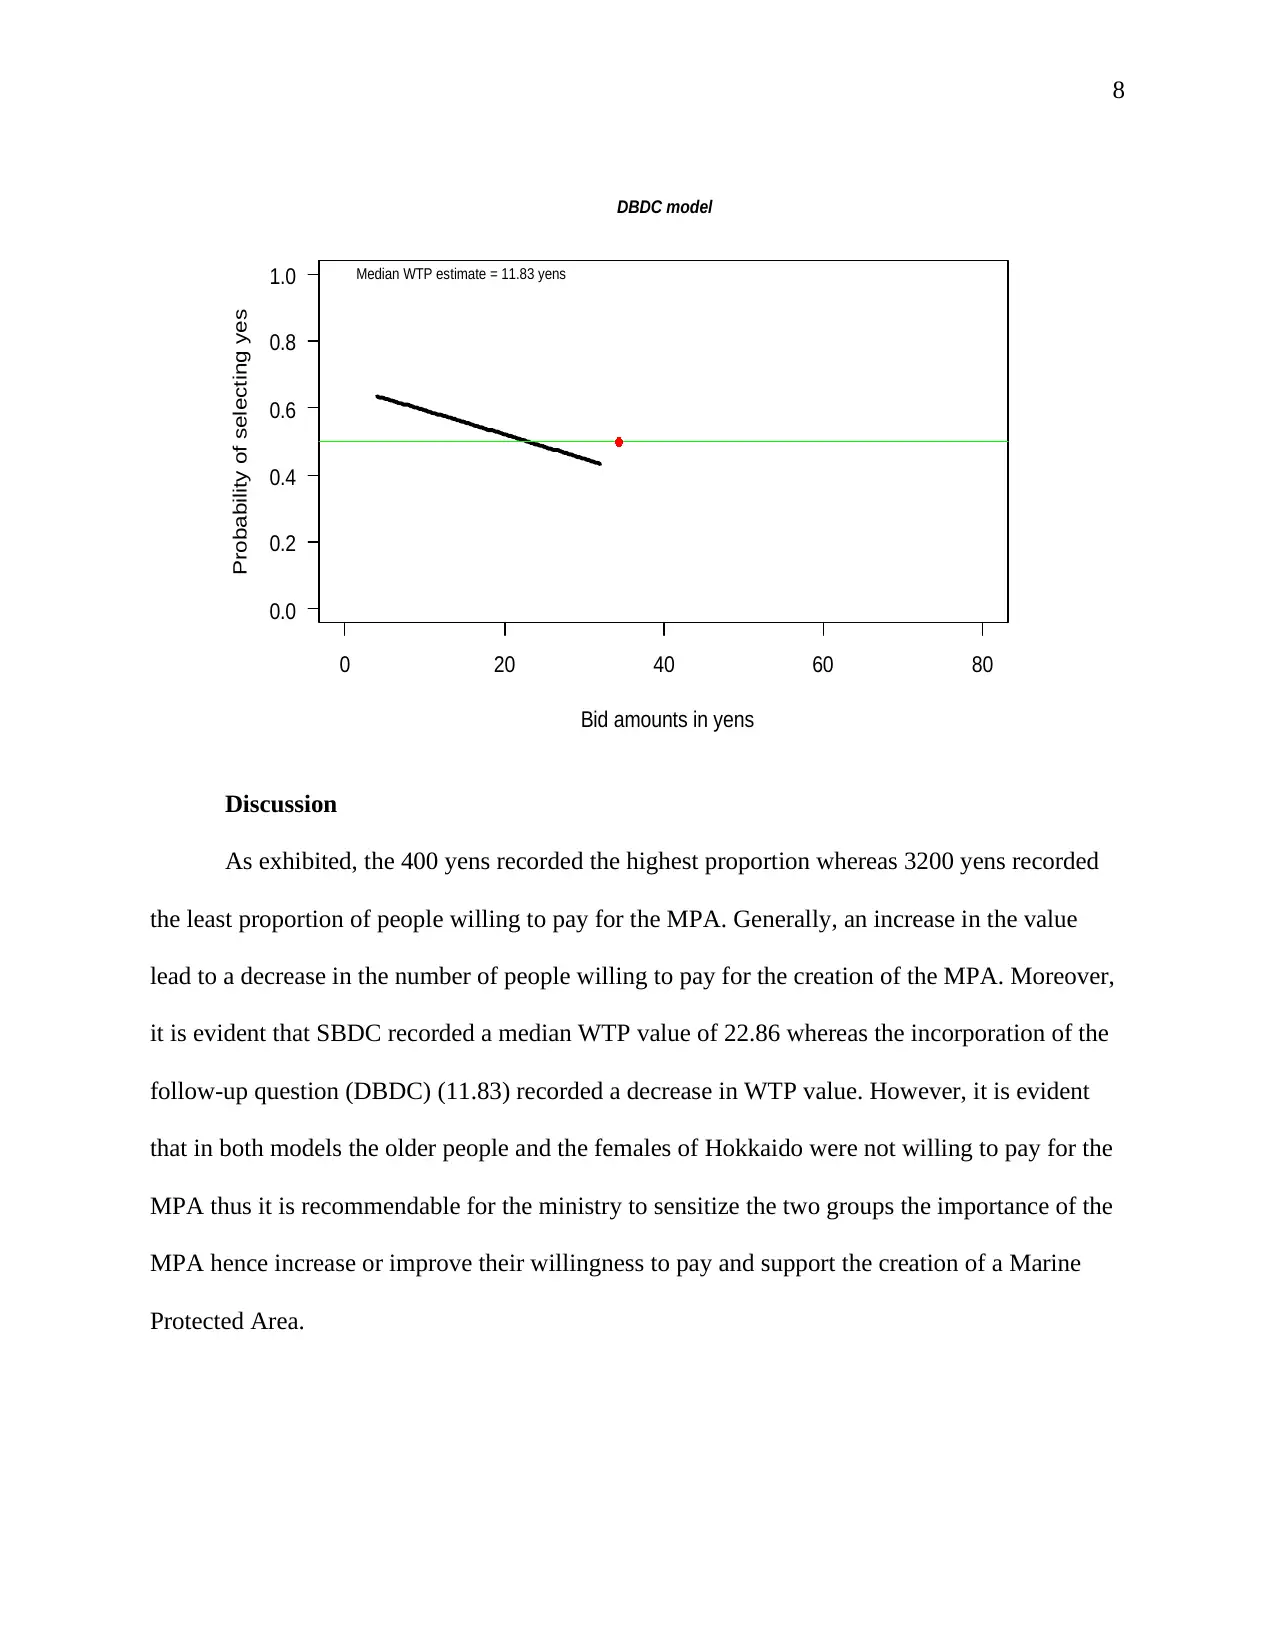
Discussion
As exhibited, the 400 yens recorded the highest proportion whereas 3200 yens recorded
the least proportion of people willing to pay for the MPA. Generally, an increase in the value
lead to a decrease in the number of people willing to pay for the creation of the MPA. Moreover,
it is evident that SBDC recorded a median WTP value of 22.86 whereas the incorporation of the
follow-up question (DBDC) (11.83) recorded a decrease in WTP value. However, it is evident
that in both models the older people and the females of Hokkaido were not willing to pay for the
MPA thus it is recommendable for the ministry to sensitize the two groups the importance of the
MPA hence increase or improve their willingness to pay and support the creation of a Marine
Protected Area.
0 20 40 60 80
0.0
0.2
0.4
0.6
0.8
1.0
DBDC model
Bid amounts in yens
Probability of selecting yes
Median WTP estimate = 11.83 yens
9
References
Fogarty, J., & Aizaki, H. (2018, March 30). Non-Market Valuation with R: Contingent
Valuation. Retrieved from http://lab.agr.hokudai.ac.jp/nmvr/index.html
Jones, P. (2019). Contingent Valuation. Retrieved from Encyclopaedia Britannica Website:
https://www.britannica.com/topic/contingent-valuation
⊘ This is a preview!⊘
Do you want full access?
Subscribe today to unlock all pages.
Trusted by 1+ million students worldwide
1 out of 9

Your All-in-One AI-Powered Toolkit for Academic Success.
+13062052269
info@desklib.com
Available 24*7 on WhatsApp / Email
![[object Object]](/_next/static/media/star-bottom.7253800d.svg)
Unlock your academic potential
Copyright © 2020–2026 A2Z Services. All Rights Reserved. Developed and managed by ZUCOL.