Environmental Risk Assessment: Statistical Analysis and Case Studies

Verified

Added on  2023/06/03

|9
|1309
|454
Homework Assignment
AI Summary
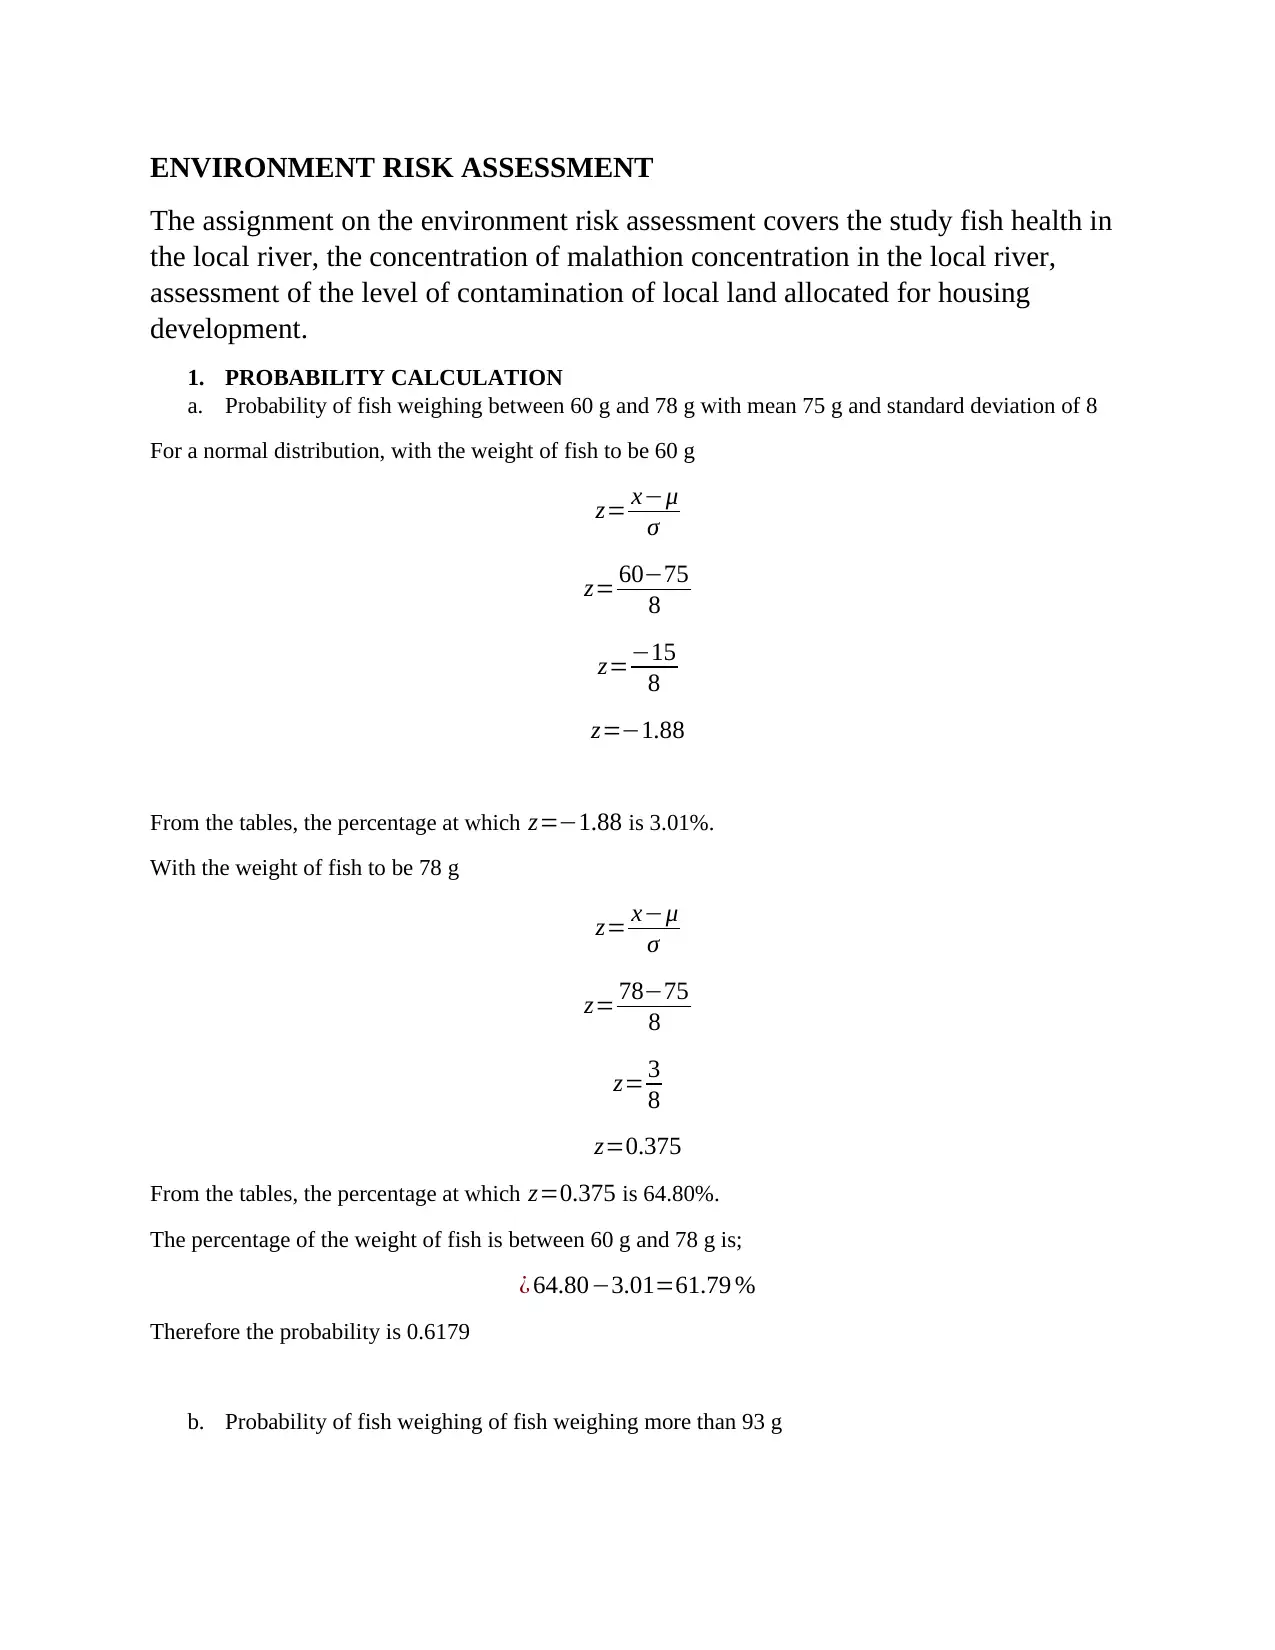
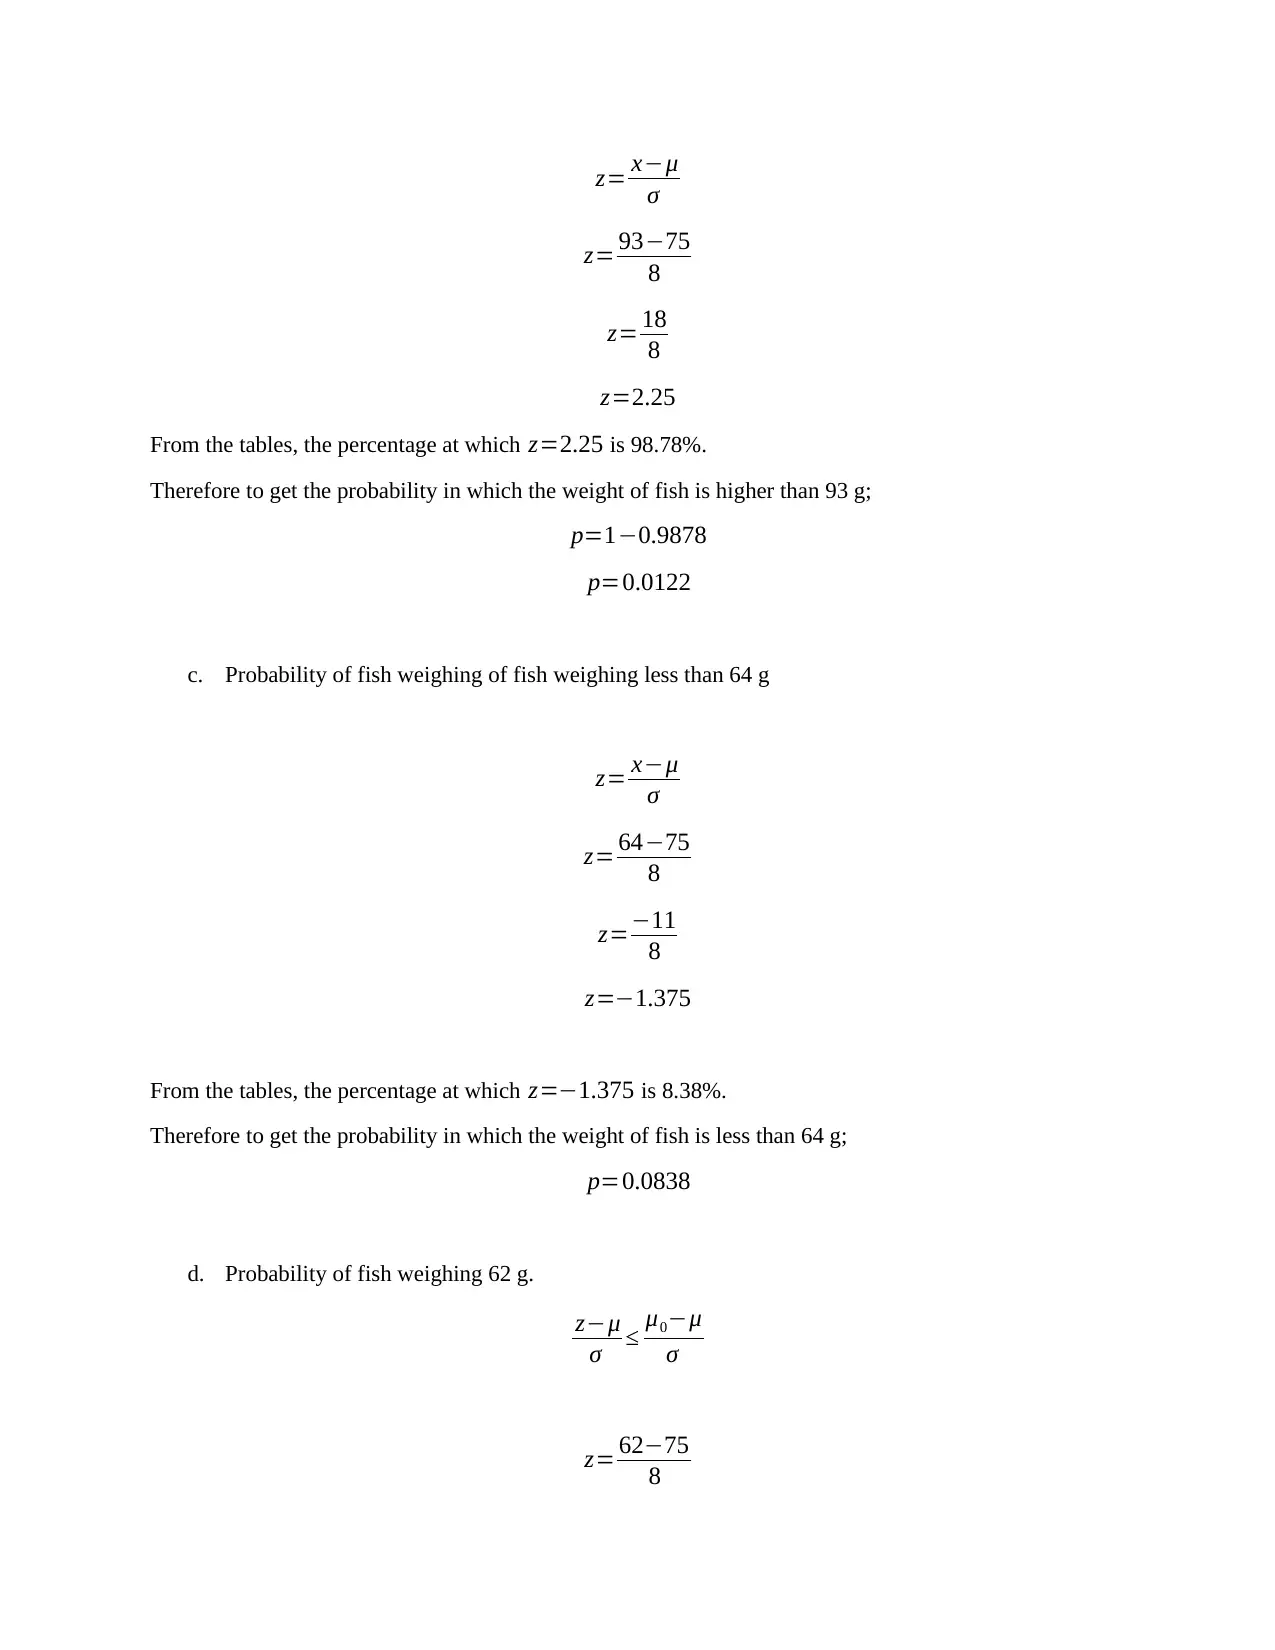
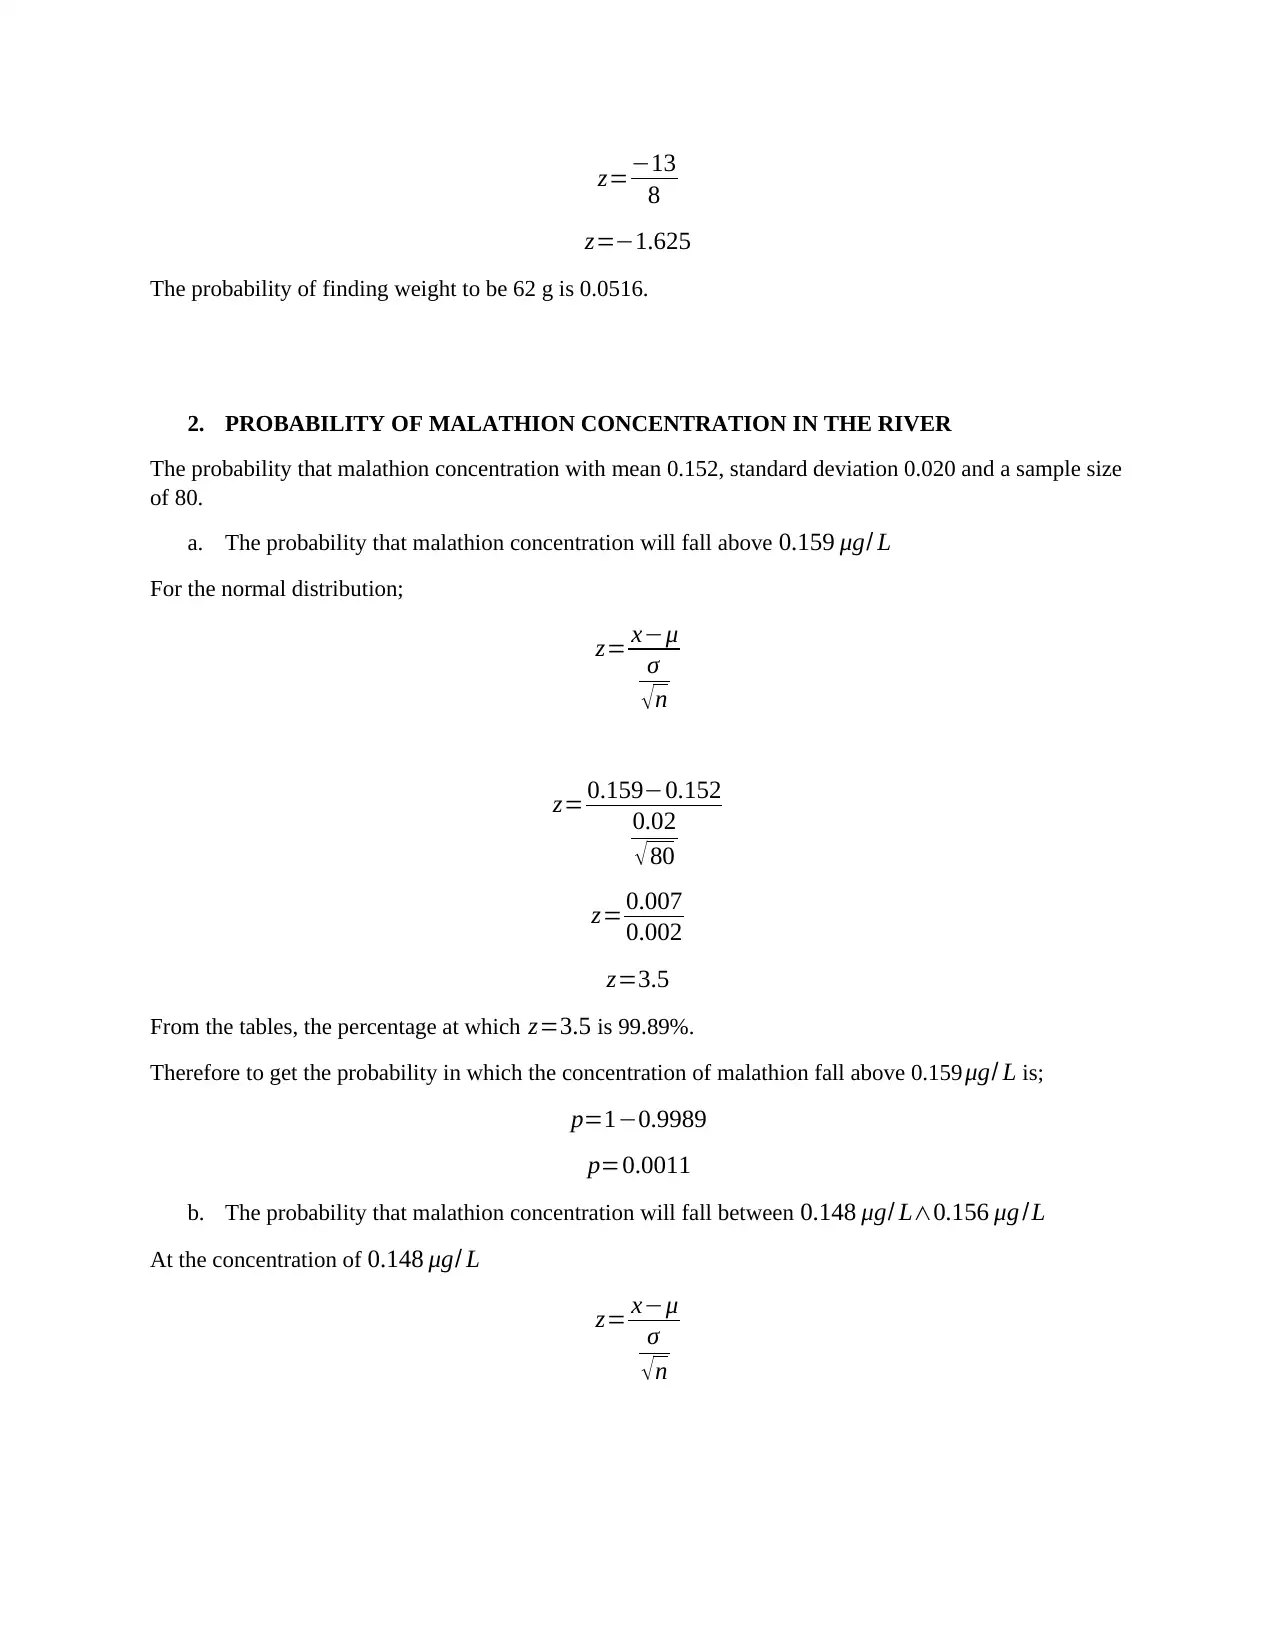
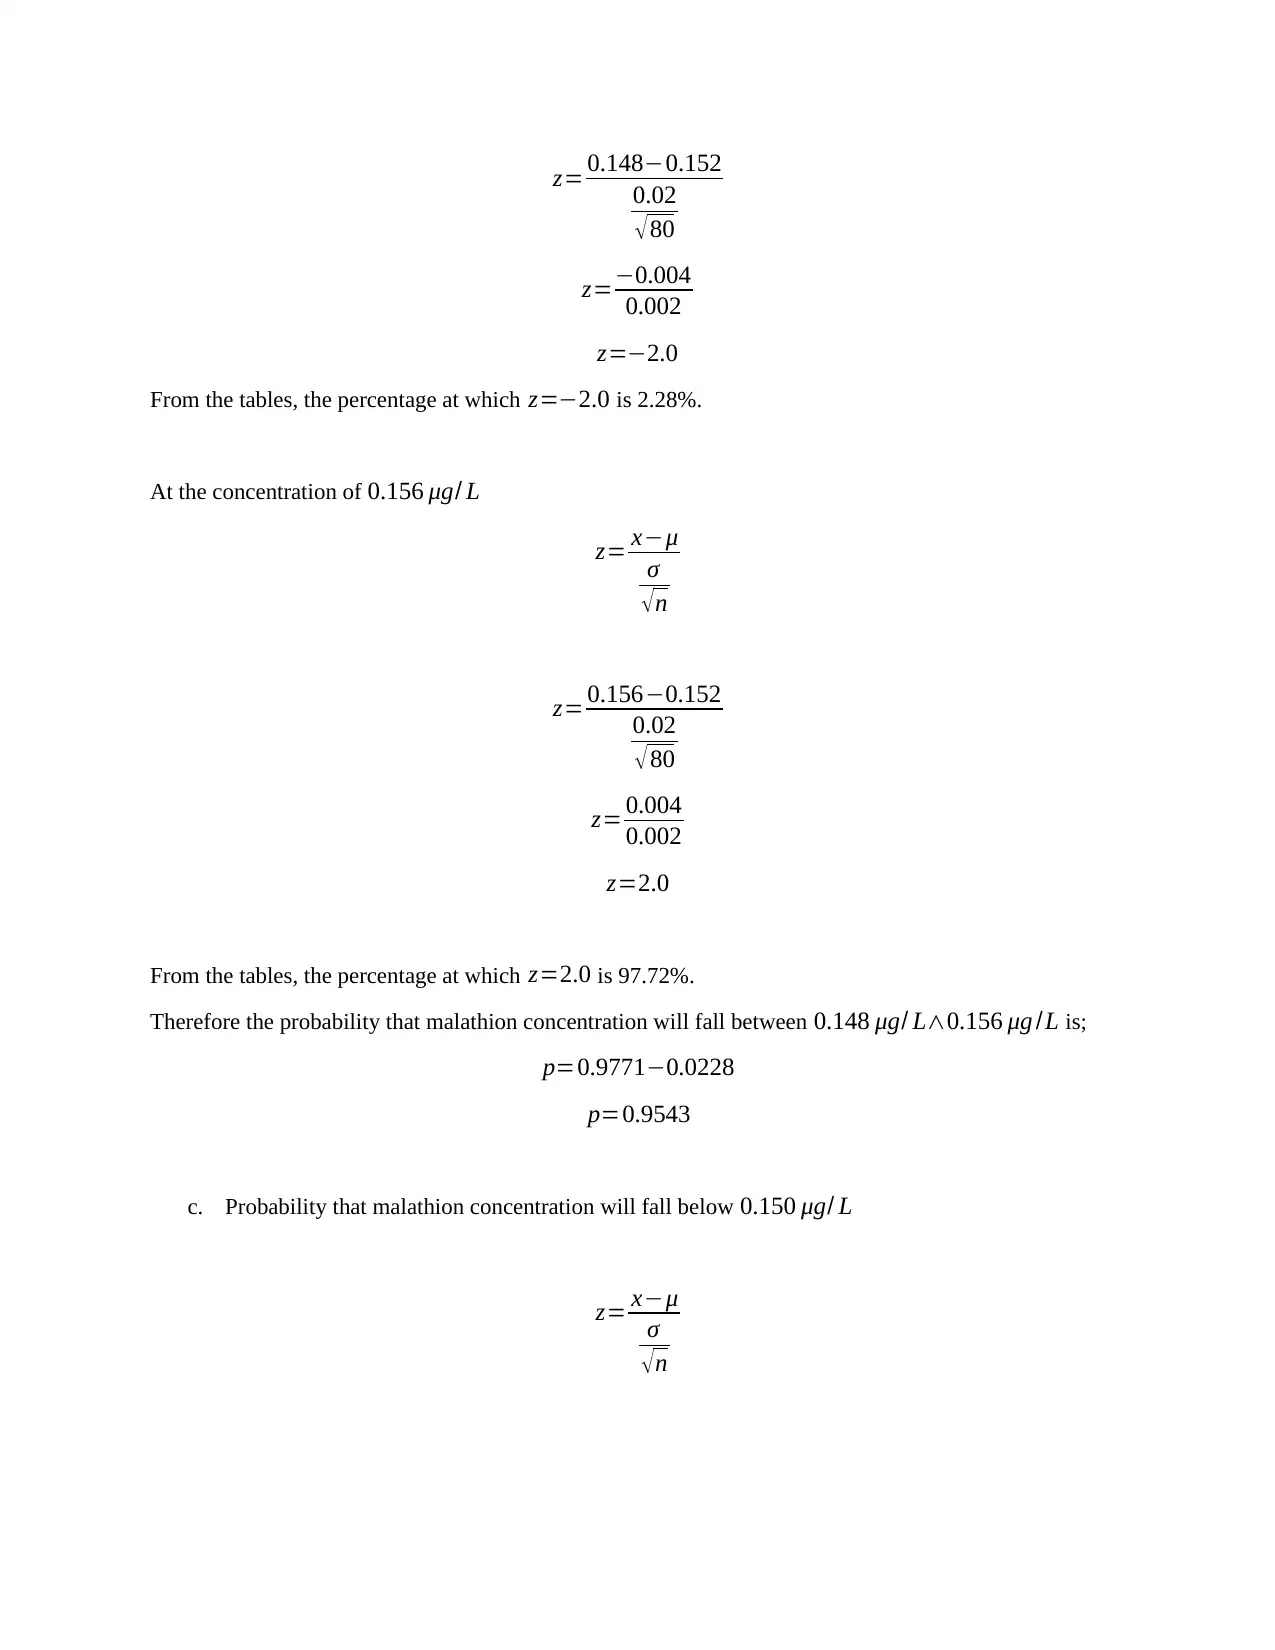
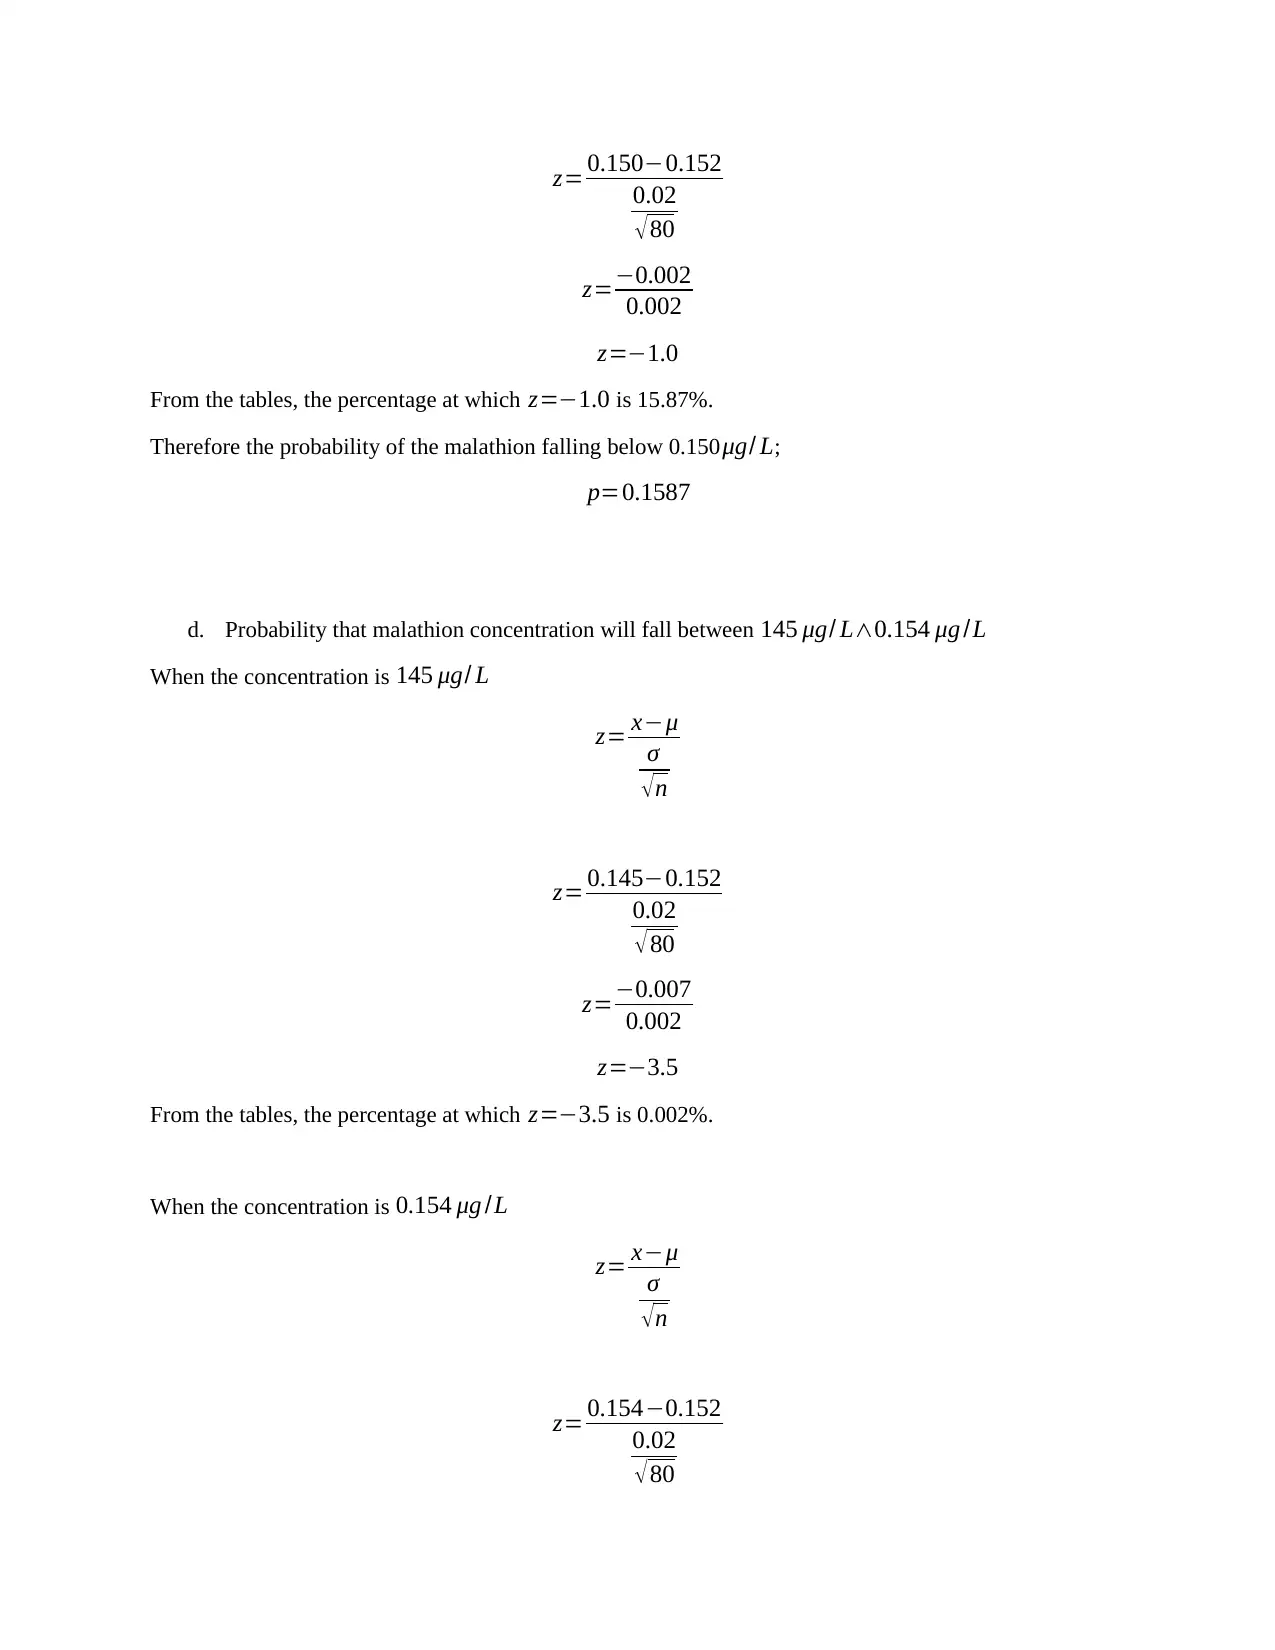
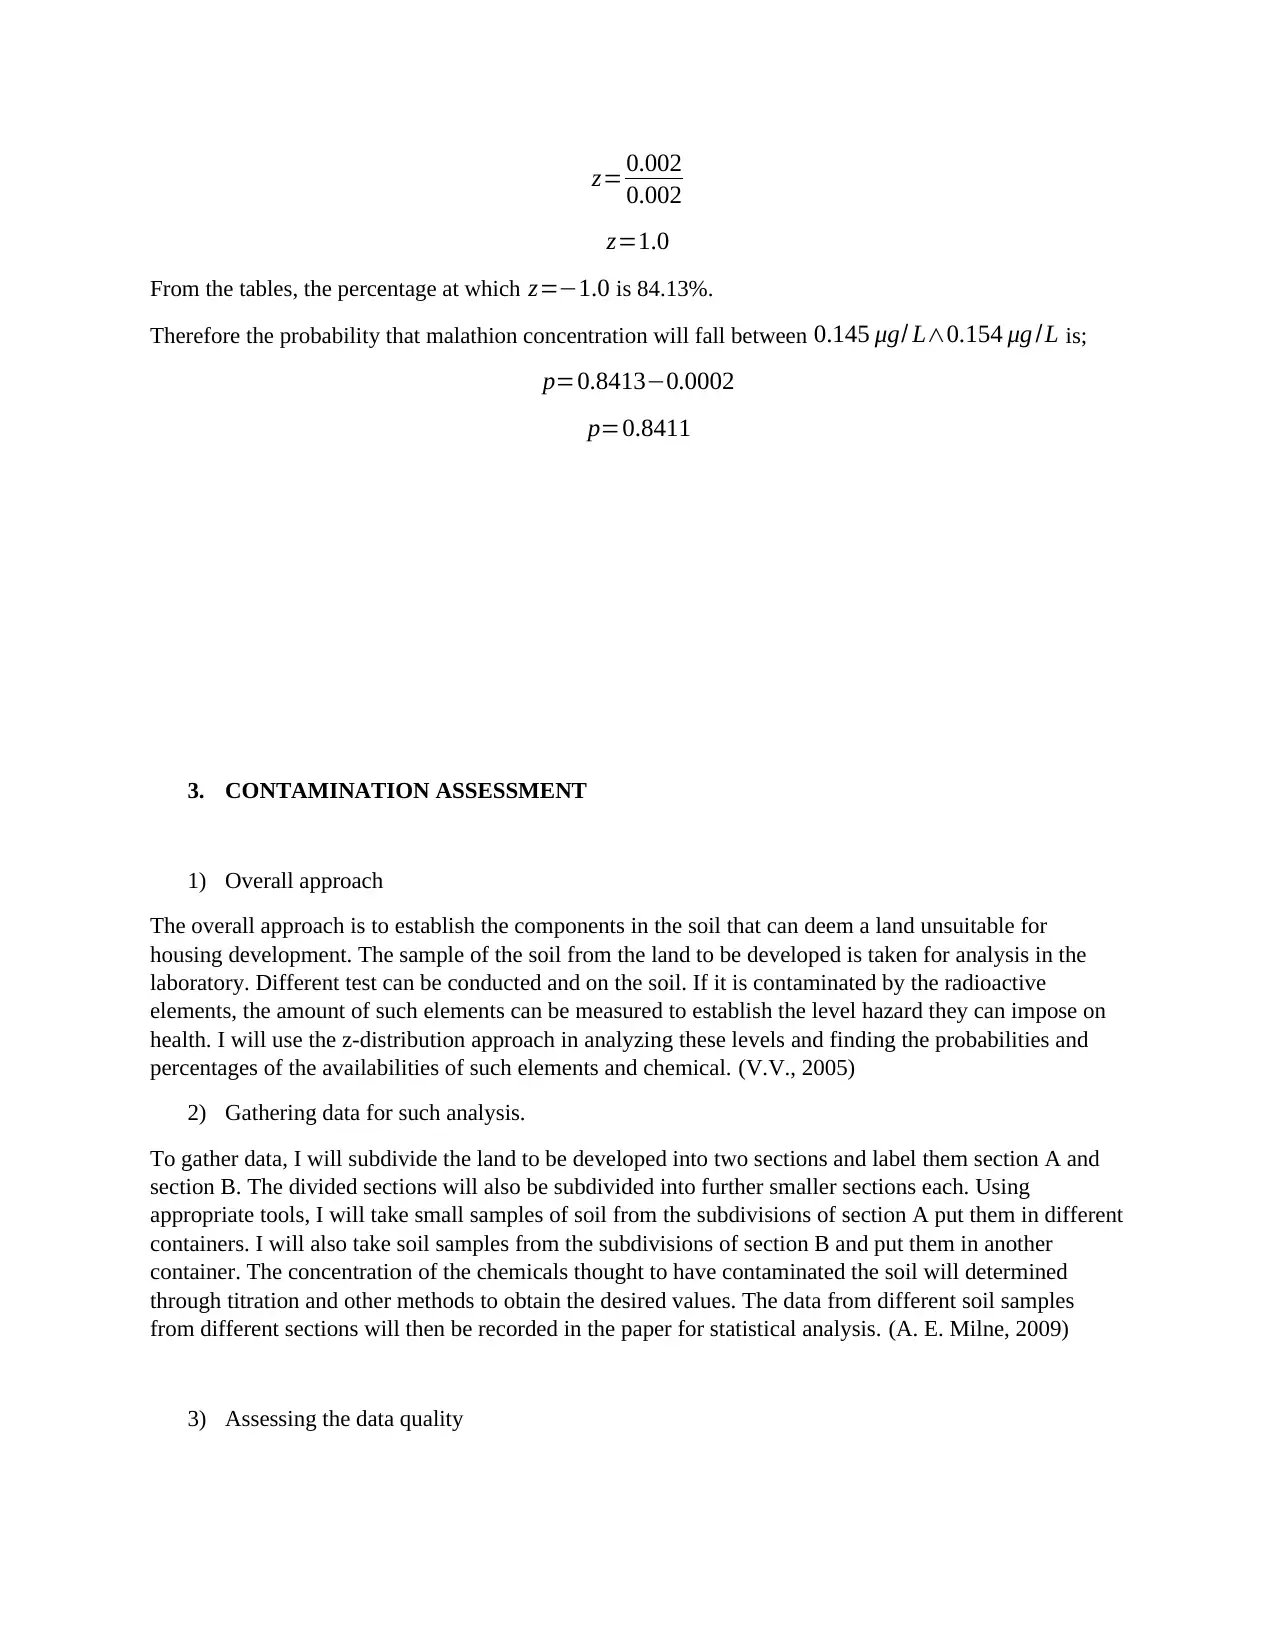
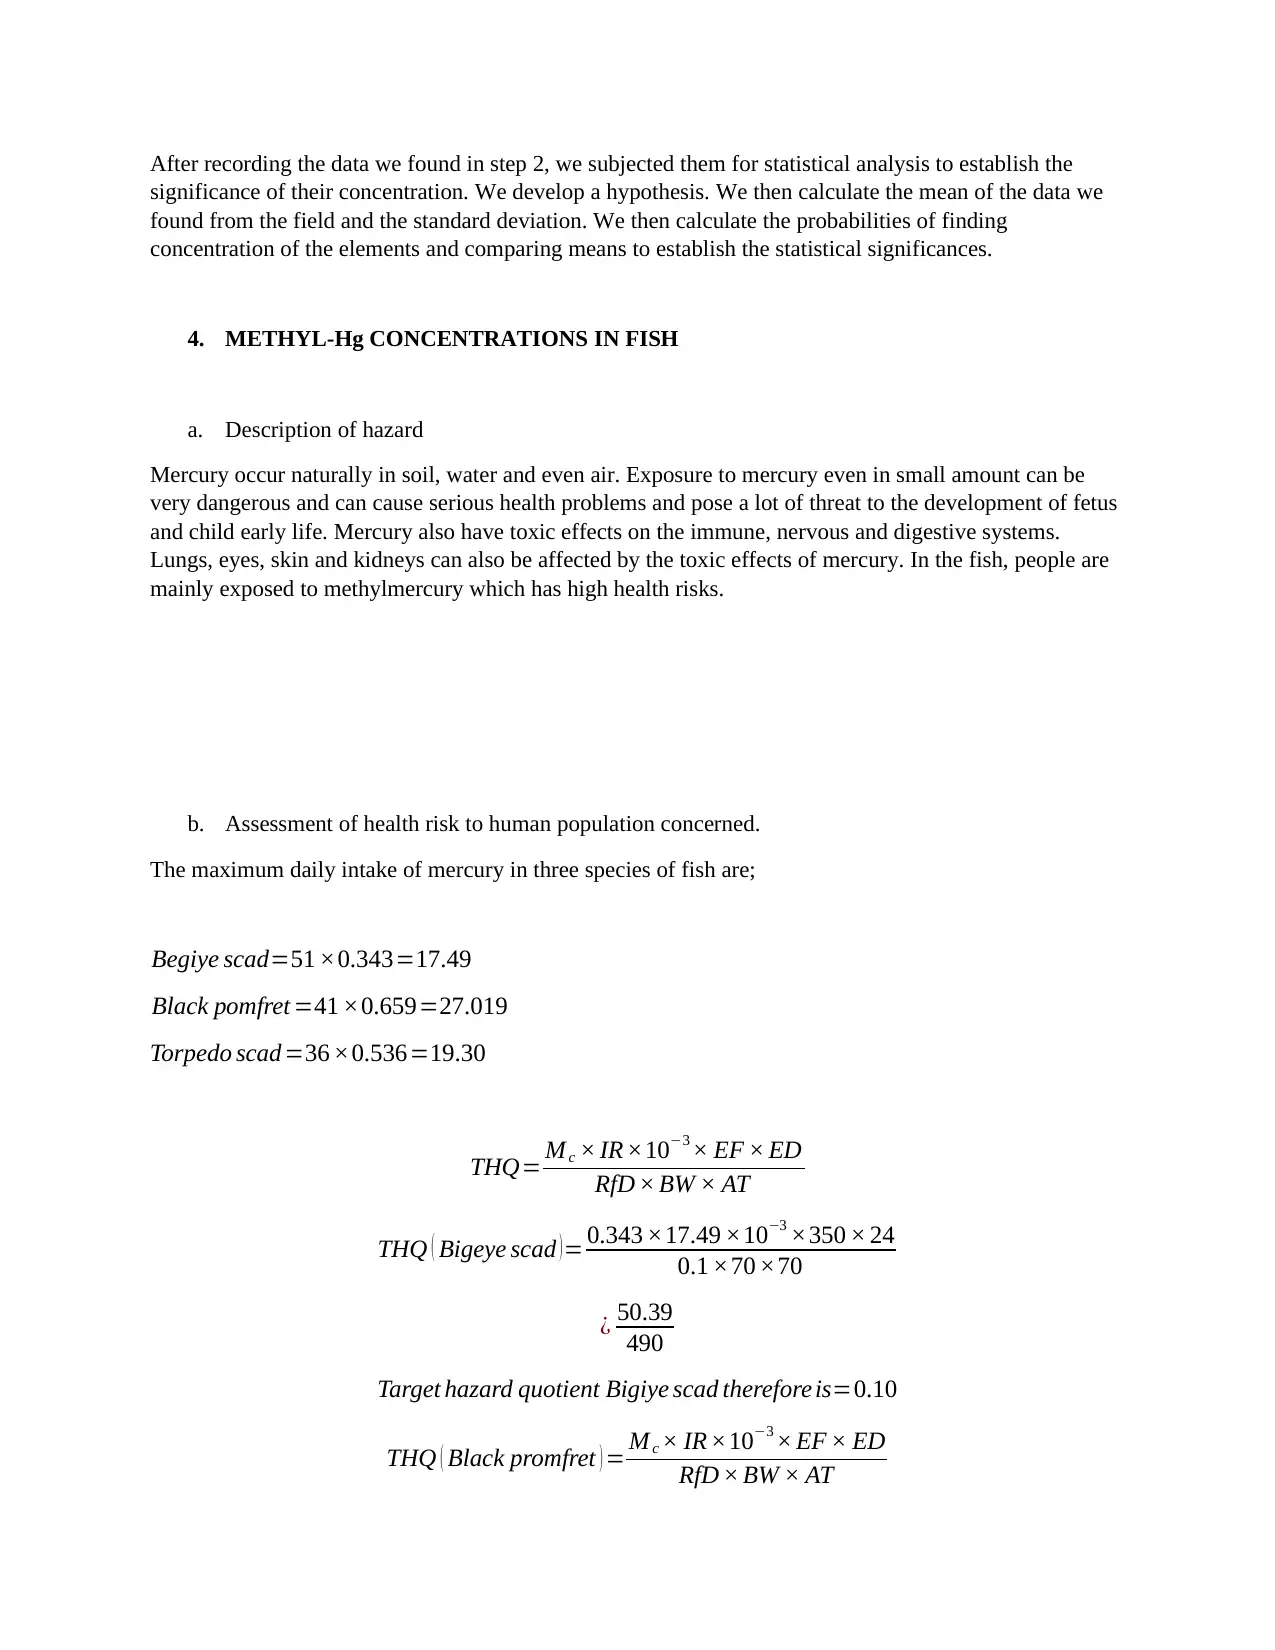
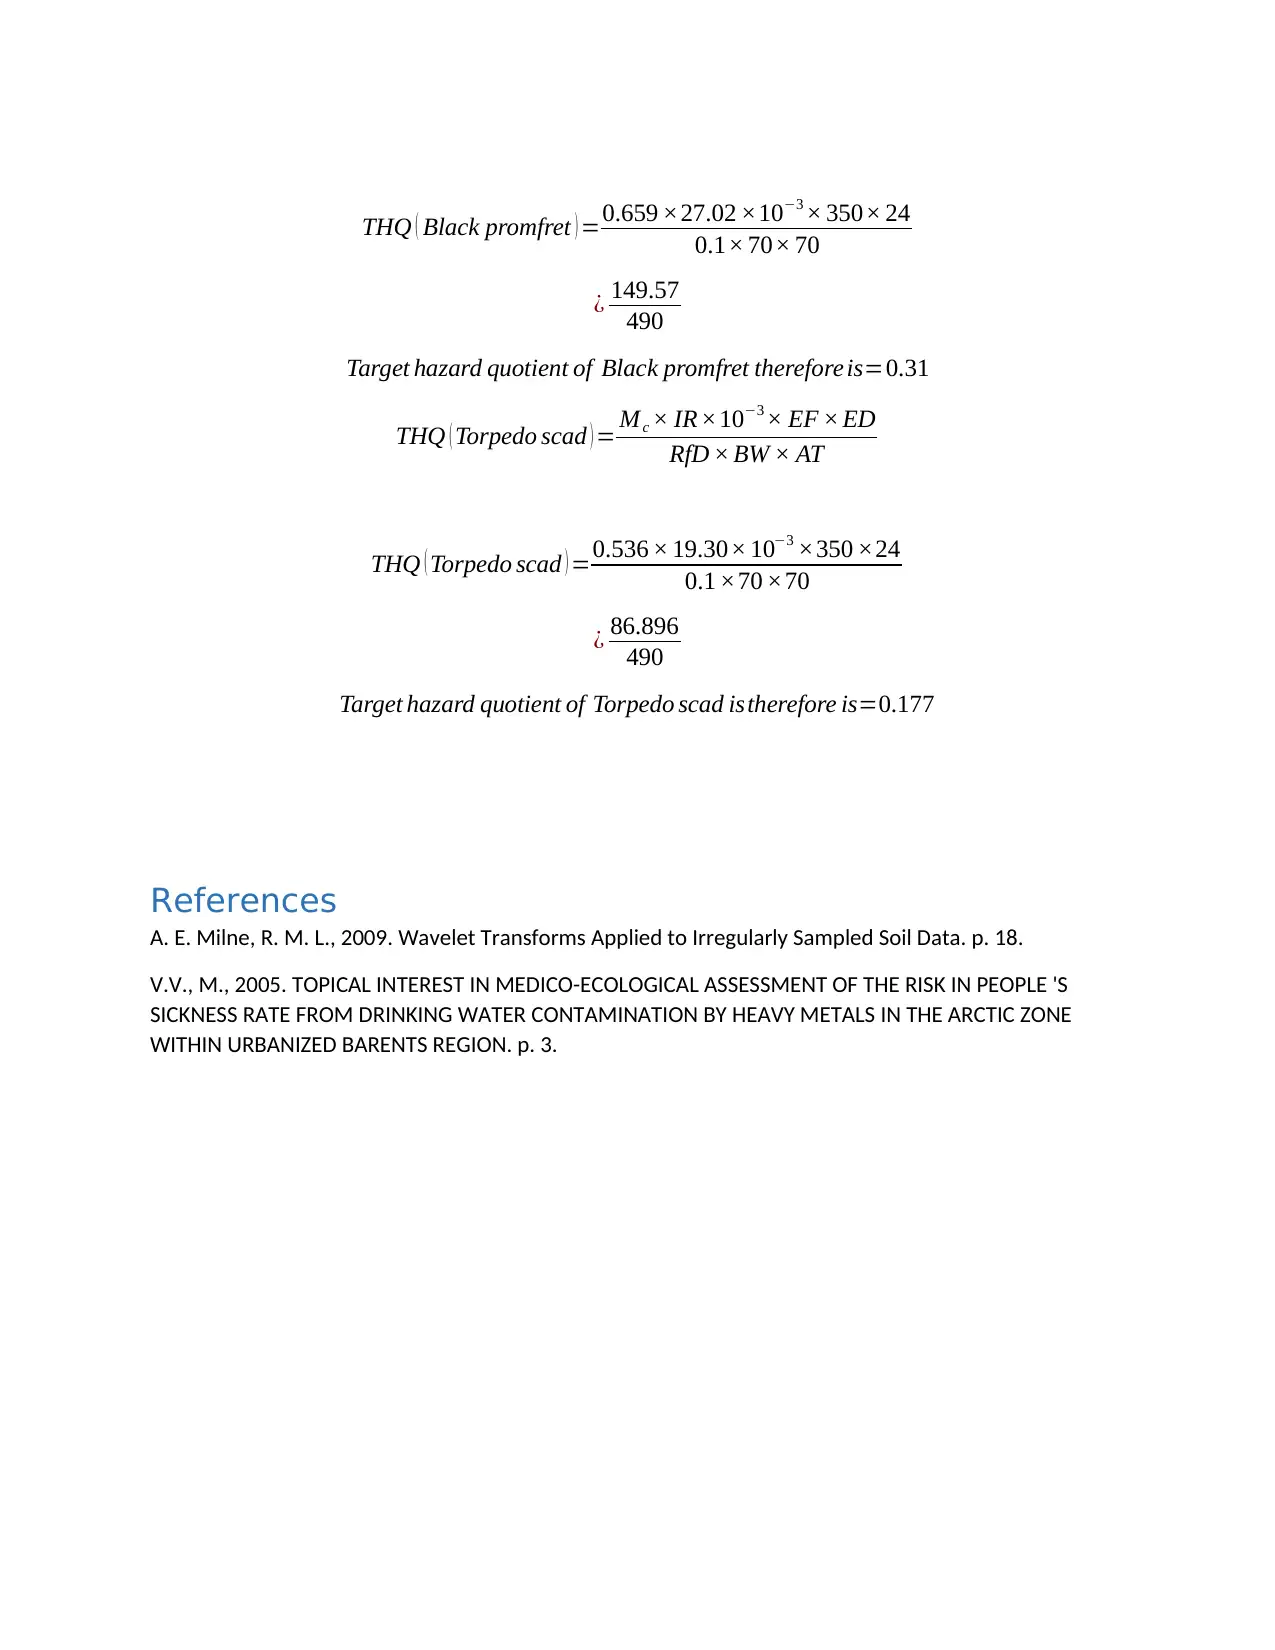
This document presents a comprehensive solution to an environmental risk assessment assignment. It begins with probability calculations related to fish weight, including the probability of fish weighing within specific ranges and the probability of exceeding or falling below certain weights. The assignment then delves into the probability of malathion concentration in a local river, analyzing the likelihood of concentrations falling above, between, and below specified thresholds. The analysis incorporates statistical methods, including z-scores, to determine these probabilities. Furthermore, the assignment assesses the contamination of land proposed for housing development, outlining an approach to gather data, assess data quality, and determine the suitability of the land. Finally, the assignment evaluates the health risks associated with methylmercury concentrations in fish, describing the hazard, assessing human exposure, and calculating target hazard quotients for different fish species. The solution provides detailed calculations and explanations, demonstrating a thorough understanding of environmental risk assessment principles.
Document Page
ENVIRONMENT RISK ASSESSMENT
The assignment on the environment risk assessment covers the study fish health in
the local river, the concentration of malathion concentration in the local river,
assessment of the level of contamination of local land allocated for housing
development.
1. PROBABILITY CALCULATION
a. Probability of fish weighing between 60 g and 78 g with mean 75 g and standard deviation of 8
For a normal distribution, with the weight of fish to be 60 g
z= xμ
σ
z= 6075
8
z=15
8
z=1.88
From the tables, the percentage at which z=1.88 is 3.01%.
With the weight of fish to be 78 g
z= xμ
σ
z= 7875
8
z= 3
8
z=0.375
From the tables, the percentage at which z=0.375 is 64.80%.
The percentage of the weight of fish is between 60 g and 78 g is;
¿ 64.803.01=61.79 %
Therefore the probability is 0.6179
b. Probability of fish weighing of fish weighing more than 93 g
tabler-icon-diamond-filled.svg

Paraphrase This Document

Need a fresh take? Get an instant paraphrase of this document with our AI Paraphraser
Document Page
z= xμ
σ
z= 9375
8
z= 18
8
z=2.25
From the tables, the percentage at which z=2.25 is 98.78%.
Therefore to get the probability in which the weight of fish is higher than 93 g;
p=10.9878
p=0.0122
c. Probability of fish weighing of fish weighing less than 64 g
z= xμ
σ
z= 6475
8
z=11
8
z=1.375
From the tables, the percentage at which z=1.375 is 8.38%.
Therefore to get the probability in which the weight of fish is less than 64 g;
p=0.0838
d. Probability of fish weighing 62 g.
zμ
σ μ0μ
σ
z= 6275
8
Document Page
z=13
8
z=1.625
The probability of finding weight to be 62 g is 0.0516.
2. PROBABILITY OF MALATHION CONCENTRATION IN THE RIVER
The probability that malathion concentration with mean 0.152, standard deviation 0.020 and a sample size
of 80.
a. The probability that malathion concentration will fall above 0.159 μg/ L
For the normal distribution;
z= xμ
σ
n
z= 0.1590.152
0.02
80
z= 0.007
0.002
z=3.5
From the tables, the percentage at which z=3.5 is 99.89%.
Therefore to get the probability in which the concentration of malathion fall above 0.159 μg/ L is;
p=10.9989
p=0.0011
b. The probability that malathion concentration will fall between 0.148 μg/ L0.156 μg /L
At the concentration of 0.148 μg/ L
z= xμ
σ
n
Document Page
z= 0.1480.152
0.02
80
z=0.004
0.002
z=2.0
From the tables, the percentage at which z=2.0 is 2.28%.
At the concentration of 0.156 μg/ L
z= xμ
σ
n
z= 0.1560.152
0.02
80
z= 0.004
0.002
z=2.0
From the tables, the percentage at which z=2.0 is 97.72%.
Therefore the probability that malathion concentration will fall between 0.148 μg/ L0.156 μg /L is;
p=0.97710.0228
p=0.9543
c. Probability that malathion concentration will fall below 0.150 μg/ L
z= xμ
σ
n
tabler-icon-diamond-filled.svg

Paraphrase This Document

Need a fresh take? Get an instant paraphrase of this document with our AI Paraphraser
Document Page
z= 0.1500.152
0.02
80
z=0.002
0.002
z=1.0
From the tables, the percentage at which z=1.0 is 15.87%.
Therefore the probability of the malathion falling below 0.150μg/ L;
p=0.1587
d. Probability that malathion concentration will fall between 145 μg/ L0.154 μg /L
When the concentration is 145 μg/ L
z= xμ
σ
n
z= 0.1450.152
0.02
80
z=0.007
0.002
z=3.5
From the tables, the percentage at which z=3.5 is 0.002%.
When the concentration is 0.154 μg /L
z= xμ
σ
n
z= 0.1540.152
0.02
80
Document Page
z= 0.002
0.002
z=1.0
From the tables, the percentage at which z=1.0 is 84.13%.
Therefore the probability that malathion concentration will fall between 0.145 μg/ L0.154 μg /L is;
p=0.84130.0002
p=0.8411
3. CONTAMINATION ASSESSMENT
1) Overall approach
The overall approach is to establish the components in the soil that can deem a land unsuitable for
housing development. The sample of the soil from the land to be developed is taken for analysis in the
laboratory. Different test can be conducted and on the soil. If it is contaminated by the radioactive
elements, the amount of such elements can be measured to establish the level hazard they can impose on
health. I will use the z-distribution approach in analyzing these levels and finding the probabilities and
percentages of the availabilities of such elements and chemical. (V.V., 2005)
2) Gathering data for such analysis.
To gather data, I will subdivide the land to be developed into two sections and label them section A and
section B. The divided sections will also be subdivided into further smaller sections each. Using
appropriate tools, I will take small samples of soil from the subdivisions of section A put them in different
containers. I will also take soil samples from the subdivisions of section B and put them in another
container. The concentration of the chemicals thought to have contaminated the soil will determined
through titration and other methods to obtain the desired values. The data from different soil samples
from different sections will then be recorded in the paper for statistical analysis. (A. E. Milne, 2009)
3) Assessing the data quality
Document Page
After recording the data we found in step 2, we subjected them for statistical analysis to establish the
significance of their concentration. We develop a hypothesis. We then calculate the mean of the data we
found from the field and the standard deviation. We then calculate the probabilities of finding
concentration of the elements and comparing means to establish the statistical significances.
4. METHYL-Hg CONCENTRATIONS IN FISH
a. Description of hazard
Mercury occur naturally in soil, water and even air. Exposure to mercury even in small amount can be
very dangerous and can cause serious health problems and pose a lot of threat to the development of fetus
and child early life. Mercury also have toxic effects on the immune, nervous and digestive systems.
Lungs, eyes, skin and kidneys can also be affected by the toxic effects of mercury. In the fish, people are
mainly exposed to methylmercury which has high health risks.
b. Assessment of health risk to human population concerned.
The maximum daily intake of mercury in three species of fish are;
Begiye scad=51 ×0.343=17.49
Black pomfret =41 ×0.659=27.019
Torpedo scad =36 ×0.536=19.30
THQ= M c × IR ×103 × EF × ED
RfD × BW × AT
THQ ( Bigeye scad )= 0.343 ×17.49 ×103 ×350 × 24
0.1 ×70 ×70
¿ 50.39
490
Target hazard quotient Bigiye scad therefore is=0.10
THQ ( Black promfret ) = Mc × IR ×103 × EF × ED
RfD × BW × AT
tabler-icon-diamond-filled.svg

Paraphrase This Document

Need a fresh take? Get an instant paraphrase of this document with our AI Paraphraser
Document Page
THQ ( Black promfret ) =0.659 ×27.02 ×103 × 350× 24
0.1× 70× 70
¿ 149.57
490
Target hazard quotient of Black promfret therefore is=0.31
THQ ( Torpedo scad ) = Mc × IR ×103 × EF × ED
RfD × BW × AT
THQ ( Torpedo scad ) =0.536 × 19.30× 103 ×350 ×24
0.1 ×70 ×70
¿ 86.896
490
Target hazard quotient of Torpedo scad istherefore is=0.177
References
A. E. Milne, R. M. L., 2009. Wavelet Transforms Applied to Irregularly Sampled Soil Data. p. 18.
V.V., M., 2005. TOPICAL INTEREST IN MEDICO-ECOLOGICAL ASSESSMENT OF THE RISK IN PEOPLE 'S
SICKNESS RATE FROM DRINKING WATER CONTAMINATION BY HEAVY METALS IN THE ARCTIC ZONE
WITHIN URBANIZED BARENTS REGION. p. 3.
Document Page
chevron_up_icon
1 out of 9
circle_padding
hide_on_mobile
zoom_out_icon
[object Object]