Environmental Engineering: Water Treatment Processes Report
VerifiedAdded on 2020/03/23
|7
|1760
|137
Report
AI Summary
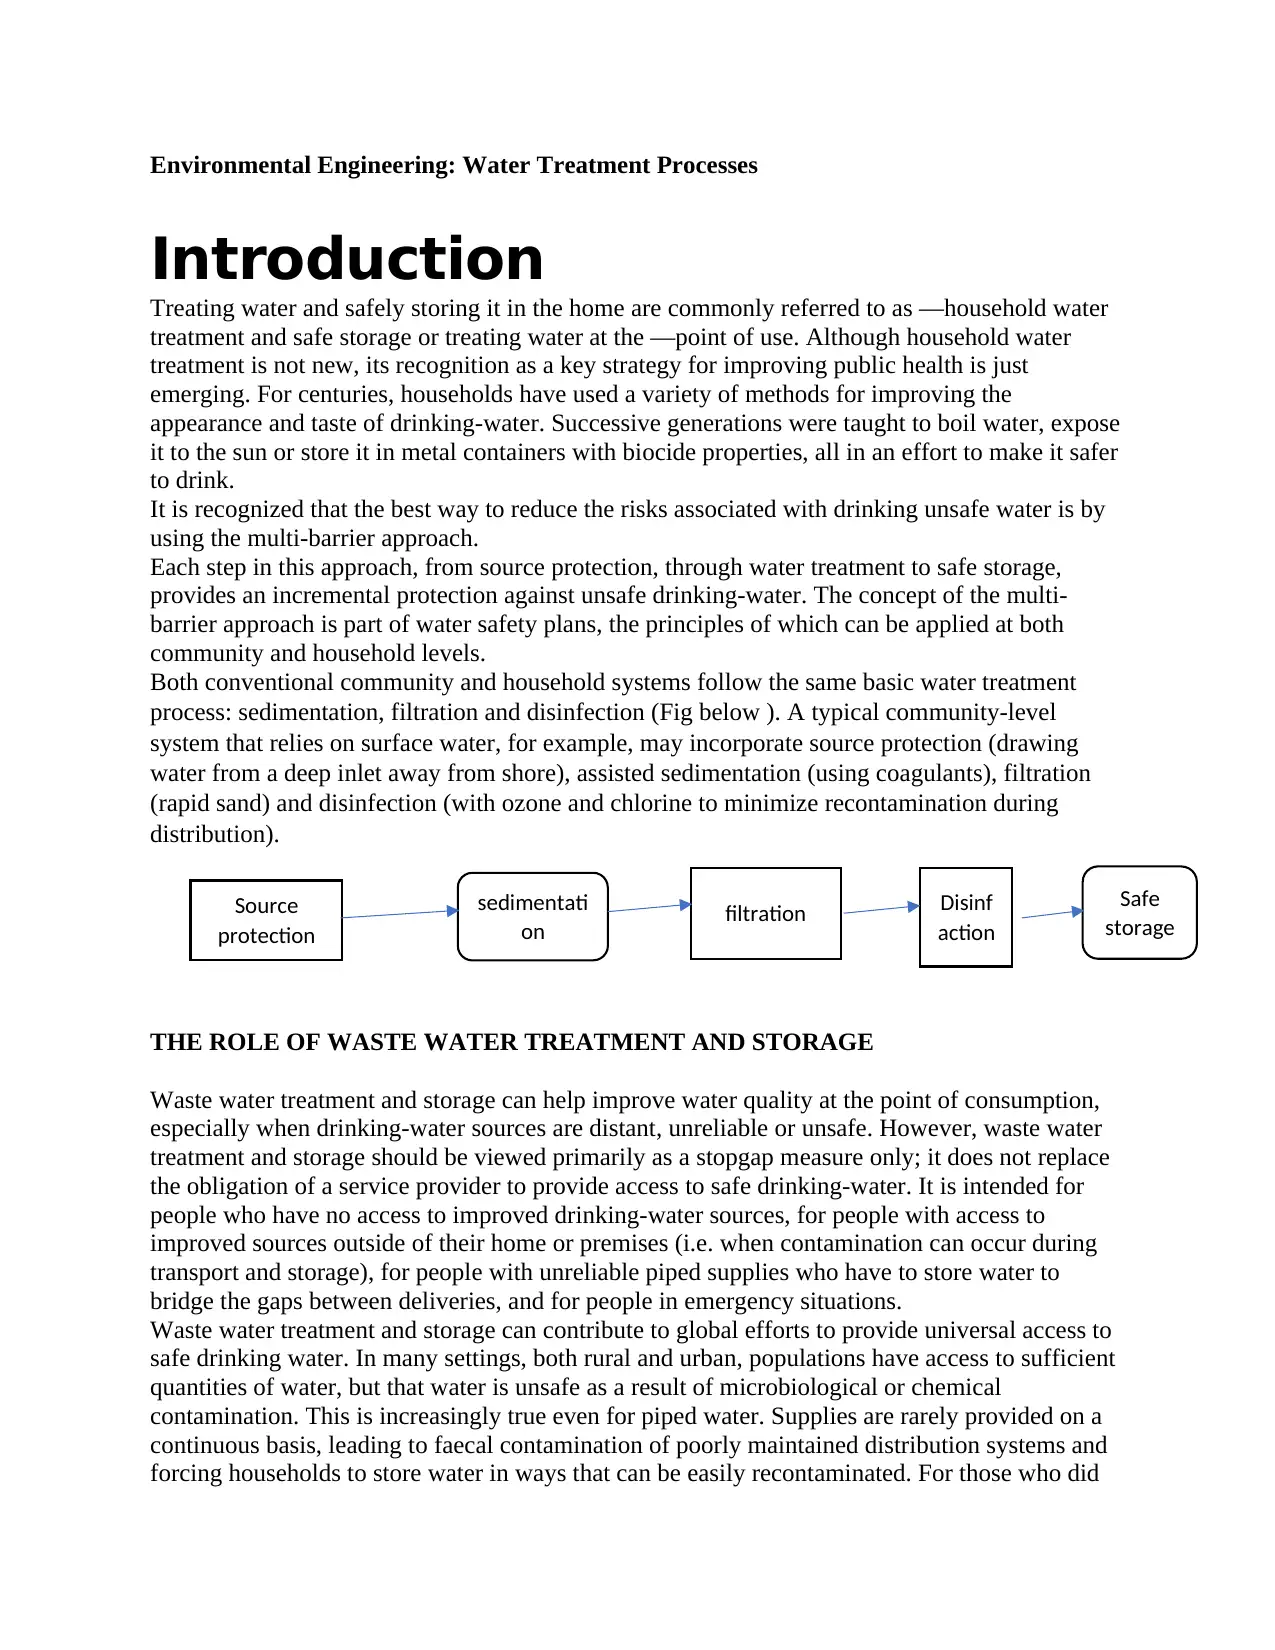
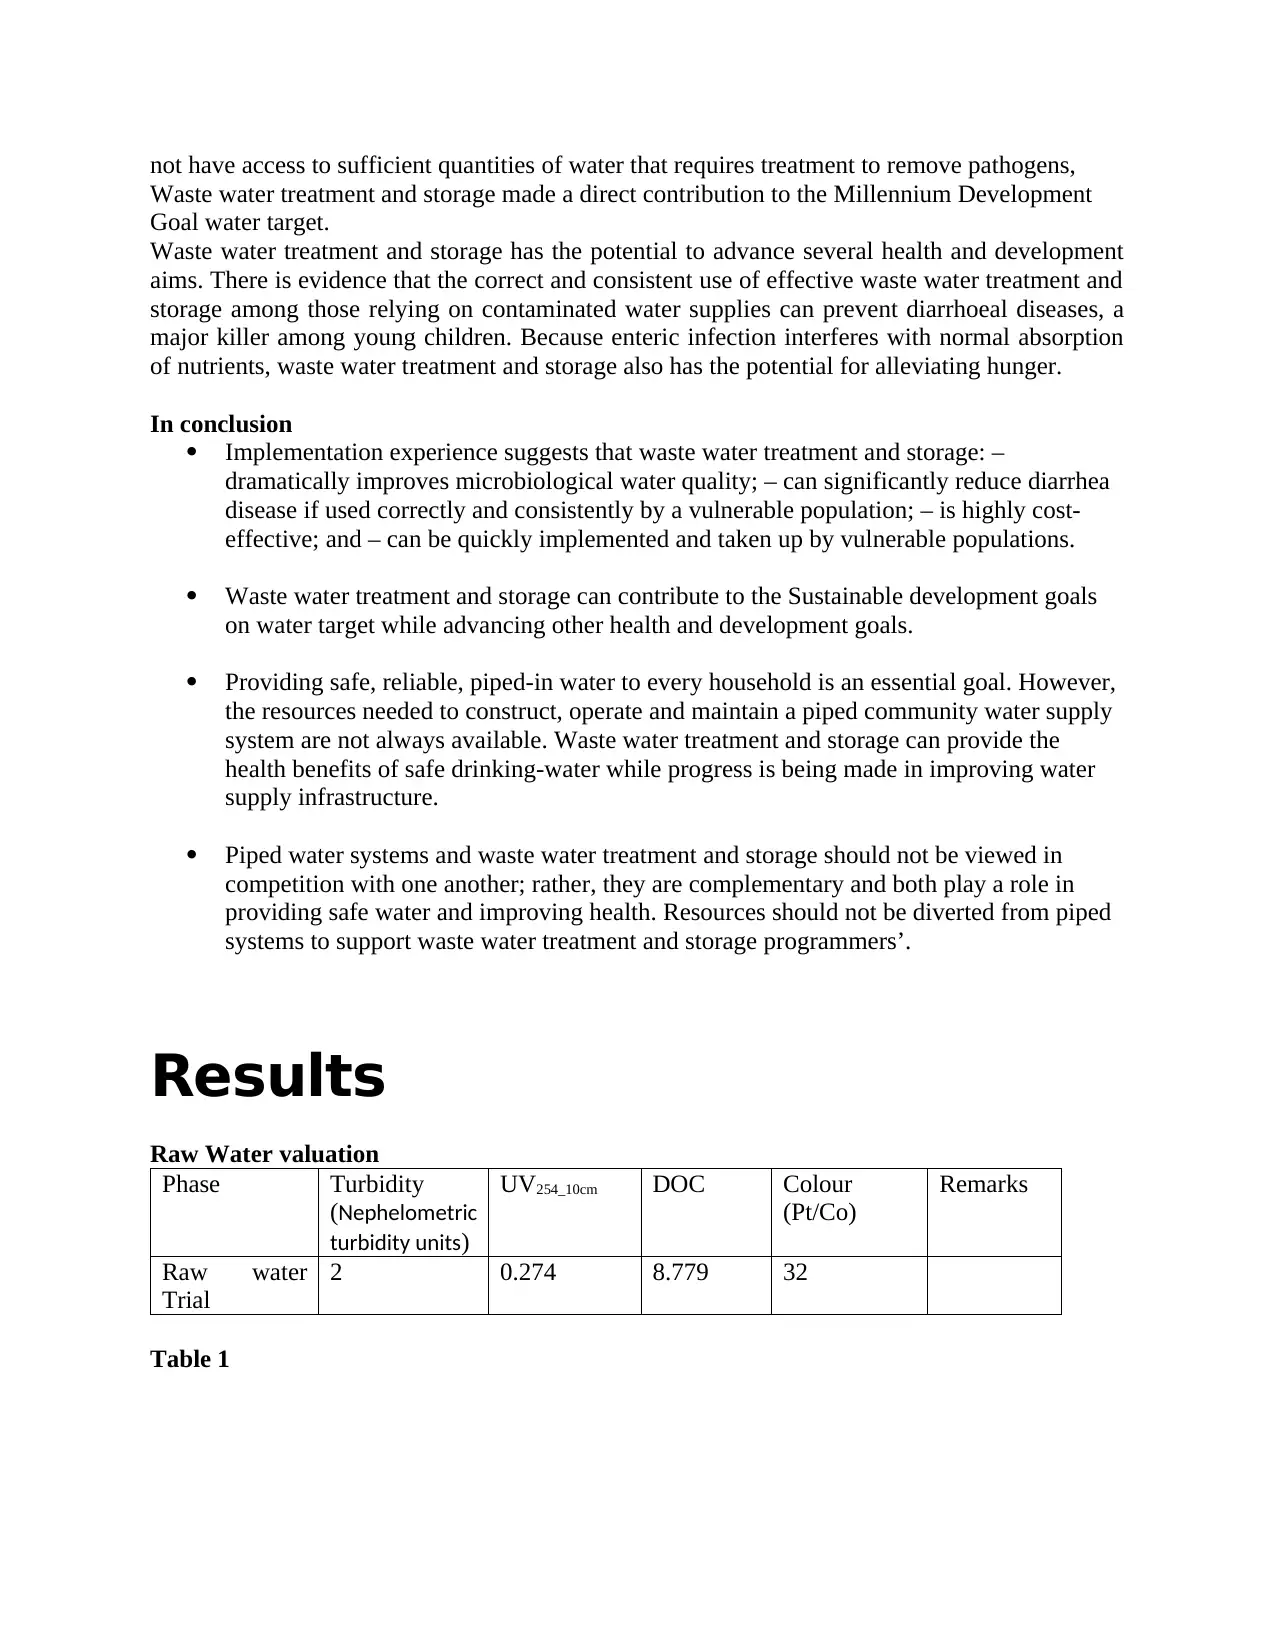
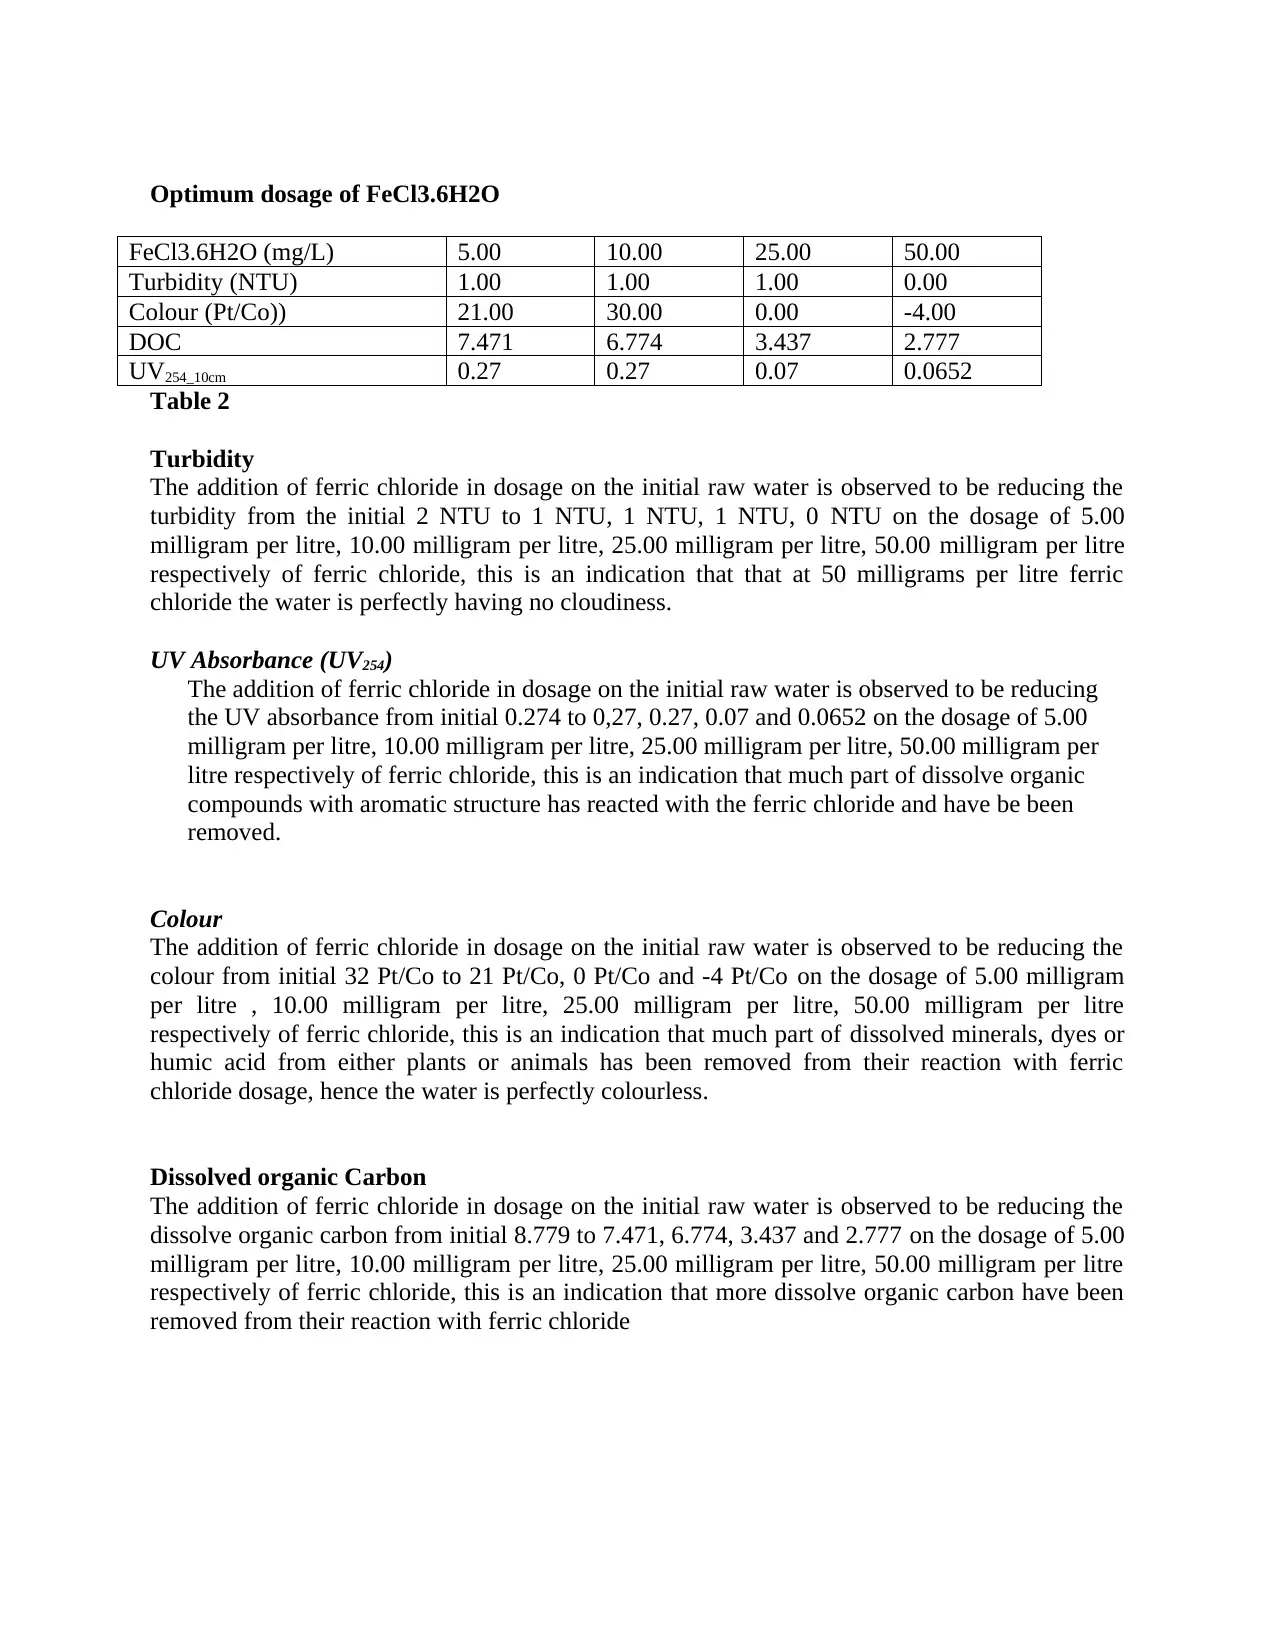
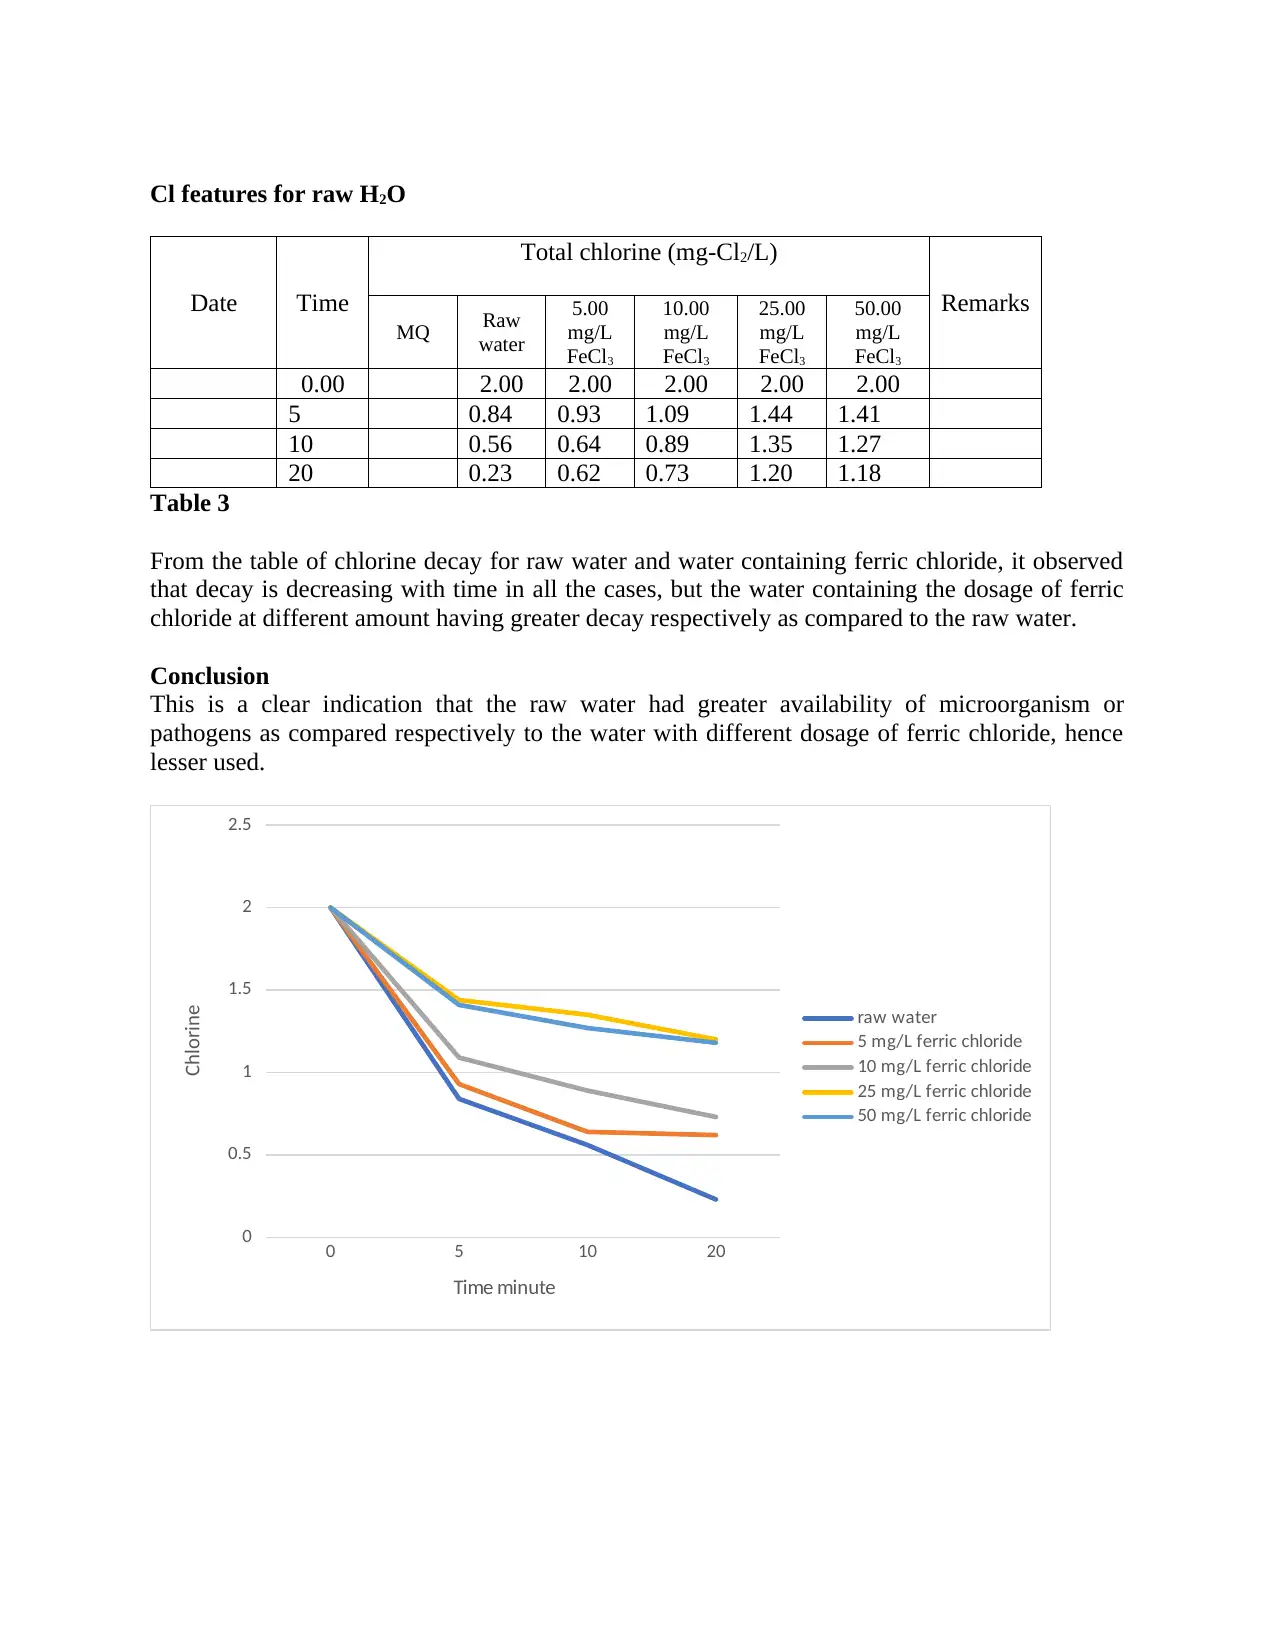
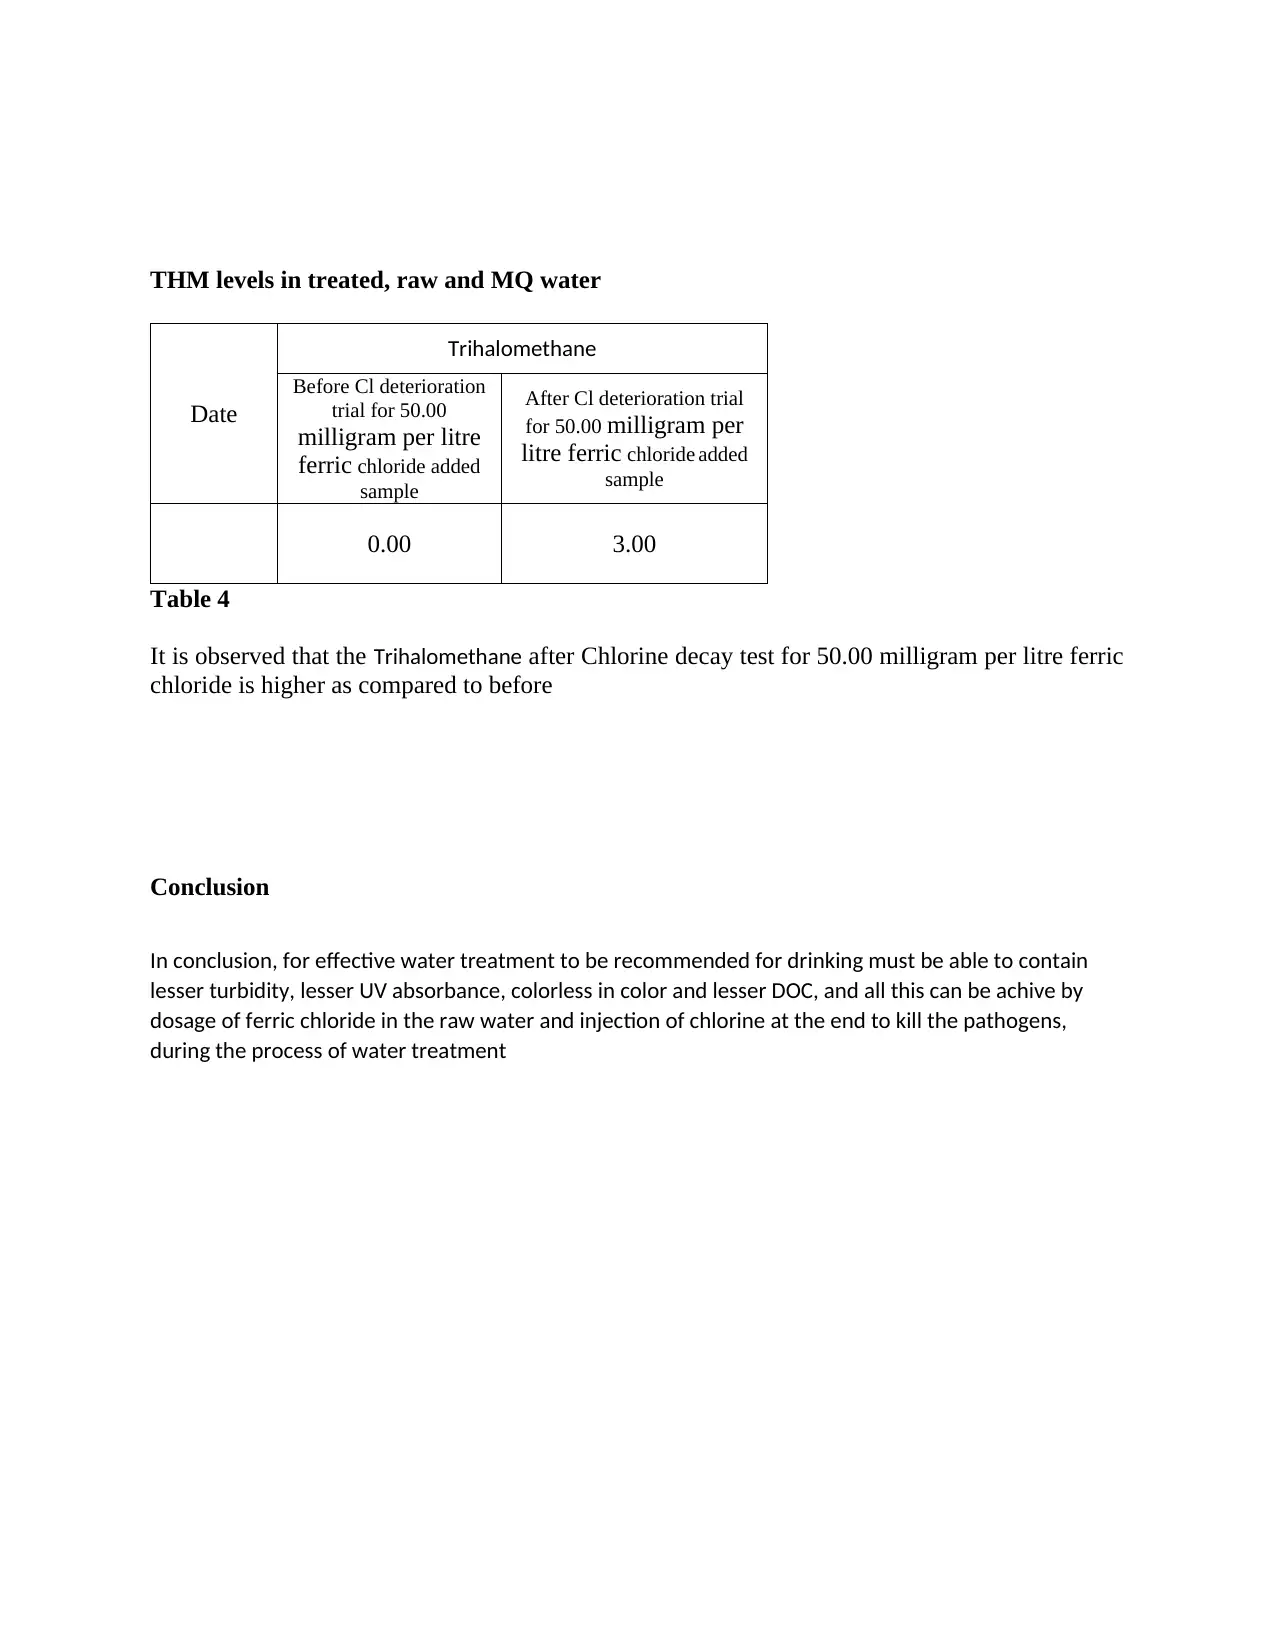
This report provides a detailed overview of water treatment processes, focusing on both household and community-level applications. It explores the multi-barrier approach, emphasizing the importance of source protection, water treatment (sedimentation, filtration, and disinfection), and safe storage. The report highlights the role of wastewater treatment and storage as a crucial stopgap measure, particularly in situations where access to safe drinking water is limited. It presents data on raw water quality assessment, including turbidity, UV absorbance, color, and dissolved organic carbon (DOC) levels. The report examines the impact of ferric chloride dosage on water quality parameters, showing its effectiveness in reducing turbidity, UV absorbance, and DOC, as well as improving water color. Furthermore, it analyzes chlorine decay in raw water and water treated with ferric chloride, demonstrating the importance of disinfection. The report concludes with recommendations for effective water treatment, emphasizing the need for comprehensive processes to ensure safe and potable water, alongside a discussion on the role of water treatment in achieving sustainable development goals.

Environmental Engineering: Water Treatment Processes
Introduction
Treating water and safely storing it in the home are commonly referred to as ―household water
treatment and safe storage or treating water at the ―point of use. Although household water
treatment is not new, its recognition as a key strategy for improving public health is just
emerging. For centuries, households have used a variety of methods for improving the
appearance and taste of drinking-water. Successive generations were taught to boil water, expose
it to the sun or store it in metal containers with biocide properties, all in an effort to make it safer
to drink.
It is recognized that the best way to reduce the risks associated with drinking unsafe water is by
using the multi-barrier approach.
Each step in this approach, from source protection, through water treatment to safe storage,
provides an incremental protection against unsafe drinking-water. The concept of the multi-
barrier approach is part of water safety plans, the principles of which can be applied at both
community and household levels.
Both conventional community and household systems follow the same basic water treatment
process: sedimentation, filtration and disinfection (Fig below ). A typical community-level
system that relies on surface water, for example, may incorporate source protection (drawing
water from a deep inlet away from shore), assisted sedimentation (using coagulants), filtration
(rapid sand) and disinfection (with ozone and chlorine to minimize recontamination during
distribution).
THE ROLE OF WASTE WATER TREATMENT AND STORAGE
Waste water treatment and storage can help improve water quality at the point of consumption,
especially when drinking-water sources are distant, unreliable or unsafe. However, waste water
treatment and storage should be viewed primarily as a stopgap measure only; it does not replace
the obligation of a service provider to provide access to safe drinking-water. It is intended for
people who have no access to improved drinking-water sources, for people with access to
improved sources outside of their home or premises (i.e. when contamination can occur during
transport and storage), for people with unreliable piped supplies who have to store water to
bridge the gaps between deliveries, and for people in emergency situations.
Waste water treatment and storage can contribute to global efforts to provide universal access to
safe drinking water. In many settings, both rural and urban, populations have access to sufficient
quantities of water, but that water is unsafe as a result of microbiological or chemical
contamination. This is increasingly true even for piped water. Supplies are rarely provided on a
continuous basis, leading to faecal contamination of poorly maintained distribution systems and
forcing households to store water in ways that can be easily recontaminated. For those who did
Source
protection
sedimentati
on filtration Disinf
action
Safe
storage
Paraphrase This Document
Need a fresh take? Get an instant paraphrase of this document with our AI Paraphraser

not have access to sufficient quantities of water that requires treatment to remove pathogens,
Waste water treatment and storage made a direct contribution to the Millennium Development
Goal water target.
Waste water treatment and storage has the potential to advance several health and development
aims. There is evidence that the correct and consistent use of effective waste water treatment and
storage among those relying on contaminated water supplies can prevent diarrhoeal diseases, a
major killer among young children. Because enteric infection interferes with normal absorption
of nutrients, waste water treatment and storage also has the potential for alleviating hunger.
In conclusion
Implementation experience suggests that waste water treatment and storage: ‒
dramatically improves microbiological water quality; ‒ can significantly reduce diarrhea
disease if used correctly and consistently by a vulnerable population; ‒ is highly cost-
effective; and ‒ can be quickly implemented and taken up by vulnerable populations.
Waste water treatment and storage can contribute to the Sustainable development goals
on water target while advancing other health and development goals.
Providing safe, reliable, piped-in water to every household is an essential goal. However,
the resources needed to construct, operate and maintain a piped community water supply
system are not always available. Waste water treatment and storage can provide the
health benefits of safe drinking-water while progress is being made in improving water
supply infrastructure.
Piped water systems and waste water treatment and storage should not be viewed in
competition with one another; rather, they are complementary and both play a role in
providing safe water and improving health. Resources should not be diverted from piped
systems to support waste water treatment and storage programmers’.
Results
Raw Water valuation
Phase Turbidity
(Nephelometric
turbidity units)
UV254_10cm DOC Colour
(Pt/Co)
Remarks
Raw water
Trial
2 0.274 8.779 32
Table 1

Turbidity
From this initial raw water quality assessment, there is a clear detection of greater turbidity of
2.00 NTU as measured using HACH2100 Turbidimeter, this is an indication that there is a
greater availability and presence of very fine clay particles.
Hence, this water is not recommended for drinking until its purification takes place, since the
proportion for turbidity for conducive water to be taken is supposed to be less than 0.1
Nephelometric turbidity units
UV Absorbance (UV254)
From this initial raw water quality assessment, there is greater indication that the raw water
contains dissolve organic compounds with aromatic structures from natural organic
materials, as per the record of 0.274, the water hence in recommendation is not suitable for
drinking until the purification procedure takes place.
Colour
from the record of the initial quality assessment of raw water the water colour is found to be 32
Pt/Co, hence the water is able to absorb the light in the visible spectra range, a clear indication
that the water contains dissolved minerals, dyes or humic acid from either plants or animals,
water state is not recommended for drinking since recommended drinking water should contain
below 3 Pt/Co
Dissolved organic Carbon
From the record of the initial water assessment quality the DOC recorded is 8.779, this is a clear
indication that the water contains more dissolved organic carbon, hence the water is not
recommended for drinking
⊘ This is a preview!⊘
Do you want full access?
Subscribe today to unlock all pages.

Trusted by 1+ million students worldwide

Optimum dosage of FeCl3.6H2O
FeCl3.6H2O (mg/L) 5.00 10.00 25.00 50.00
Turbidity (NTU) 1.00 1.00 1.00 0.00
Colour (Pt/Co)) 21.00 30.00 0.00 -4.00
DOC 7.471 6.774 3.437 2.777
UV254_10cm 0.27 0.27 0.07 0.0652
Table 2
Turbidity
The addition of ferric chloride in dosage on the initial raw water is observed to be reducing the
turbidity from the initial 2 NTU to 1 NTU, 1 NTU, 1 NTU, 0 NTU on the dosage of 5.00
milligram per litre, 10.00 milligram per litre, 25.00 milligram per litre, 50.00 milligram per litre
respectively of ferric chloride, this is an indication that that at 50 milligrams per litre ferric
chloride the water is perfectly having no cloudiness.
UV Absorbance (UV254)
The addition of ferric chloride in dosage on the initial raw water is observed to be reducing
the UV absorbance from initial 0.274 to 0,27, 0.27, 0.07 and 0.0652 on the dosage of 5.00
milligram per litre, 10.00 milligram per litre, 25.00 milligram per litre, 50.00 milligram per
litre respectively of ferric chloride, this is an indication that much part of dissolve organic
compounds with aromatic structure has reacted with the ferric chloride and have be been
removed.
Colour
The addition of ferric chloride in dosage on the initial raw water is observed to be reducing the
colour from initial 32 Pt/Co to 21 Pt/Co, 0 Pt/Co and -4 Pt/Co on the dosage of 5.00 milligram
per litre , 10.00 milligram per litre, 25.00 milligram per litre, 50.00 milligram per litre
respectively of ferric chloride, this is an indication that much part of dissolved minerals, dyes or
humic acid from either plants or animals has been removed from their reaction with ferric
chloride dosage, hence the water is perfectly colourless.
Dissolved organic Carbon
The addition of ferric chloride in dosage on the initial raw water is observed to be reducing the
dissolve organic carbon from initial 8.779 to 7.471, 6.774, 3.437 and 2.777 on the dosage of 5.00
milligram per litre, 10.00 milligram per litre, 25.00 milligram per litre, 50.00 milligram per litre
respectively of ferric chloride, this is an indication that more dissolve organic carbon have been
removed from their reaction with ferric chloride
Paraphrase This Document
Need a fresh take? Get an instant paraphrase of this document with our AI Paraphraser

Graphical presentation of impact on ferric chloride on the raw water
5 mg/L 10 mg/L 25 mg/L 50 mg/L
0
5
10
15
20
25
30
35
Turbidity (NTU)
colour (Pt/Co)
DOC
UV
Axis Title
Axis Title
5 mg/L 10 mg/L 25 mg/L 50 mg/L
0
5
10
15
20
25
30
35
Turbidity (NTU)
colour (Pt/Co)
DOC
UV
Axis Title
Axis Title

Cl features for raw H2O
Date Time
Total chlorine (mg-Cl2/L)
Remarks
MQ Raw
water
5.00
mg/L
FeCl3
10.00
mg/L
FeCl3
25.00
mg/L
FeCl3
50.00
mg/L
FeCl3
0.00 2.00 2.00 2.00 2.00 2.00
5 0.84 0.93 1.09 1.44 1.41
10 0.56 0.64 0.89 1.35 1.27
20 0.23 0.62 0.73 1.20 1.18
Table 3
From the table of chlorine decay for raw water and water containing ferric chloride, it observed
that decay is decreasing with time in all the cases, but the water containing the dosage of ferric
chloride at different amount having greater decay respectively as compared to the raw water.
Conclusion
This is a clear indication that the raw water had greater availability of microorganism or
pathogens as compared respectively to the water with different dosage of ferric chloride, hence
lesser used.
0 5 10 20
0
0.5
1
1.5
2
2.5
raw water
5 mg/L ferric chloride
10 mg/L ferric chloride
25 mg/L ferric chloride
50 mg/L ferric chloride
Time minute
Chlorine
⊘ This is a preview!⊘
Do you want full access?
Subscribe today to unlock all pages.

Trusted by 1+ million students worldwide

THM levels in treated, raw and MQ water
Date
Trihalomethane
Before Cl deterioration
trial for 50.00
milligram per litre
ferric chloride added
sample
After Cl deterioration trial
for 50.00 milligram per
litre ferric chloride added
sample
0.00 3.00
Table 4
It is observed that the Trihalomethane after Chlorine decay test for 50.00 milligram per litre ferric
chloride is higher as compared to before
Conclusion
In conclusion, for effective water treatment to be recommended for drinking must be able to contain
lesser turbidity, lesser UV absorbance, colorless in color and lesser DOC, and all this can be achive by
dosage of ferric chloride in the raw water and injection of chlorine at the end to kill the pathogens,
during the process of water treatment
1 out of 7
Related Documents
Your All-in-One AI-Powered Toolkit for Academic Success.
+13062052269
info@desklib.com
Available 24*7 on WhatsApp / Email
Unlock your academic potential
Copyright © 2020–2025 A2Z Services. All Rights Reserved. Developed and managed by ZUCOL.


