EOQ, ROP, and Safety Stock Analysis - Finance Assignment

Verified

Added on  2019/10/16

|3
|285
|147
Homework Assignment
AI Summary
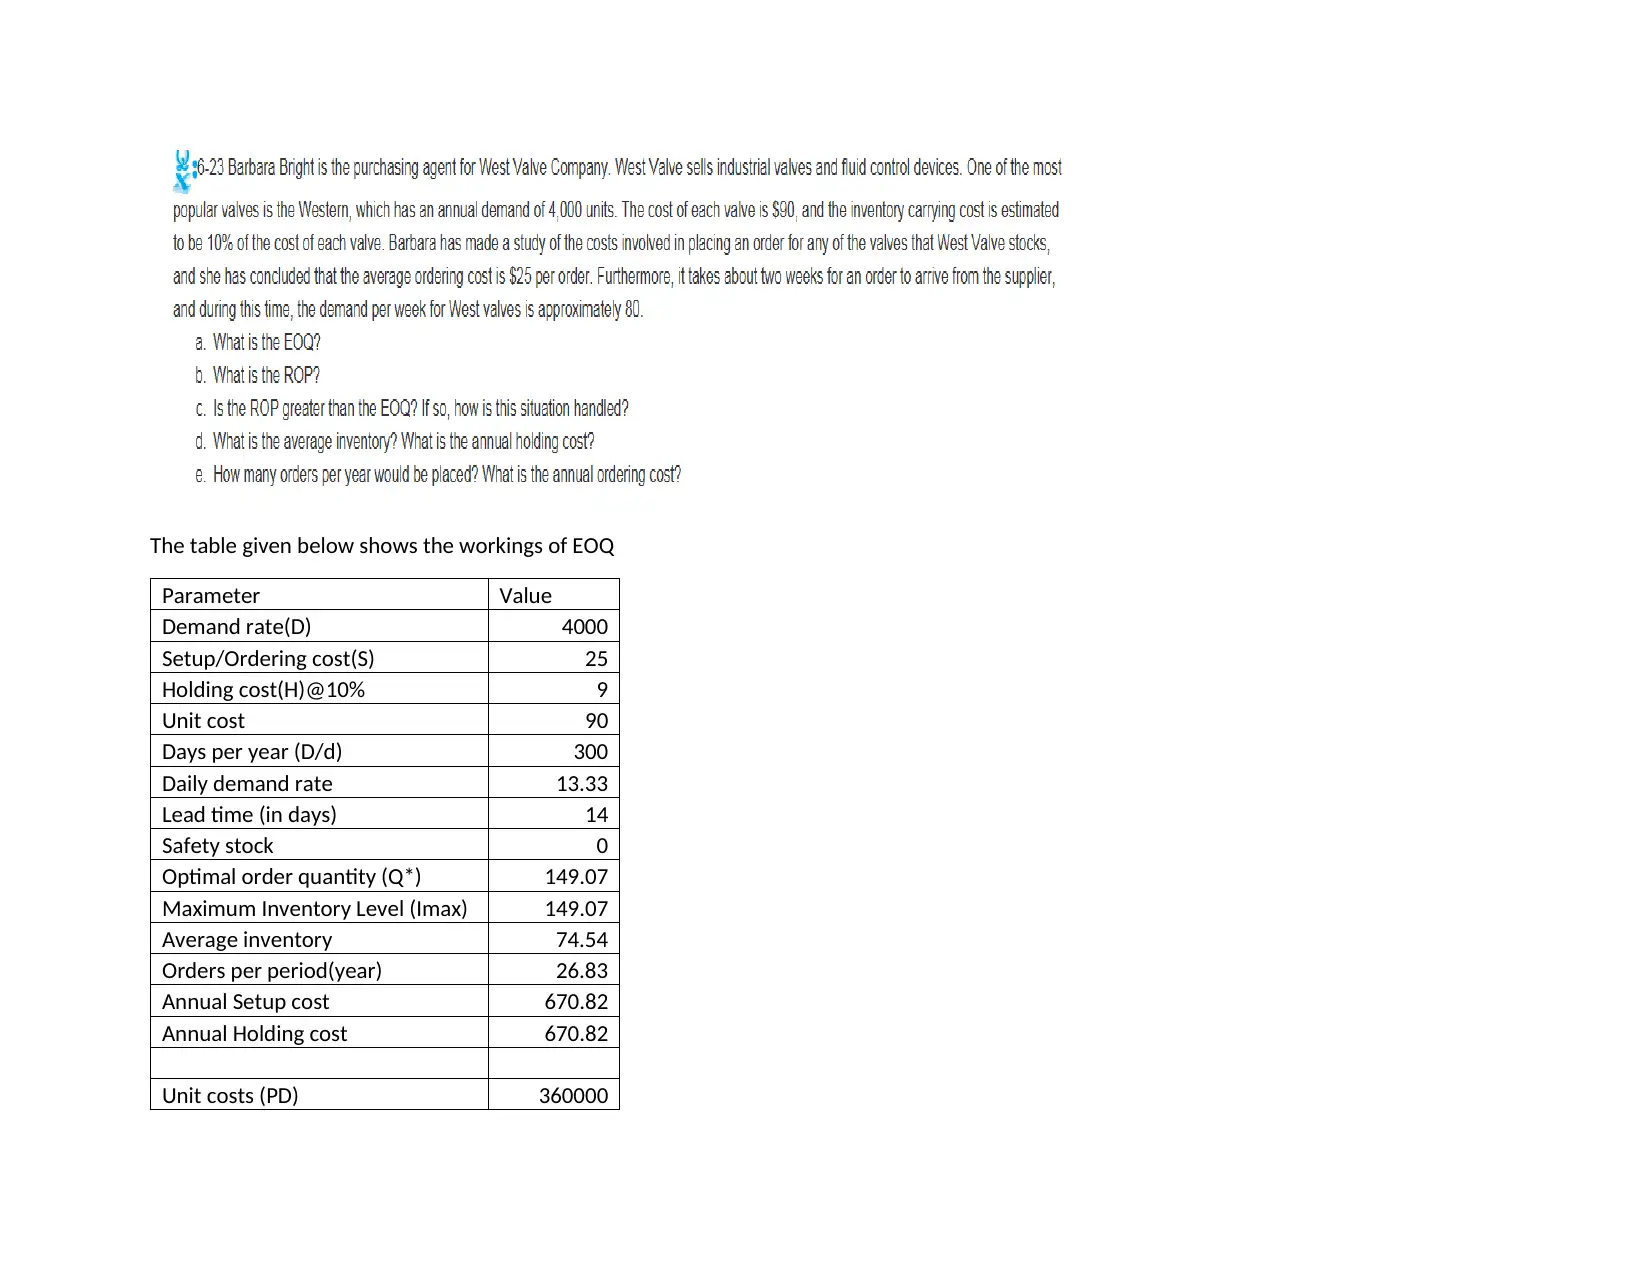
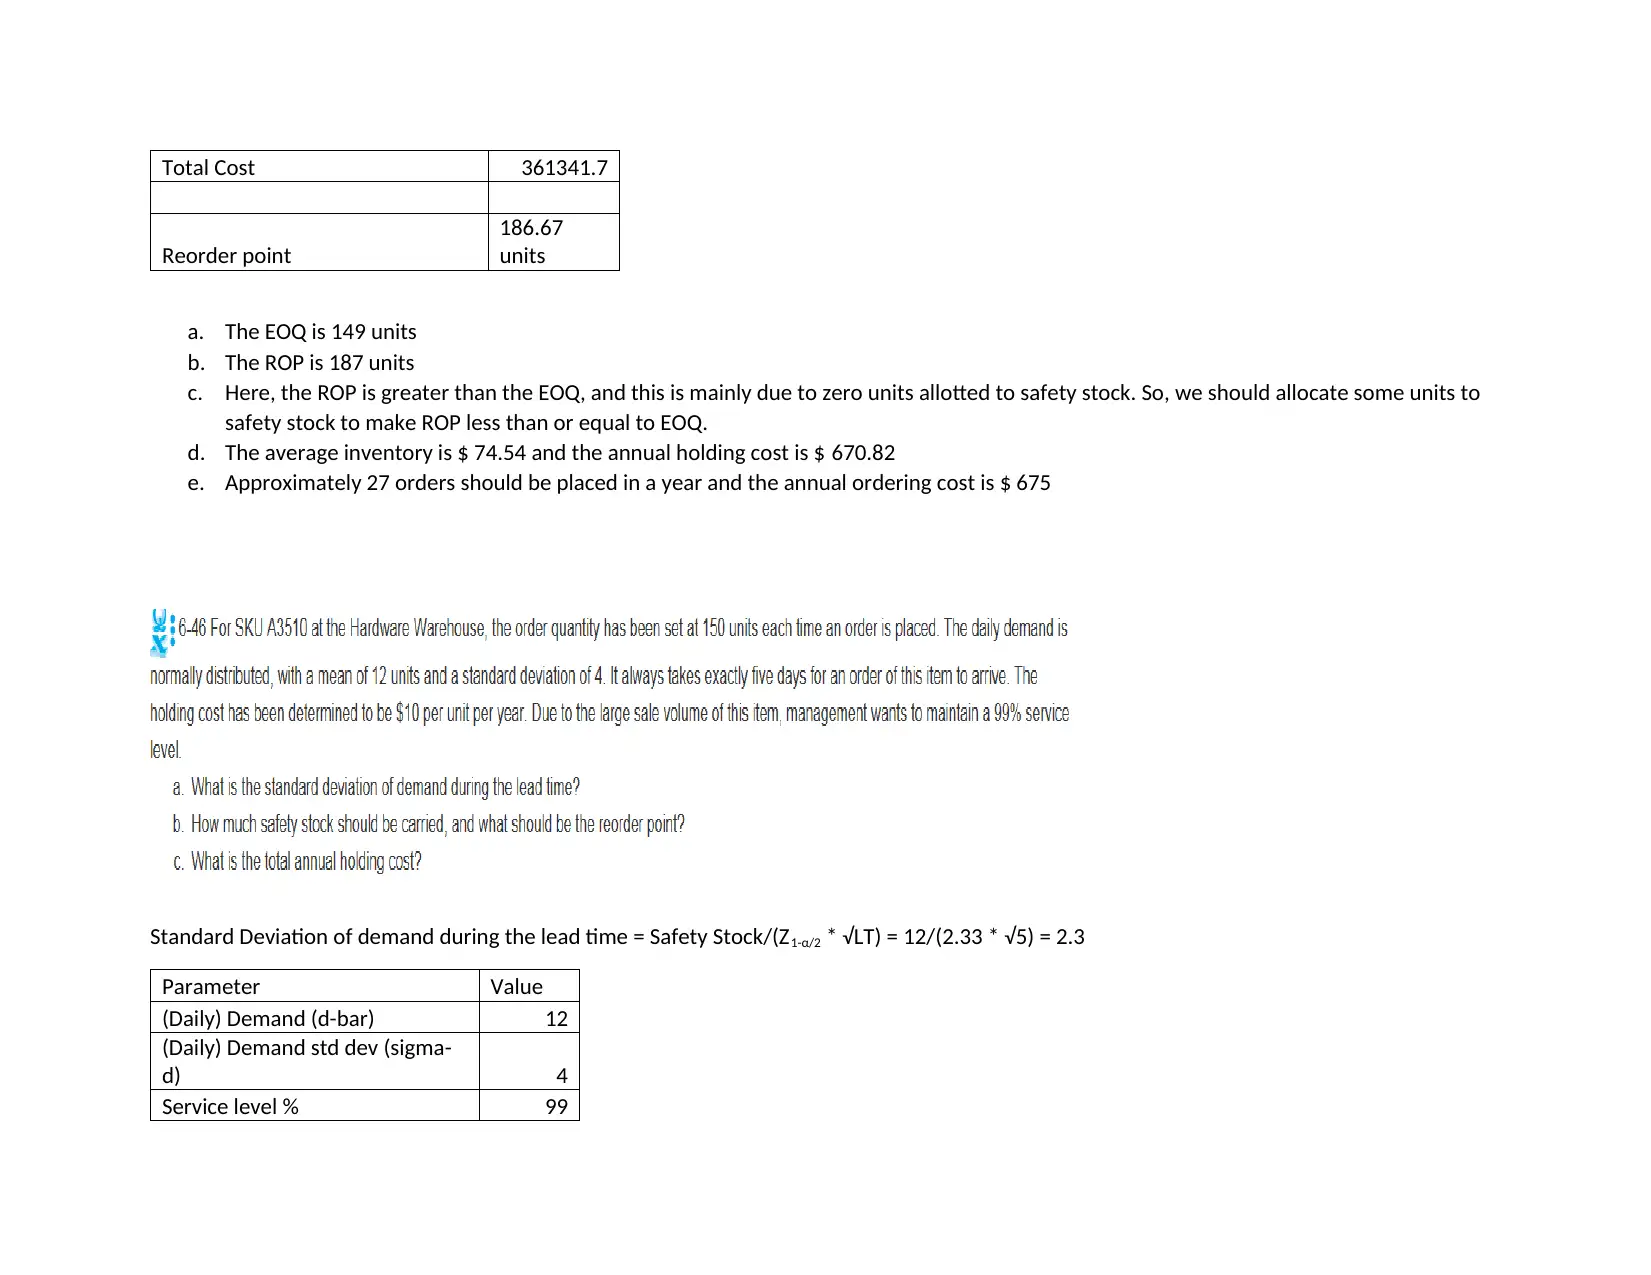
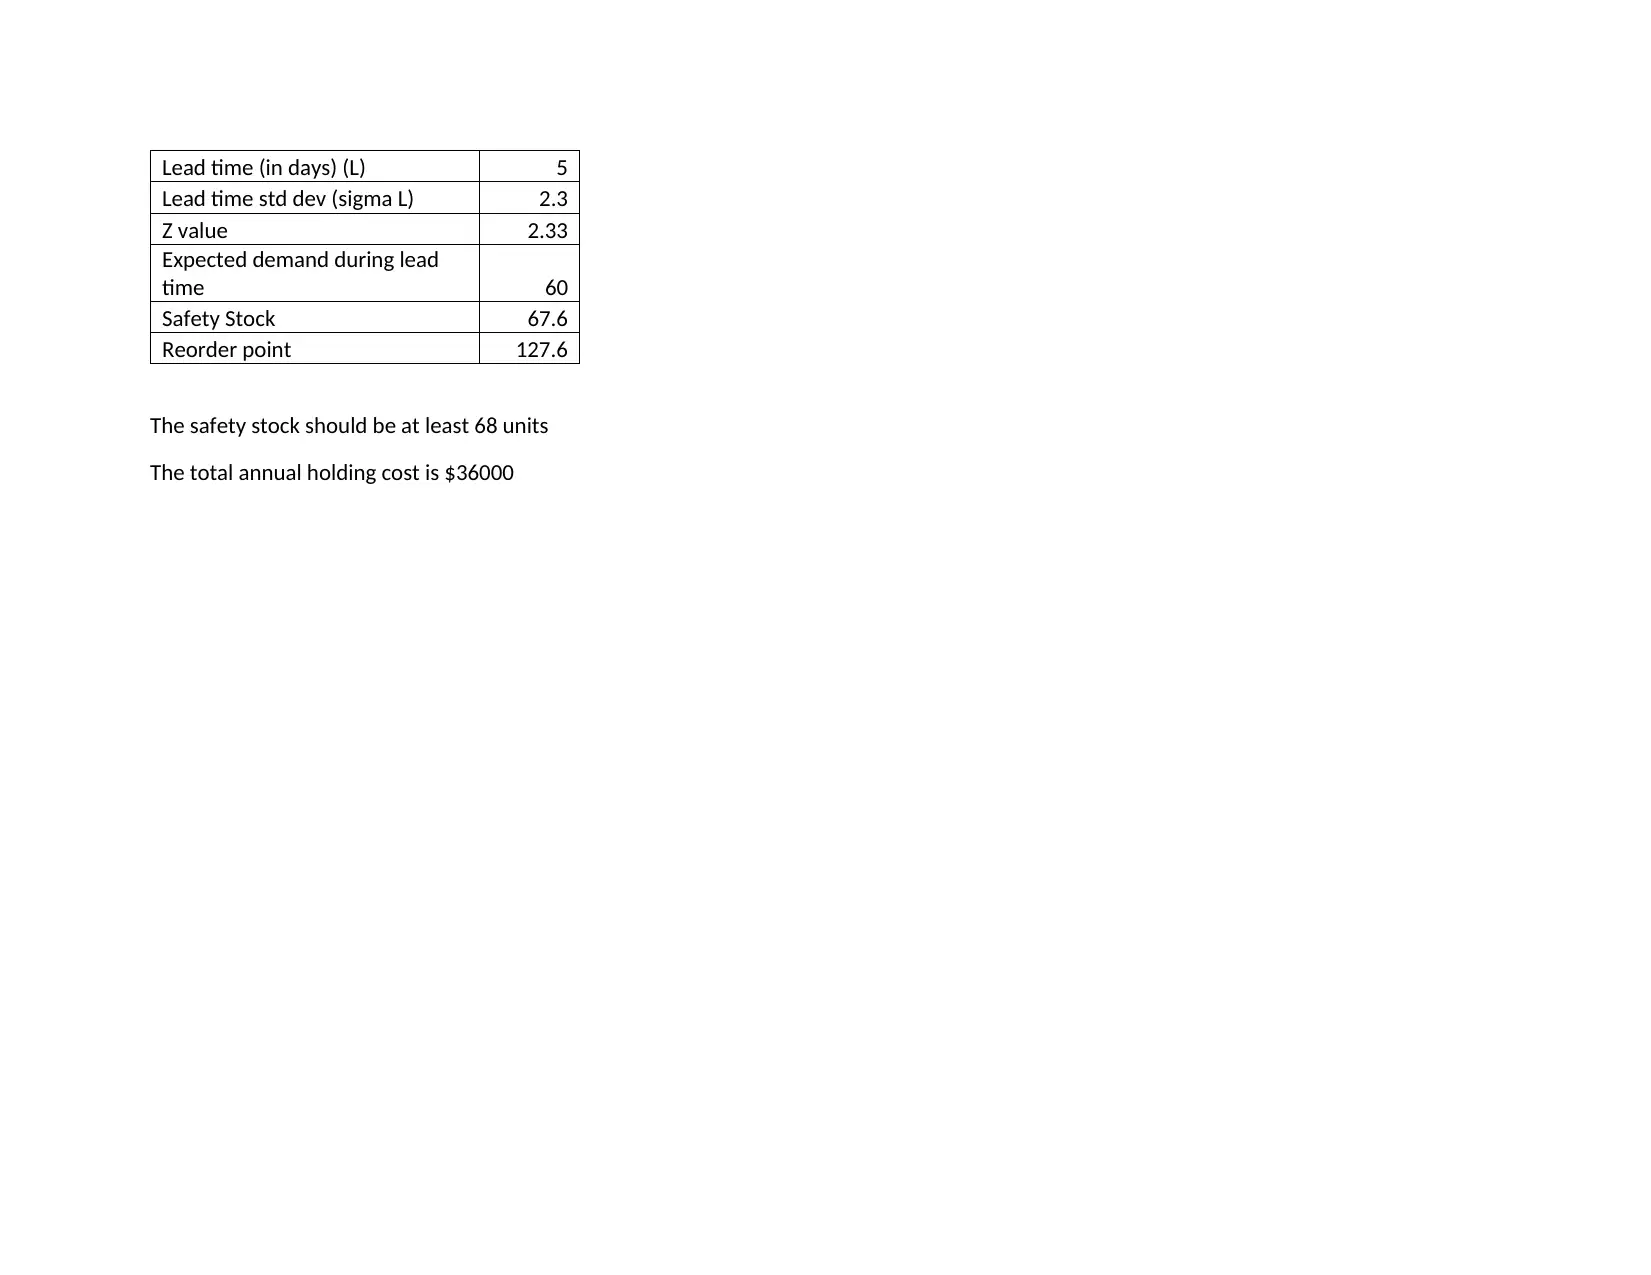
This assignment focuses on the Economic Order Quantity (EOQ) model, reorder points (ROP), and safety stock calculations. The solution presents the calculations for EOQ, the number of orders per year, and the total annual costs. It includes a breakdown of the parameters, such as demand rate, setup costs, holding costs, and lead time. The assignment highlights the importance of safety stock and its impact on the ROP. The solution calculates the safety stock needed to meet a specific service level and the revised ROP. The assignment also provides the average inventory level, annual holding cost, and annual ordering cost, demonstrating the application of EOQ principles in inventory management. The final section calculates the expected demand during lead time and the safety stock required to maintain a desired service level.
Document Page
The table given below shows the workings of EOQ
Parameter Value
Demand rate(D) 4000
Setup/Ordering cost(S) 25
Holding cost(H)@10% 9
Unit cost 90
Days per year (D/d) 300
Daily demand rate 13.33
Lead time (in days) 14
Safety stock 0
Optimal order quantity (Q*) 149.07
Maximum Inventory Level (Imax) 149.07
Average inventory 74.54
Orders per period(year) 26.83
Annual Setup cost 670.82
Annual Holding cost 670.82
Unit costs (PD) 360000
tabler-icon-diamond-filled.svg

Paraphrase This Document

Need a fresh take? Get an instant paraphrase of this document with our AI Paraphraser
Document Page
Total Cost 361341.7
Reorder point
186.67
units
a. The EOQ is 149 units
b. The ROP is 187 units
c. Here, the ROP is greater than the EOQ, and this is mainly due to zero units allotted to safety stock. So, we should allocate some units to
safety stock to make ROP less than or equal to EOQ.
d. The average inventory is $ 74.54 and the annual holding cost is $ 670.82
e. Approximately 27 orders should be placed in a year and the annual ordering cost is $ 675
Standard Deviation of demand during the lead time = Safety Stock/(Z1-α/2 * √LT) = 12/(2.33 * √5) = 2.3
Parameter Value
(Daily) Demand (d-bar) 12
(Daily) Demand std dev (sigma-
d) 4
Service level % 99
Document Page
Lead time (in days) (L) 5
Lead time std dev (sigma L) 2.3
Z value 2.33
Expected demand during lead
time 60
Safety Stock 67.6
Reorder point 127.6
The safety stock should be at least 68 units
The total annual holding cost is $36000
chevron_up_icon
1 out of 3
circle_padding
hide_on_mobile
zoom_out_icon
[object Object]