Public Health Assignment: Epidemiological Study Analysis, Coursework
VerifiedAdded on 2023/06/05
|8
|2299
|302
Homework Assignment
AI Summary
This assignment analyzes several epidemiological studies. The first part focuses on a cohort study examining the long-term effects of physical activity on coronary heart disease, including study design, data sources, and risk calculations. The second part presents a case-control study on dietary intake and skin cancer, calculating relative and attributable risks. The third section assesses the association between disease and exposure, including stratified analysis and interpretation. The final sections discuss biases in cohort and case-control studies, and methods for addressing confounding factors and participant loss. The assignment demonstrates understanding of study designs, data analysis, and interpretation of epidemiological research, including the identification of biases and confounding factors.

University
Task
ASSIGNMENT 2
Date
Task
ASSIGNMENT 2
Date
Paraphrase This Document
Need a fresh take? Get an instant paraphrase of this document with our AI Paraphraser
Research study
Sundquist, K., Qvist, J., Johansson, S. E., & Sundquist, J. (2005). The long-term
effect of physical activity on incidence of coronary heart disease: a 12-year
follow-up study. Preventive medicine, 41(1), 219-225.
Question 1
(a) The study design chosen for this study is [1 mark]
- A cohort study utilizing prospective study. This study follows individuals
with similar characteristics and thus is a prospective study. The indicators
which make it a cohort study are the association between the cause and
effect under study. The outcomes were assessed as the study progressed.
(b) Data source chosen was obtained through ... [2 points
- Data source chosen was the Swedish national discharge register data source
was used to identify the disease from the respondents.
(c) Exclusion of the 1984 respondents was done by the authors to achieve the
following reasons [2 points]
- The study authors excluded these participants intentionally as it could be a
source of a confounding factor affecting the disease interest of concern.
Respondents with other underlying issues could lead to coronary heart
disease being linked to other factors not related to the actual causative
factors being investigated.
(d) The overall crude incidence in the study can be stated as [2 points]
- The overall crude incidence rate was 59 cases per 10,000 persons over
physical activity levels.
(e) Comparison of relative risks of not undertaking any physical; exercise to that
of exercise engagement twice a week for both low income and all income
earners can be achieved through [4 points]
- Calculation of the risks obtained at 95% confidence level shows that
physical activity of twice daily had RR of 0.72 (CI 0.52-1.01) compared to
low-income earners having RR of 1.20 (0.95-1.52) and those of all other
income earners at RR equals to 1.
(f) The relative risk in the above question can be interpreted as [3 points]
- The exposure of undertaking physical activity two times a week
accompanied with reduced disease exposure of coronary heart disease
development.
- The Low-income category was associated with getting the risk of
developing coronary heart disease, hence being categorized as low-income
earner having a greater risk of developing coronary heart disease, whereas
other income category had no development of effect on disease
emergence.
(g) The relative risks in this study are best described as risk ratio because [2
points]
- Risk ratio is described as the likelihood of an outcome in the exposed rank
to the probable outcome of the exposed category while rate ratio refers to
comparing rates of events taking place at any given time. The study can be
best explained in terms of risks ratio in that it is assessed on the risks of
developing coronary heart disease to factors such as physical activity,
income, smoking and BMI assessments for the respondents. Hence the
established strength of association on the risks and outcome of coronary
heart disease.
(h) The major confounders which were not included in this study include the
following [4 points]
- The major confounders which could have been a factor in this study
include hyperlipidemia diabetes and hypertension. Hyperlipidemia, which
has been considered as a powerful indicator of coronary heart disease, with
the positive association being linked to cholesterol levels. Also,
hypertension is a major confounding factor towards the growth and
development of CHD. High blood pressure is a strongly independent factor
which is a risk factor for the development of coronary heart disease
causing morbidity and mortality.
- Lastly, diabetes mellitus is another major confounding factor. Diabetes has
been attributed to related to increased risk of CHD and it could be a
possible factor in the development of CHD in the study population.
-
(i) The authors of the study could not adjust for these confounders due to the
following reasons [4 points]
-
- The study design adopted indicates criteria of ensuring that the
respondents which valued their health state being poor were not included
in the study, and thus this could limit the mentioned confounding factors
mentioned above such as hypertension, hyper, and diabetes. Thus this
criterion limited the authors in adjusting for these confounding factors this
indicated that the poor self-rated individuals in the study were not included
to participate in the study. Further, since the prospective study was
followed for over ten years, the respondents could have developed this
disease and be an exposure factor not confounded for at the end of the
study.
Question 2:
Case-control case study.
Hypothesis; people with low dietary intake are more susceptible to skin cancer.
Comparison group
- Cancer cases 500
- Case-control 500
Dietary intake – cases
- Low intake 150
- High intake 80
Control
- Low intake 130
- High intake 100
⊘ This is a preview!⊘
Do you want full access?
Subscribe today to unlock all pages.
Trusted by 1+ million students worldwide
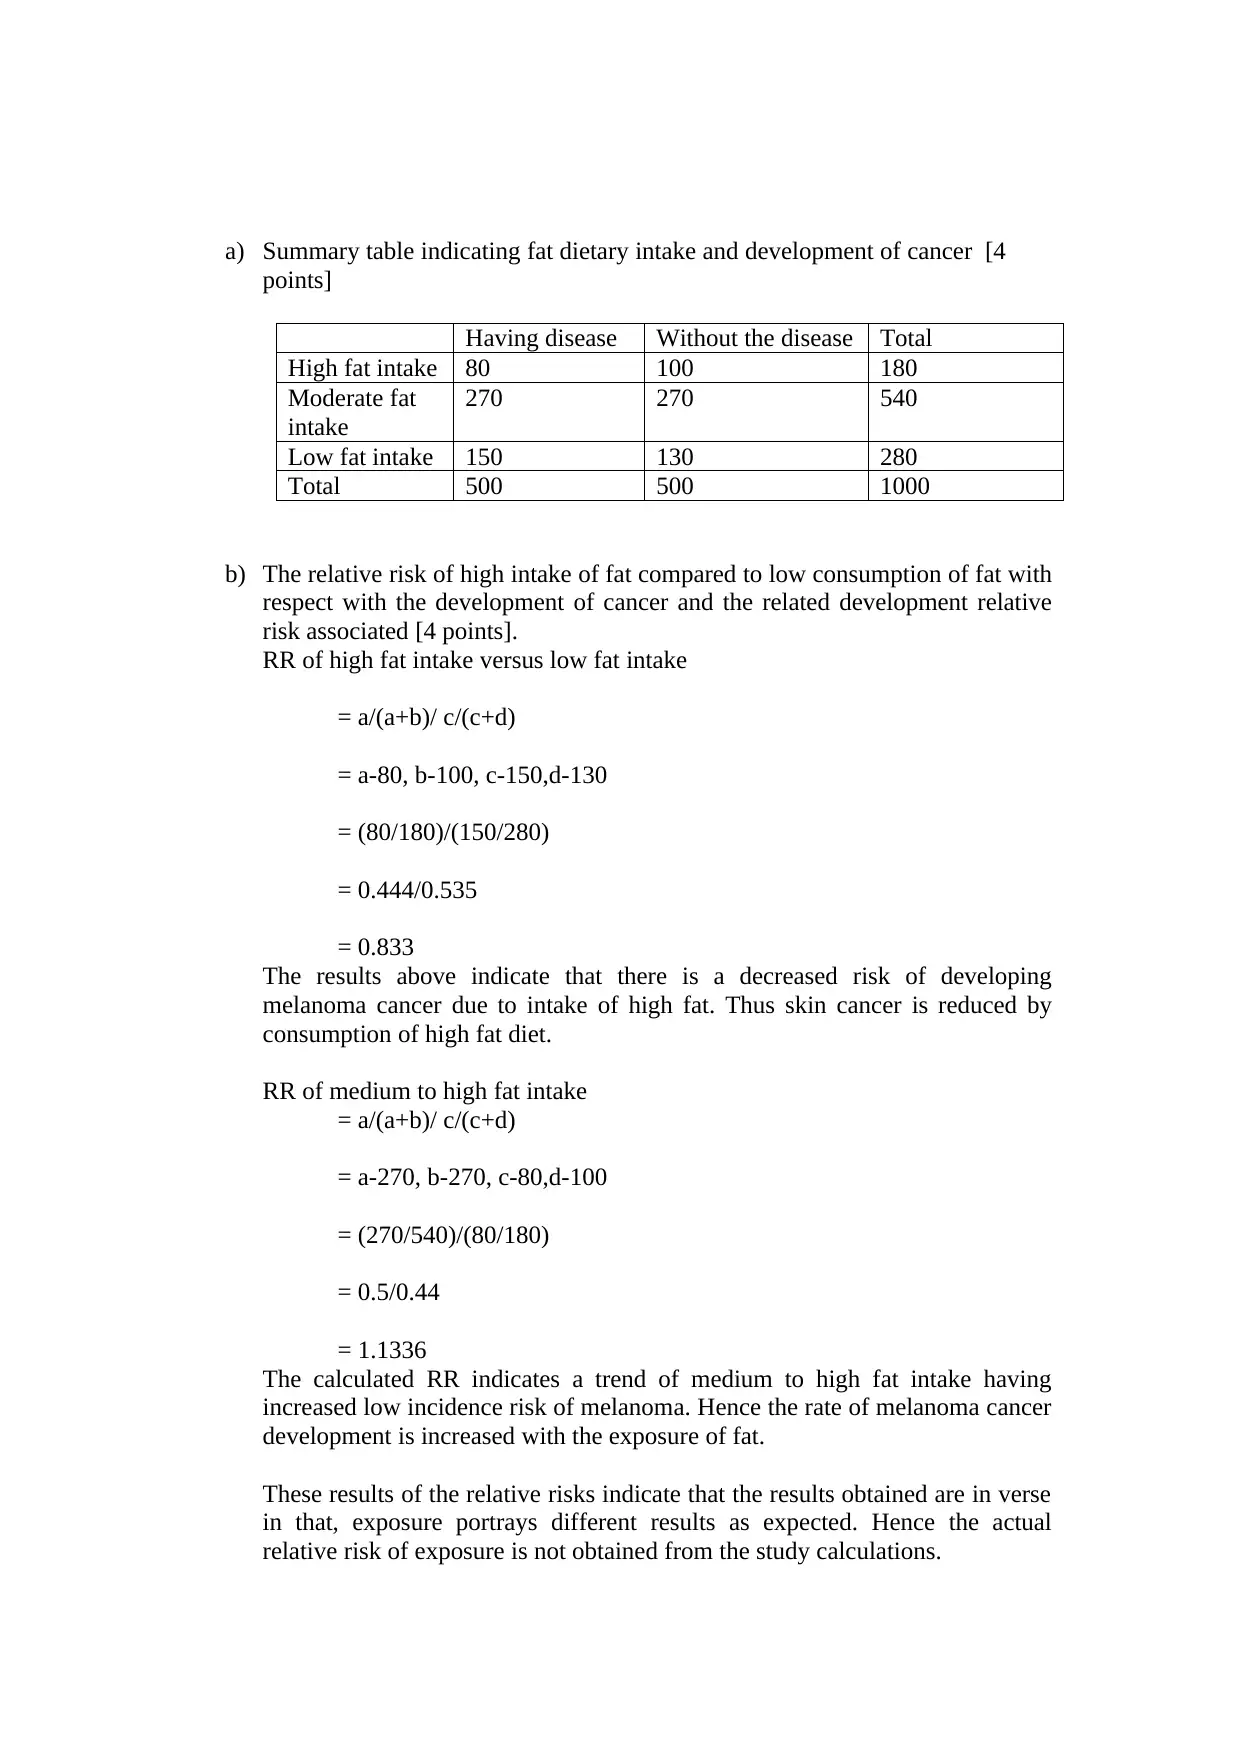
a) Summary table indicating fat dietary intake and development of cancer [4
points]
Having disease Without the disease Total
High fat intake 80 100 180
Moderate fat
intake
270 270 540
Low fat intake 150 130 280
Total 500 500 1000
b) The relative risk of high intake of fat compared to low consumption of fat with
respect with the development of cancer and the related development relative
risk associated [4 points].
RR of high fat intake versus low fat intake
= a/(a+b)/ c/(c+d)
= a-80, b-100, c-150,d-130
= (80/180)/(150/280)
= 0.444/0.535
= 0.833
The results above indicate that there is a decreased risk of developing
melanoma cancer due to intake of high fat. Thus skin cancer is reduced by
consumption of high fat diet.
RR of medium to high fat intake
= a/(a+b)/ c/(c+d)
= a-270, b-270, c-80,d-100
= (270/540)/(80/180)
= 0.5/0.44
= 1.1336
The calculated RR indicates a trend of medium to high fat intake having
increased low incidence risk of melanoma. Hence the rate of melanoma cancer
development is increased with the exposure of fat.
These results of the relative risks indicate that the results obtained are in verse
in that, exposure portrays different results as expected. Hence the actual
relative risk of exposure is not obtained from the study calculations.
Paraphrase This Document
Need a fresh take? Get an instant paraphrase of this document with our AI Paraphraser
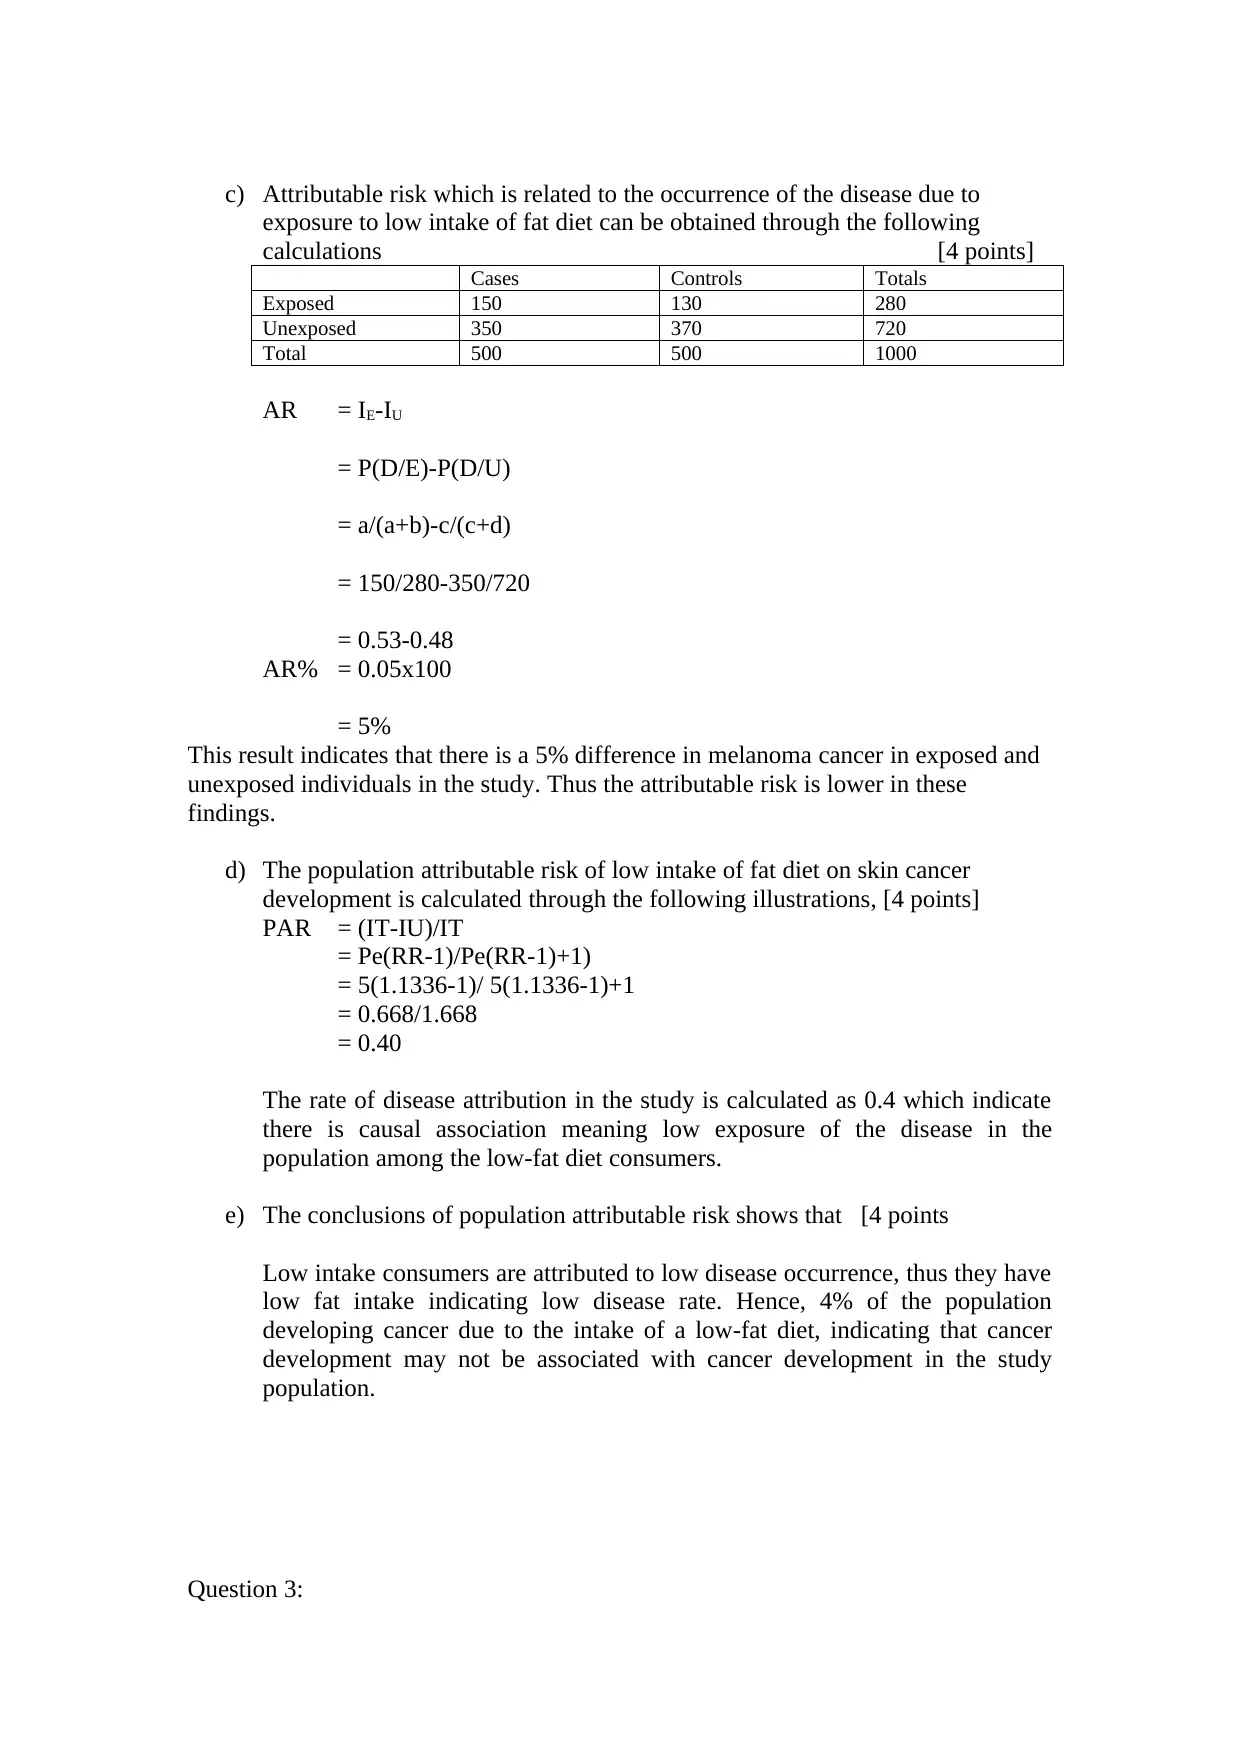
c) Attributable risk which is related to the occurrence of the disease due to
exposure to low intake of fat diet can be obtained through the following
calculations [4 points]
Cases Controls Totals
Exposed 150 130 280
Unexposed 350 370 720
Total 500 500 1000
AR = IE-IU
= P(D/E)-P(D/U)
= a/(a+b)-c/(c+d)
= 150/280-350/720
= 0.53-0.48
AR% = 0.05x100
= 5%
This result indicates that there is a 5% difference in melanoma cancer in exposed and
unexposed individuals in the study. Thus the attributable risk is lower in these
findings.
d) The population attributable risk of low intake of fat diet on skin cancer
development is calculated through the following illustrations, [4 points]
PAR = (IT-IU)/IT
= Pe(RR-1)/Pe(RR-1)+1)
= 5(1.1336-1)/ 5(1.1336-1)+1
= 0.668/1.668
= 0.40
The rate of disease attribution in the study is calculated as 0.4 which indicate
there is causal association meaning low exposure of the disease in the
population among the low-fat diet consumers.
e) The conclusions of population attributable risk shows that [4 points
Low intake consumers are attributed to low disease occurrence, thus they have
low fat intake indicating low disease rate. Hence, 4% of the population
developing cancer due to the intake of a low-fat diet, indicating that cancer
development may not be associated with cancer development in the study
population.
Question 3:
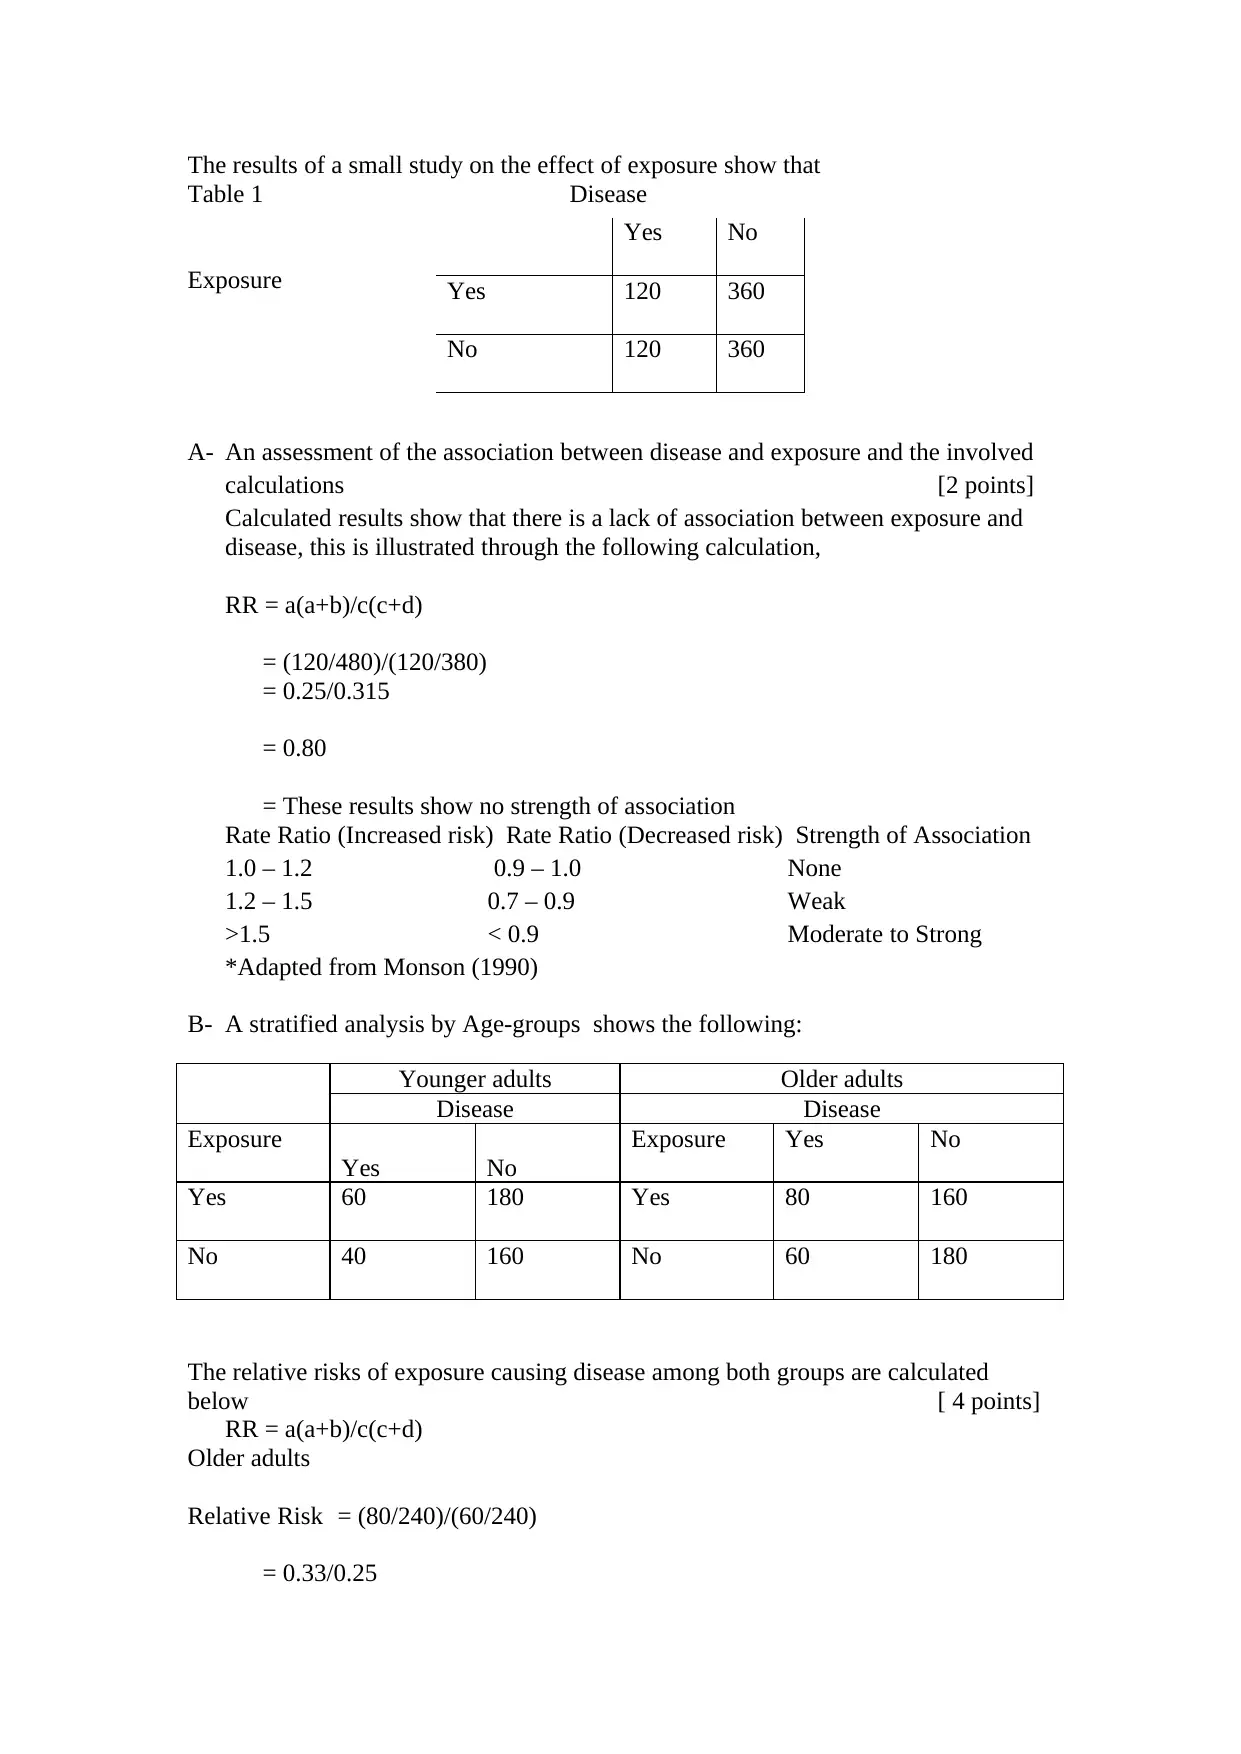
The results of a small study on the effect of exposure show that
Table 1 Disease
Exposure
A- An assessment of the association between disease and exposure and the involved
calculations [2 points]
Calculated results show that there is a lack of association between exposure and
disease, this is illustrated through the following calculation,
RR = a(a+b)/c(c+d)
= (120/480)/(120/380)
= 0.25/0.315
= 0.80
= These results show no strength of association
Rate Ratio (Increased risk) Rate Ratio (Decreased risk) Strength of Association
1.0 – 1.2 0.9 – 1.0 None
1.2 – 1.5 0.7 – 0.9 Weak
>1.5 < 0.9 Moderate to Strong
*Adapted from Monson (1990)
B- A stratified analysis by Age-groups shows the following:
Younger adults Older adults
Disease Disease
Exposure
Yes No
Exposure Yes No
Yes 60 180 Yes 80 160
No 40 160 No 60 180
The relative risks of exposure causing disease among both groups are calculated
below [ 4 points]
RR = a(a+b)/c(c+d)
Older adults
Relative Risk = (80/240)/(60/240)
= 0.33/0.25
Yes No
Yes 120 360
No 120 360
⊘ This is a preview!⊘
Do you want full access?
Subscribe today to unlock all pages.
Trusted by 1+ million students worldwide
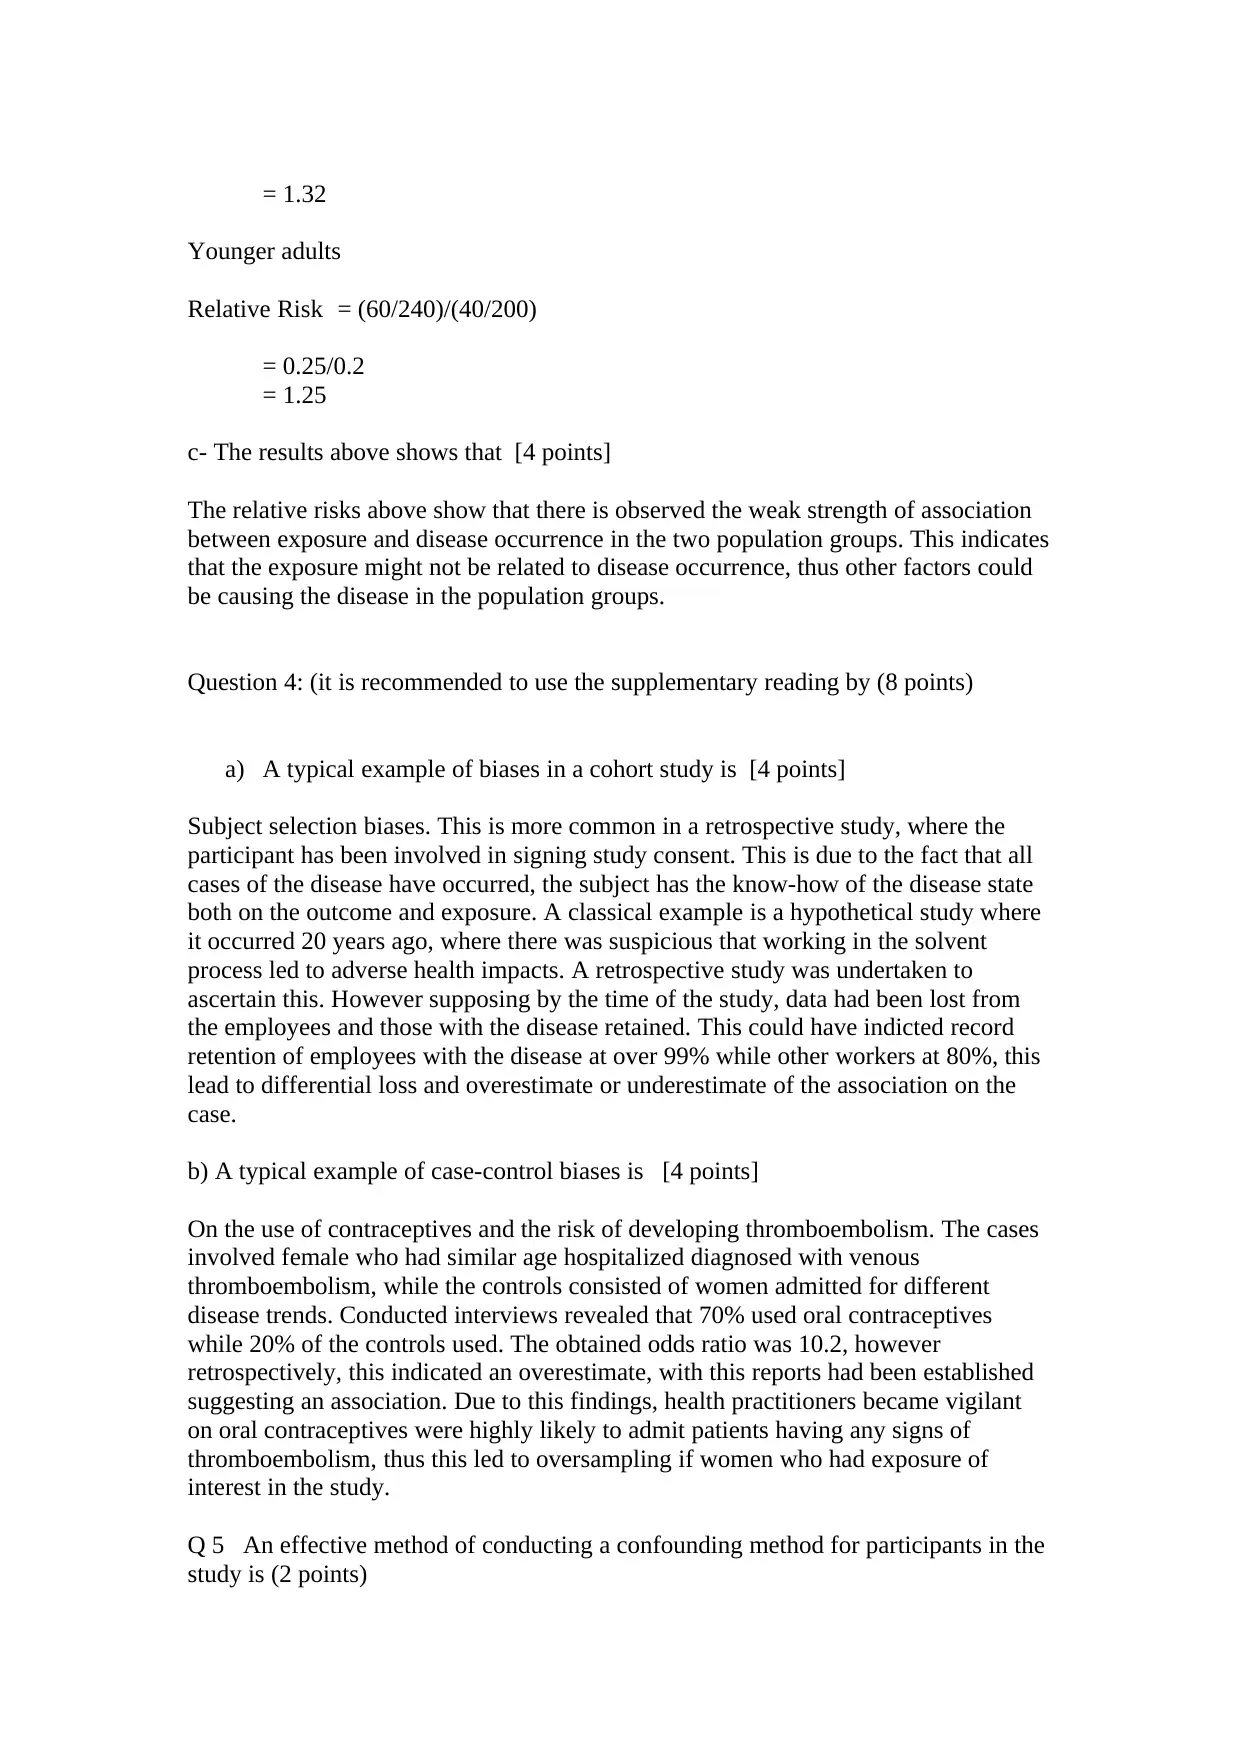
= 1.32
Younger adults
Relative Risk = (60/240)/(40/200)
= 0.25/0.2
= 1.25
c- The results above shows that [4 points]
The relative risks above show that there is observed the weak strength of association
between exposure and disease occurrence in the two population groups. This indicates
that the exposure might not be related to disease occurrence, thus other factors could
be causing the disease in the population groups.
Question 4: (it is recommended to use the supplementary reading by (8 points)
a) A typical example of biases in a cohort study is [4 points]
Subject selection biases. This is more common in a retrospective study, where the
participant has been involved in signing study consent. This is due to the fact that all
cases of the disease have occurred, the subject has the know-how of the disease state
both on the outcome and exposure. A classical example is a hypothetical study where
it occurred 20 years ago, where there was suspicious that working in the solvent
process led to adverse health impacts. A retrospective study was undertaken to
ascertain this. However supposing by the time of the study, data had been lost from
the employees and those with the disease retained. This could have indicted record
retention of employees with the disease at over 99% while other workers at 80%, this
lead to differential loss and overestimate or underestimate of the association on the
case.
b) A typical example of case-control biases is [4 points]
On the use of contraceptives and the risk of developing thromboembolism. The cases
involved female who had similar age hospitalized diagnosed with venous
thromboembolism, while the controls consisted of women admitted for different
disease trends. Conducted interviews revealed that 70% used oral contraceptives
while 20% of the controls used. The obtained odds ratio was 10.2, however
retrospectively, this indicated an overestimate, with this reports had been established
suggesting an association. Due to this findings, health practitioners became vigilant
on oral contraceptives were highly likely to admit patients having any signs of
thromboembolism, thus this led to oversampling if women who had exposure of
interest in the study.
Q 5 An effective method of conducting a confounding method for participants in the
study is (2 points)
Paraphrase This Document
Need a fresh take? Get an instant paraphrase of this document with our AI Paraphraser
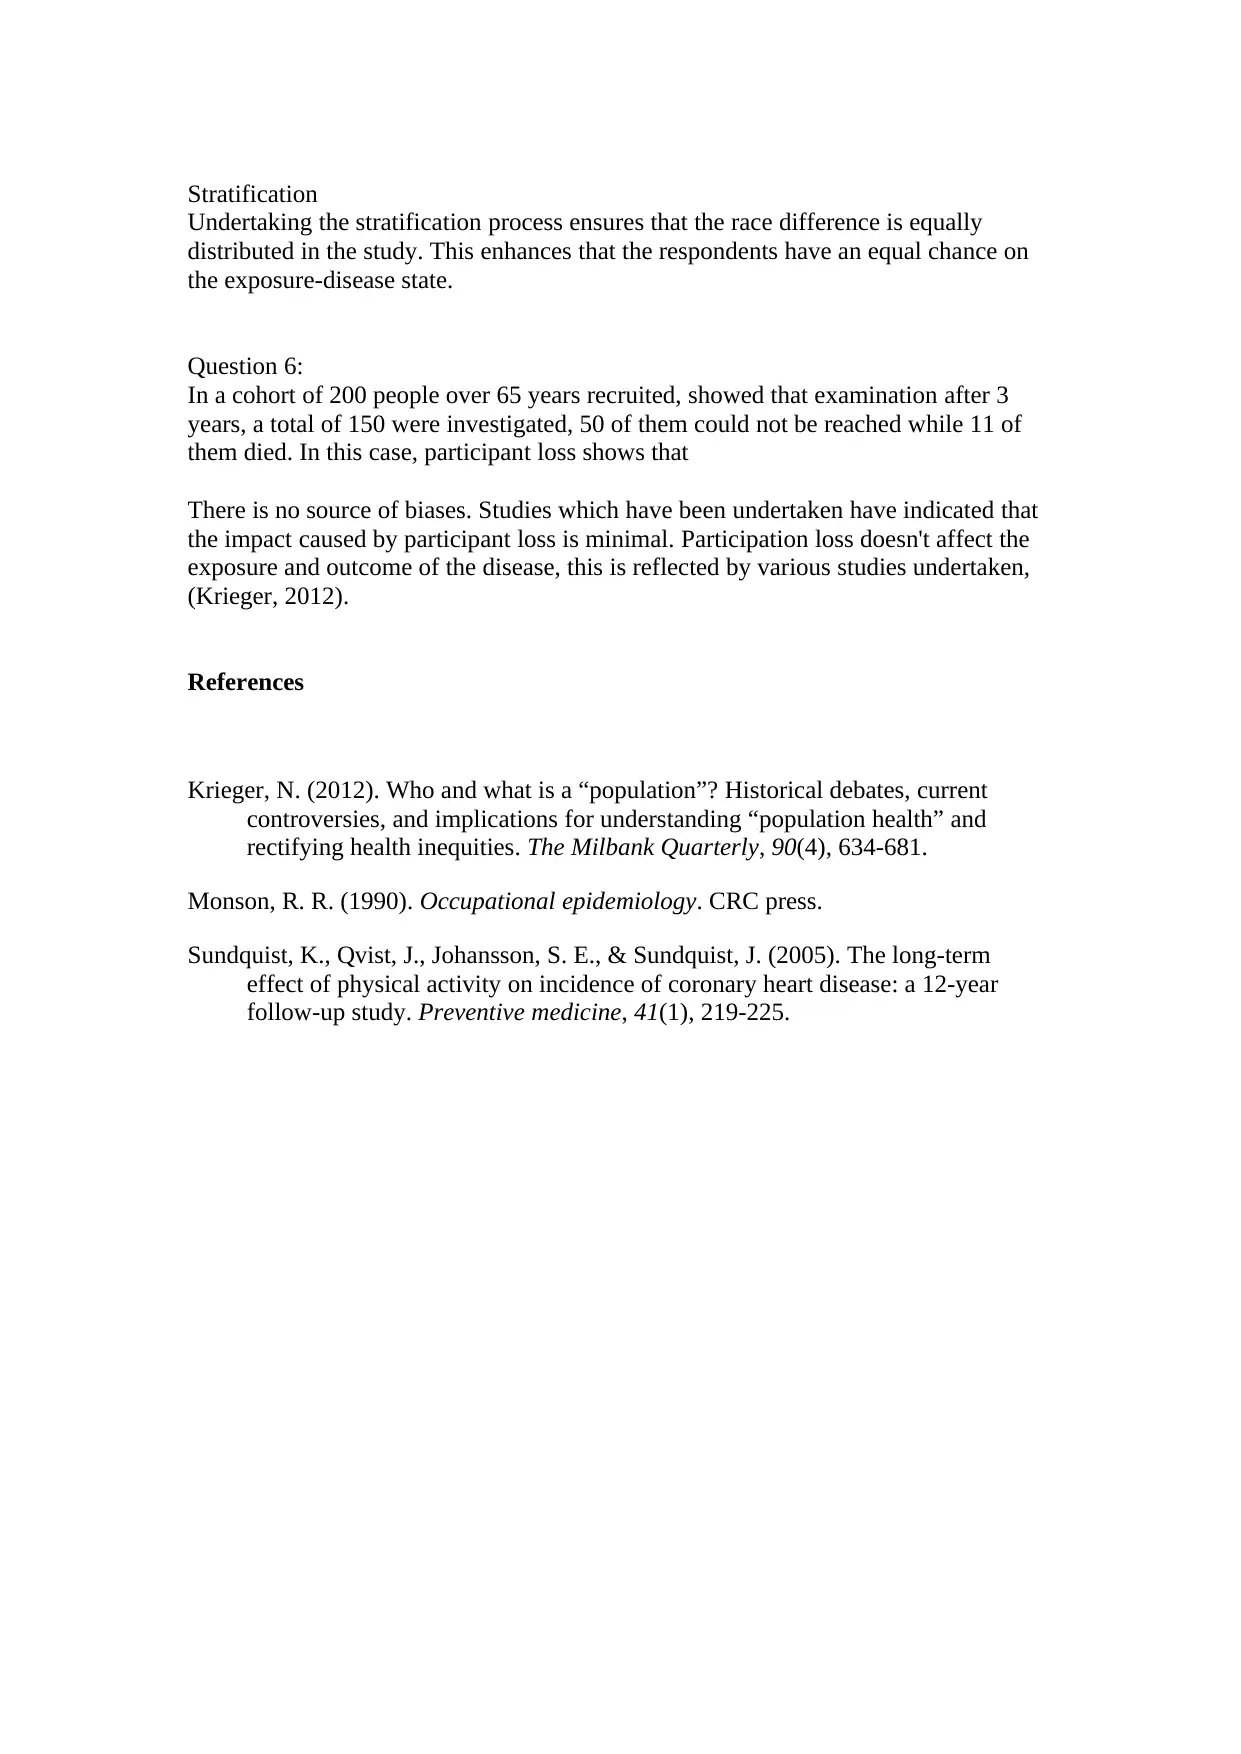
Stratification
Undertaking the stratification process ensures that the race difference is equally
distributed in the study. This enhances that the respondents have an equal chance on
the exposure-disease state.
Question 6:
In a cohort of 200 people over 65 years recruited, showed that examination after 3
years, a total of 150 were investigated, 50 of them could not be reached while 11 of
them died. In this case, participant loss shows that
There is no source of biases. Studies which have been undertaken have indicated that
the impact caused by participant loss is minimal. Participation loss doesn't affect the
exposure and outcome of the disease, this is reflected by various studies undertaken,
(Krieger, 2012).
References
Krieger, N. (2012). Who and what is a “population”? Historical debates, current
controversies, and implications for understanding “population health” and
rectifying health inequities. The Milbank Quarterly, 90(4), 634-681.
Monson, R. R. (1990). Occupational epidemiology. CRC press.
Sundquist, K., Qvist, J., Johansson, S. E., & Sundquist, J. (2005). The long-term
effect of physical activity on incidence of coronary heart disease: a 12-year
follow-up study. Preventive medicine, 41(1), 219-225.
1 out of 8
Related Documents


Your All-in-One AI-Powered Toolkit for Academic Success.
+13062052269
info@desklib.com
Available 24*7 on WhatsApp / Email
![[object Object]](/_next/static/media/star-bottom.7253800d.svg)
Unlock your academic potential
Copyright © 2020–2026 A2Z Services. All Rights Reserved. Developed and managed by ZUCOL.