Epidemiology and Population Health Autumn 2018 Assessment 2 Solutions
VerifiedAdded on 2023/06/04
|9
|1568
|341
Homework Assignment
AI Summary
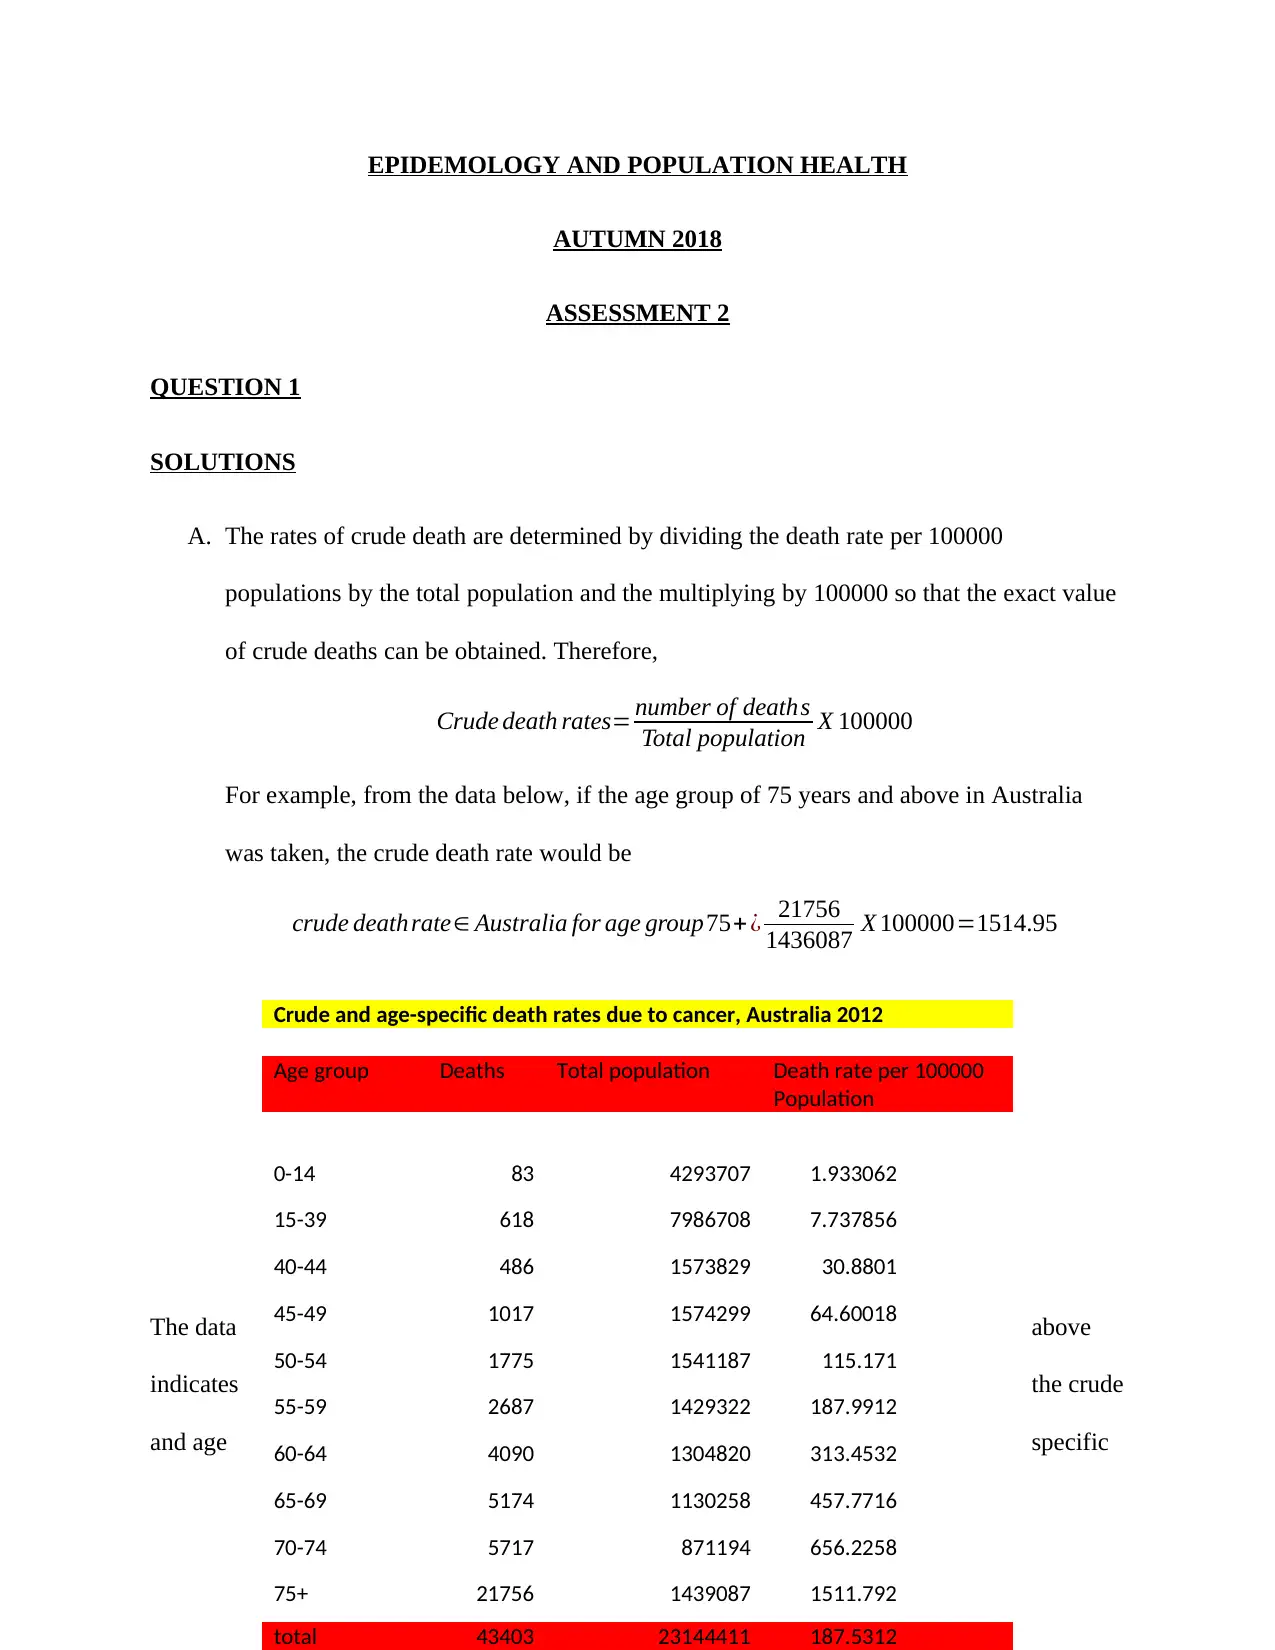
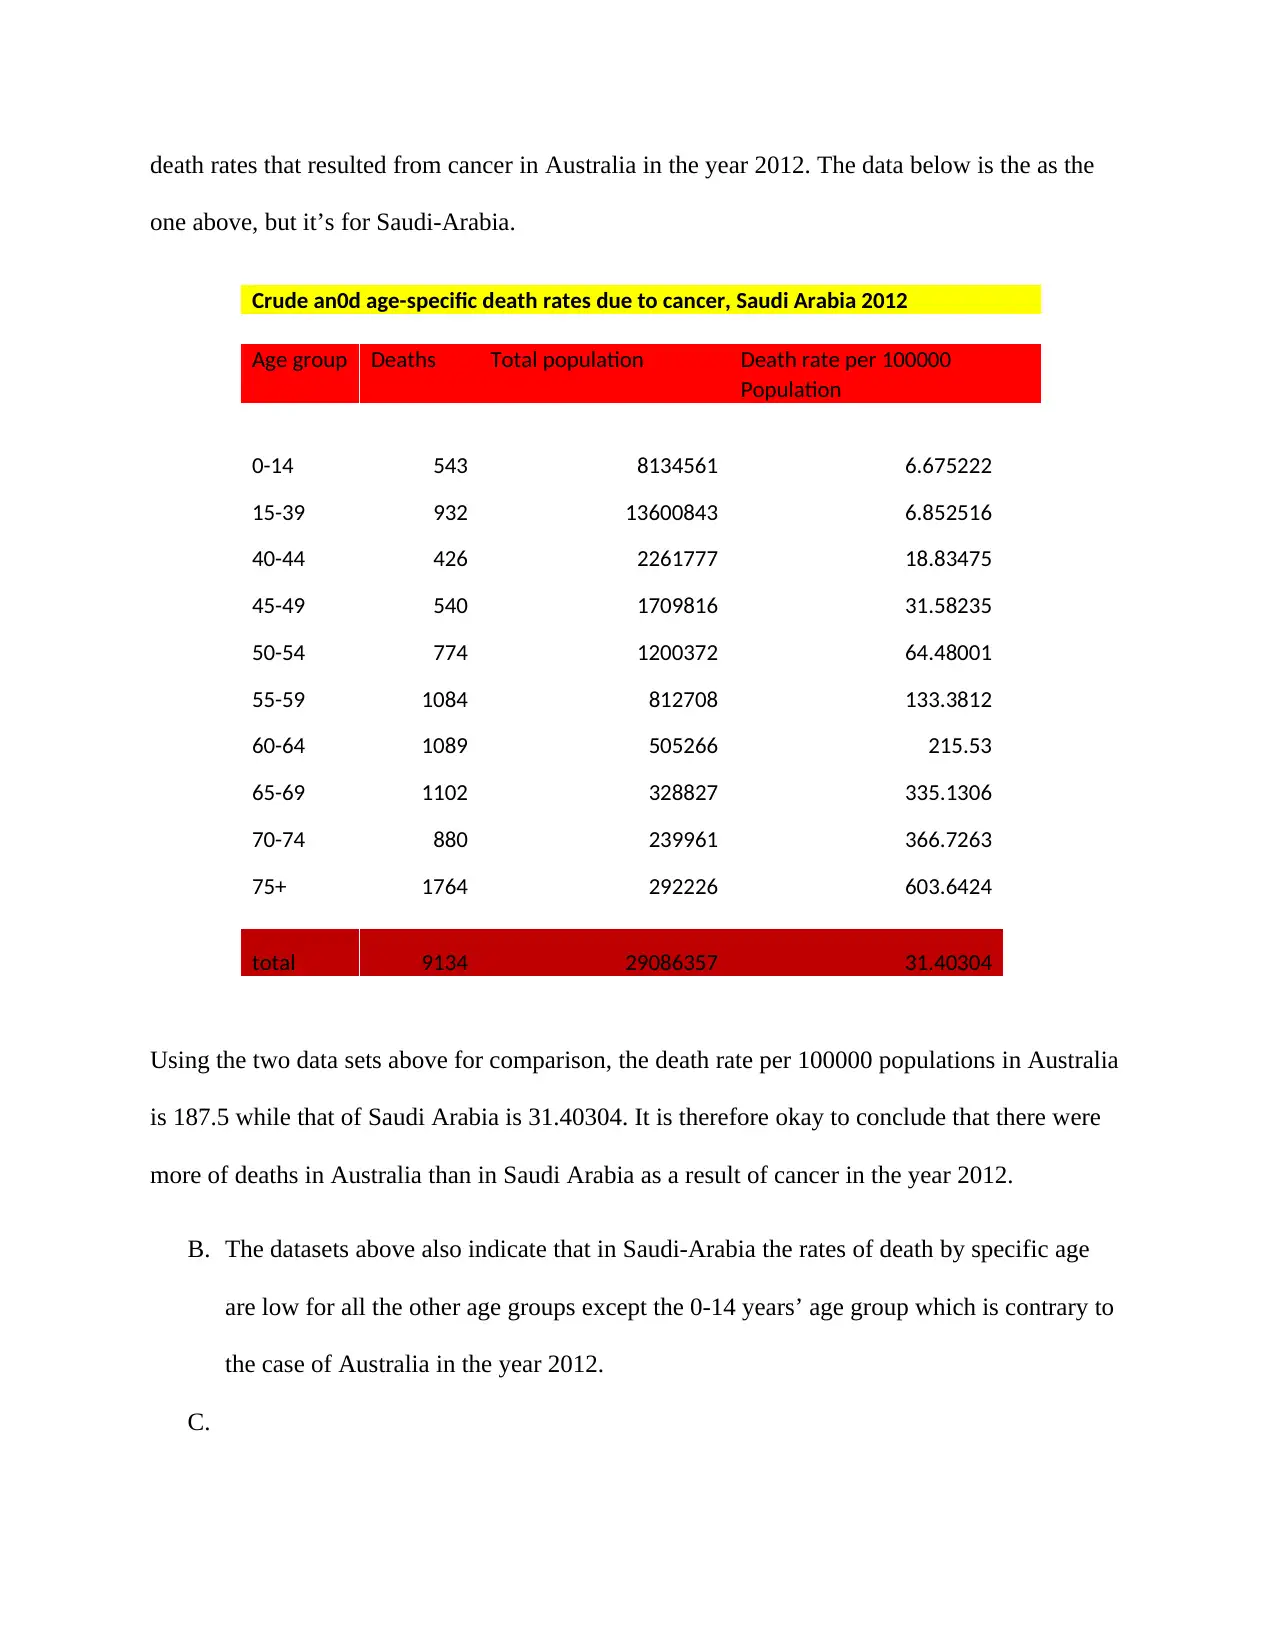
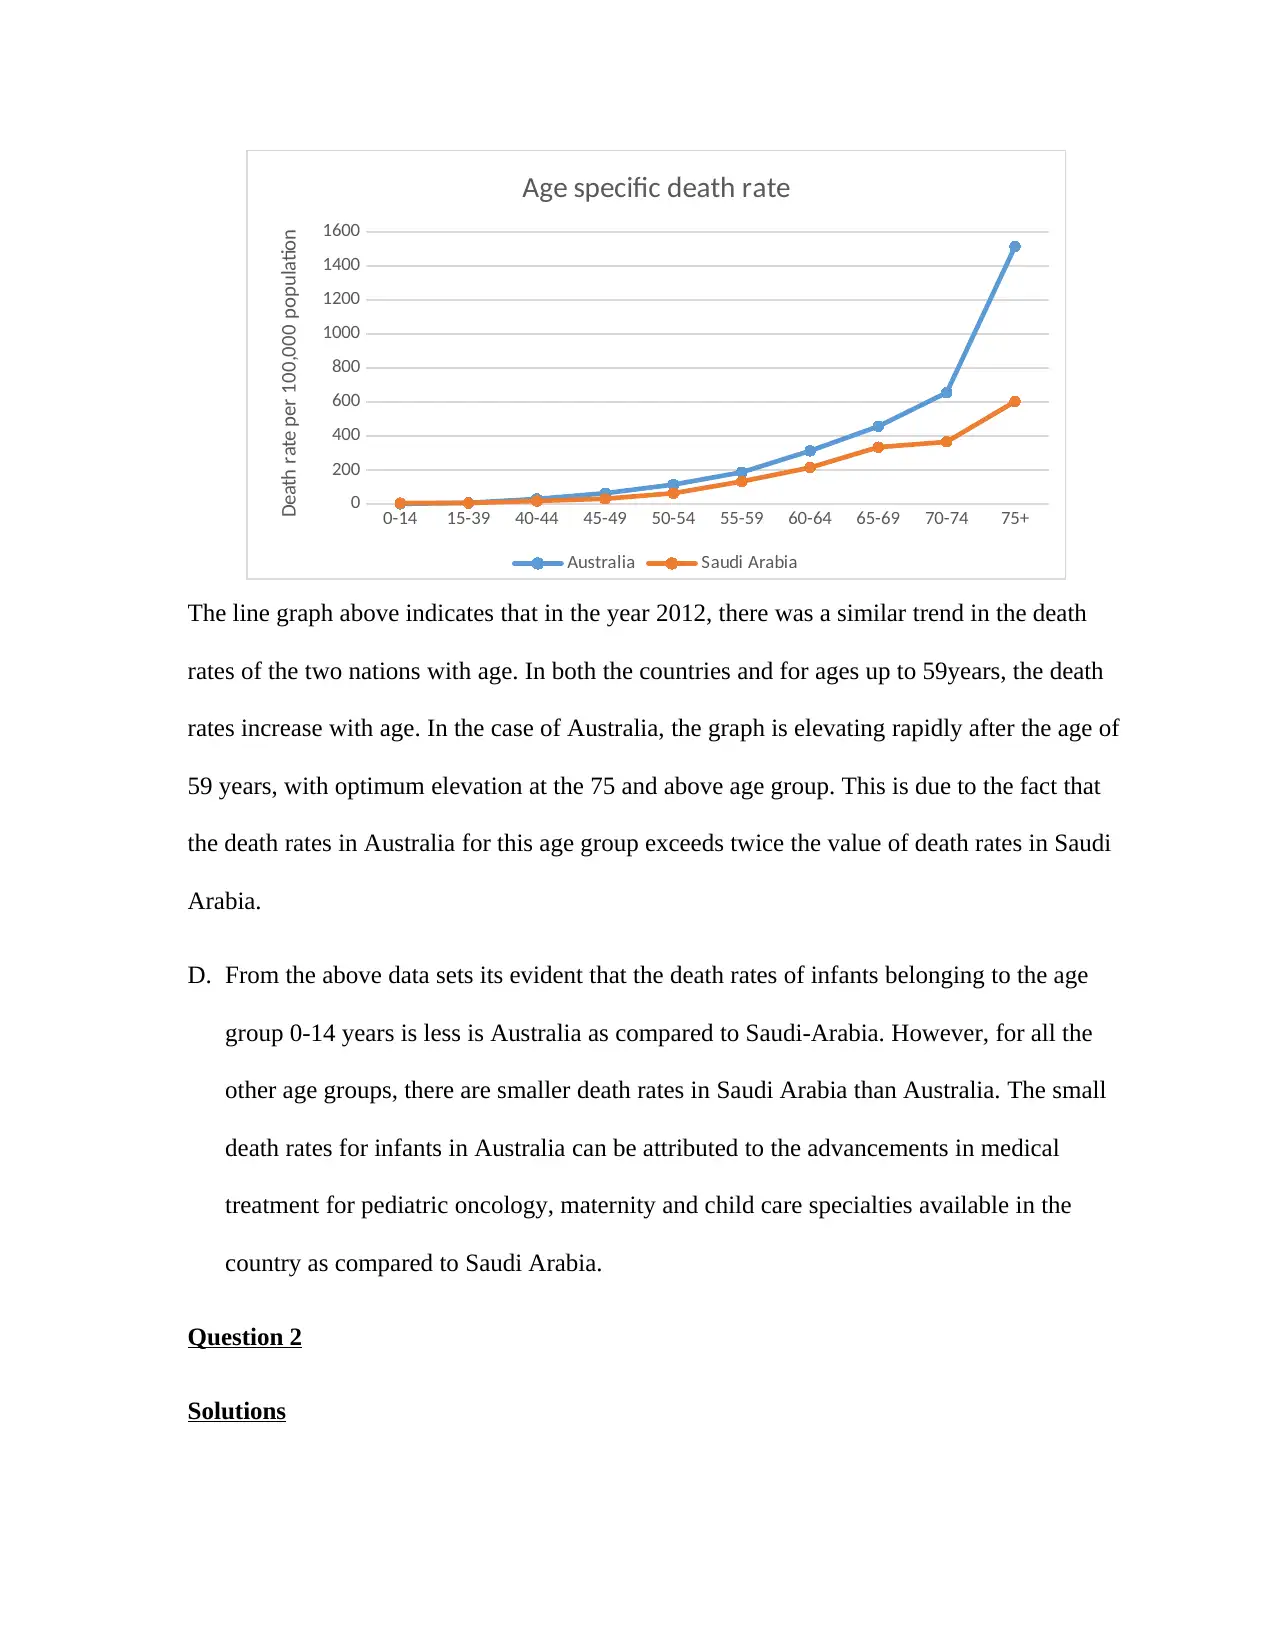
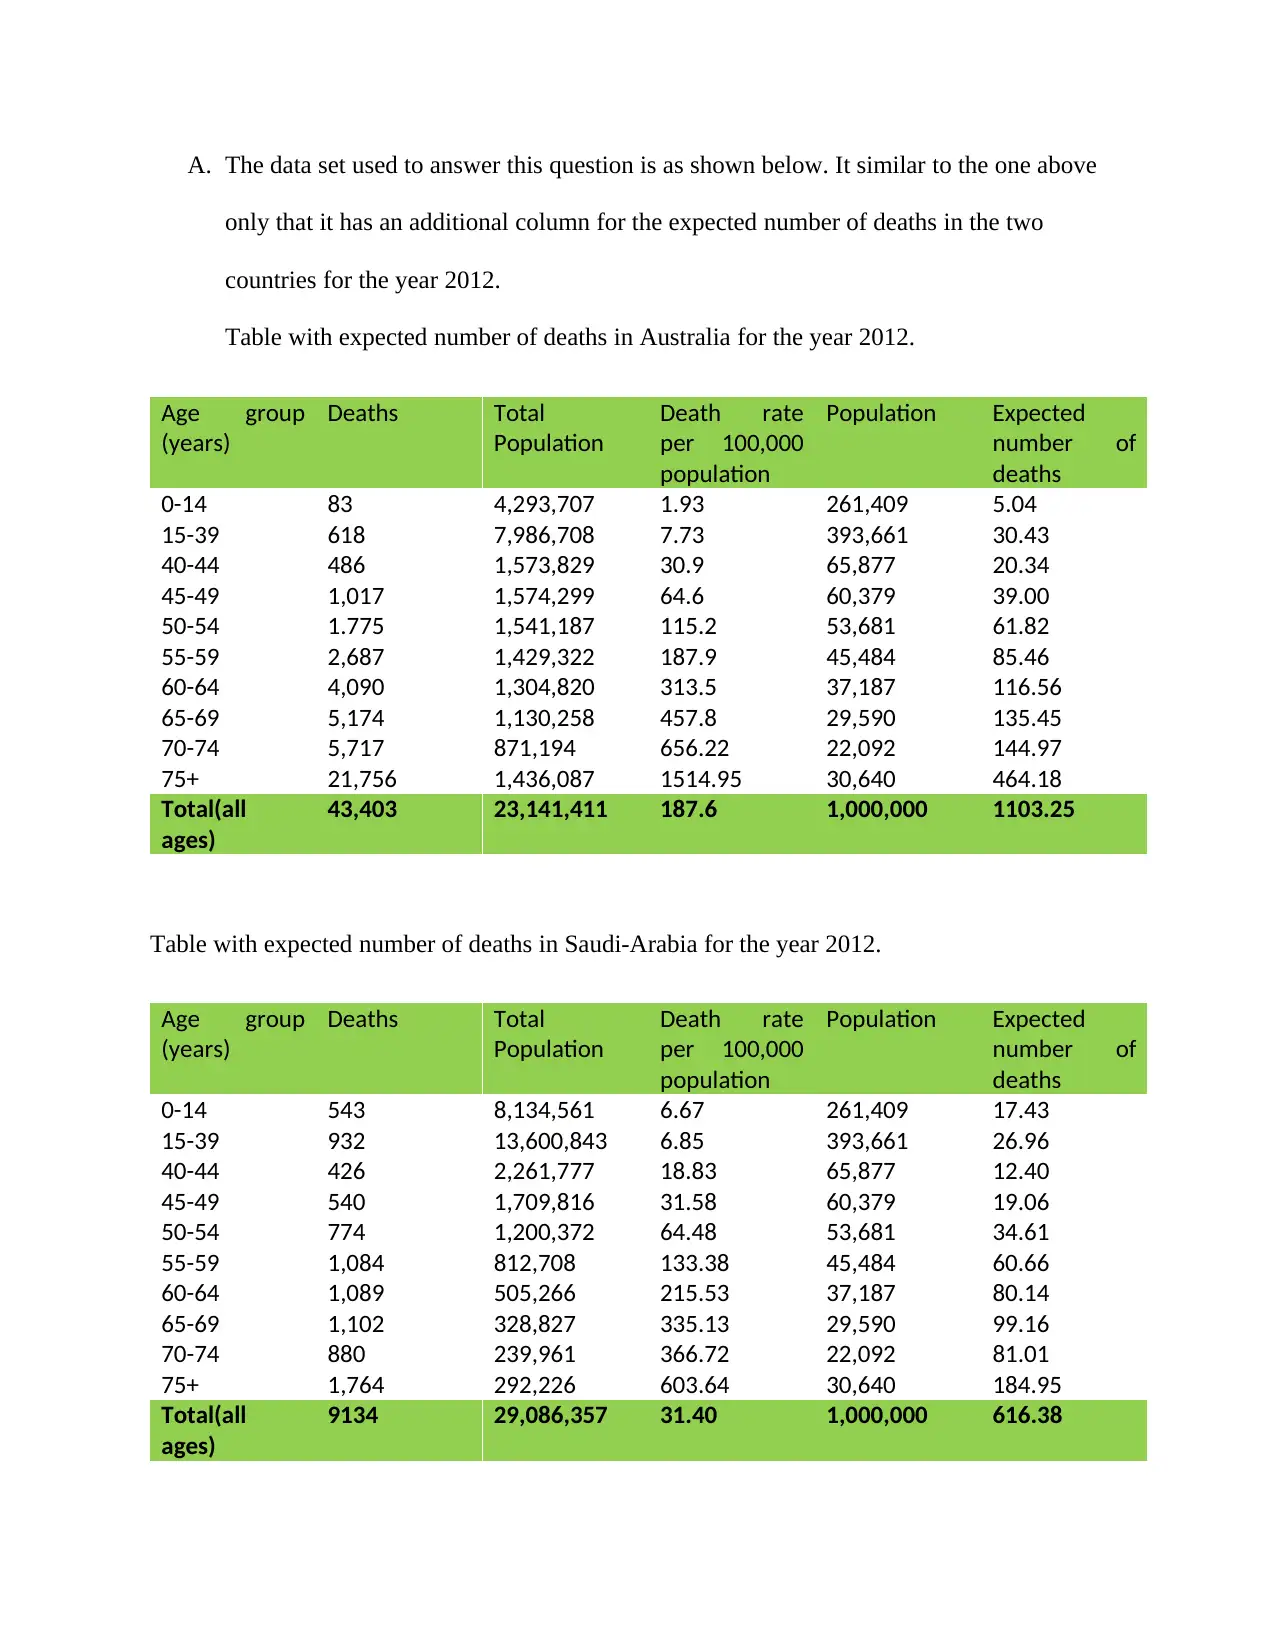
This document presents solutions to an epidemiology assignment focusing on public and global health. It analyzes crude and age-specific death rates due to cancer in Australia and Saudi Arabia in 2012, comparing mortality statistics across different age groups. The solution calculates and interprets death rates, risk ratios, attributable fractions, and odds ratios to understand the impact of various factors on population health, including infant mortality and the influence of lifetime sexual partners. The analysis includes detailed calculations and comparisons, providing a comprehensive overview of epidemiological concepts and their application to real-world health data, using datasets to illustrate key principles and draw relevant conclusions about health outcomes.

EPIDEMOLOGY AND POPULATION HEALTH
AUTUMN 2018
ASSESSMENT 2
QUESTION 1
SOLUTIONS
A. The rates of crude death are determined by dividing the death rate per 100000
populations by the total population and the multiplying by 100000 so that the exact value
of crude deaths can be obtained. Therefore,
Crude death rates= number of deaths
Total population X 100000
For example, from the data below, if the age group of 75 years and above in Australia
was taken, the crude death rate would be
crude deathrate∈ Australia for age group75+¿ 21756
1436087 X 100000=1514.95
The data above
indicates the crude
and age specific
Crude and age-specific death rates due to cancer, Australia 2012
Age group Deaths Total population Death rate per 100000
Population
0-14 83 4293707 1.933062
15-39 618 7986708 7.737856
40-44 486 1573829 30.8801
45-49 1017 1574299 64.60018
50-54 1775 1541187 115.171
55-59 2687 1429322 187.9912
60-64 4090 1304820 313.4532
65-69 5174 1130258 457.7716
70-74 5717 871194 656.2258
75+ 21756 1439087 1511.792
total 43403 23144411 187.5312
Secure Best Marks with AI Grader
Need help grading? Try our AI Grader for instant feedback on your assignments.

death rates that resulted from cancer in Australia in the year 2012. The data below is the as the
one above, but it’s for Saudi-Arabia.
Using the two data sets above for comparison, the death rate per 100000 populations in Australia
is 187.5 while that of Saudi Arabia is 31.40304. It is therefore okay to conclude that there were
more of deaths in Australia than in Saudi Arabia as a result of cancer in the year 2012.
B. The datasets above also indicate that in Saudi-Arabia the rates of death by specific age
are low for all the other age groups except the 0-14 years’ age group which is contrary to
the case of Australia in the year 2012.
C.
Crude an0d age-specific death rates due to cancer, Saudi Arabia 2012
Age group Deaths Total population Death rate per 100000
Population
0-14 543 8134561 6.675222
15-39 932 13600843 6.852516
40-44 426 2261777 18.83475
45-49 540 1709816 31.58235
50-54 774 1200372 64.48001
55-59 1084 812708 133.3812
60-64 1089 505266 215.53
65-69 1102 328827 335.1306
70-74 880 239961 366.7263
75+ 1764 292226 603.6424
total 9134 29086357 31.40304

0-14 15-39 40-44 45-49 50-54 55-59 60-64 65-69 70-74 75+
0
200
400
600
800
1000
1200
1400
1600
Age specific death rate
Australia Saudi Arabia
Death rate per 100,000 population
The line graph above indicates that in the year 2012, there was a similar trend in the death
rates of the two nations with age. In both the countries and for ages up to 59years, the death
rates increase with age. In the case of Australia, the graph is elevating rapidly after the age of
59 years, with optimum elevation at the 75 and above age group. This is due to the fact that
the death rates in Australia for this age group exceeds twice the value of death rates in Saudi
Arabia.
D. From the above data sets its evident that the death rates of infants belonging to the age
group 0-14 years is less is Australia as compared to Saudi-Arabia. However, for all the
other age groups, there are smaller death rates in Saudi Arabia than Australia. The small
death rates for infants in Australia can be attributed to the advancements in medical
treatment for pediatric oncology, maternity and child care specialties available in the
country as compared to Saudi Arabia.
Question 2
Solutions

A. The data set used to answer this question is as shown below. It similar to the one above
only that it has an additional column for the expected number of deaths in the two
countries for the year 2012.
Table with expected number of deaths in Australia for the year 2012.
Age group
(years)
Deaths Total
Population
Death rate
per 100,000
population
Population Expected
number of
deaths
0-14
15-39
40-44
45-49
50-54
55-59
60-64
65-69
70-74
75+
83
618
486
1,017
1.775
2,687
4,090
5,174
5,717
21,756
4,293,707
7,986,708
1,573,829
1,574,299
1,541,187
1,429,322
1,304,820
1,130,258
871,194
1,436,087
1.93
7.73
30.9
64.6
115.2
187.9
313.5
457.8
656.22
1514.95
261,409
393,661
65,877
60,379
53,681
45,484
37,187
29,590
22,092
30,640
5.04
30.43
20.34
39.00
61.82
85.46
116.56
135.45
144.97
464.18
Total(all
ages)
43,403 23,141,411 187.6 1,000,000 1103.25
Table with expected number of deaths in Saudi-Arabia for the year 2012.
Age group
(years)
Deaths Total
Population
Death rate
per 100,000
population
Population Expected
number of
deaths
0-14
15-39
40-44
45-49
50-54
55-59
60-64
65-69
70-74
75+
543
932
426
540
774
1,084
1,089
1,102
880
1,764
8,134,561
13,600,843
2,261,777
1,709,816
1,200,372
812,708
505,266
328,827
239,961
292,226
6.67
6.85
18.83
31.58
64.48
133.38
215.53
335.13
366.72
603.64
261,409
393,661
65,877
60,379
53,681
45,484
37,187
29,590
22,092
30,640
17.43
26.96
12.40
19.06
34.61
60.66
80.14
99.16
81.01
184.95
Total(all
ages)
9134 29,086,357 31.40 1,000,000 616.38
Secure Best Marks with AI Grader
Need help grading? Try our AI Grader for instant feedback on your assignments.

To determine the expected number of deaths expected for any country, we use the following
formula:
Expected no . of deaths= Death rate per 100000 population X Total Population
100000
For example, from our table above the expected death rate in Saudi-Arabia would be.
Expected death rate∈Saudi− Arabia=616.38 X 1000000
100000 =61.63 8
Hence it would be 162 per 100,000 populations. On the hand, in the case of Australia it would
be:
Expected death rate∈ Australia=1103.25 /1000000
100000 =110.325
Hence, it is 110 per 100000 populations.
B. The dataset above indicates despite Australia having a lower population than Saudi-
Arabia, there are higher death rates in Australia than Saudi-Arabia except for the infant
age group (0-14years) where there are low death rates in Australia due to the advanced
and well organized child care system dealing with cancer. In Australia, the crude death
rate (1876 per 100000) and the age standardized death rate (110 per 100000) is high for
the older population resulting to more deaths compared to other age groups. On the other
hand, in Saudi-Arabia the crude death rate (31.40 per 100000) and age standardized death
rate (62 per 100000) is very low proving that there are less deaths for the densely
populated Saudi-Arabia than low populated Australia.
C.

Table 4: Infant mortality by birthweight in 72,730 live births.
Death before 1
year
Yes No Total
Low Birthweight 618 4597 5215
Normal birthweight 422 67093 67515
Total 1040 71690 72730
I. The risk ratio is determined is given by
Risk ratio= Proportion of exposedincidence
proroportin of Unexposed incidence
Hence, it is:
Risk ratio= 618
422 =1.464
II. The absolute value of the difference between risk is the difference between
exposed incidence proportion and the unexposed incidence proportion as below:
|Risk difference|=proportion ( exposed−unexposed )
Its therefore,
11850.43−625.04=11225.39
III. The probability as a percentage of the deaths for the low birth weights that would
otherwise not have occurred is determined by the attributable fraction given by
the formula below:
Attributable fraction= AR
IPE ( Incidence∈exposed ) X 100
It is therefore,
11225.39
11850.43 X 100=94.7 %∨95 %

IV. The overall incidence as a percentage is determined by the total death rate divided
by the total cases observed as follows:
Overall incidence= Total deathrate
Total cases observed
Hence,
Overall Incidence= 1040
72730 X 100=1.43 %
V. The Incidence is giving by the division of death cases for normal birth weights by
the total cases observed for normal birth weight. i.e.
incidence= death cases for births withnormal weight
Total cases observed for normal birth weight .
¿ 422
67515 =0.00624491=625.04
Therefore, the incidence obtained with no possibility of born with low birth
weight would be 625.04.
VI. The population attribute risk is the difference between the rate of incidence in
population and the incidence rate in the unexposed. It is therefore,
¿ 1429.94−625.04=804.9
Meaning that the death cases that would be caused by the low birth weights would
be equivalent to 805.
VII. The population attributable fraction as a percentage is the division of population
attributable risk by the incidence in total population multiplied by a hundred as
follows:
Paraphrase This Document
Need a fresh take? Get an instant paraphrase of this document with our AI Paraphraser

Population attributable fraction= population attribute risk
Incidence ∈total population X 100
¿ 804.9
1429.94 X 100=56.3 %
Meaning that there are 53.6% deaths for infants below 1 year.
Question 3
Solution
I. The ratio of crude odd is given by:
[ ( a
c )
( b
d ) ] =
[ ( 42
146 )
( 90
481 ) ] =1.5347=1.54 ¿ 2dp
II. Using the table 6a. The odd ratio determined is;
[ ( 31
78 )
( 124
437 ) ] =0.397
0.283 =1.40
Using the table 6b. The odd ratio determined is;
[ ( 11
22 )
( 12
44 ) ] = 0.5
0.272=1.838=1.84 ¿ 2 dp
III. The odd values calculated above have very little variation, i.e. there is some
degree of similarity and there it would be okay to conclude that lifetime sexual
partners are a cofounder modifier.

1 out of 9
Related Documents

Your All-in-One AI-Powered Toolkit for Academic Success.
+13062052269
info@desklib.com
Available 24*7 on WhatsApp / Email
Unlock your academic potential
© 2024 | Zucol Services PVT LTD | All rights reserved.