Epidemiology Assignment: Comparing Death Rates, Risk Factors, and HPV

Verified

Added on  2021/05/31

|10
|2001
|67
Homework Assignment
AI Summary
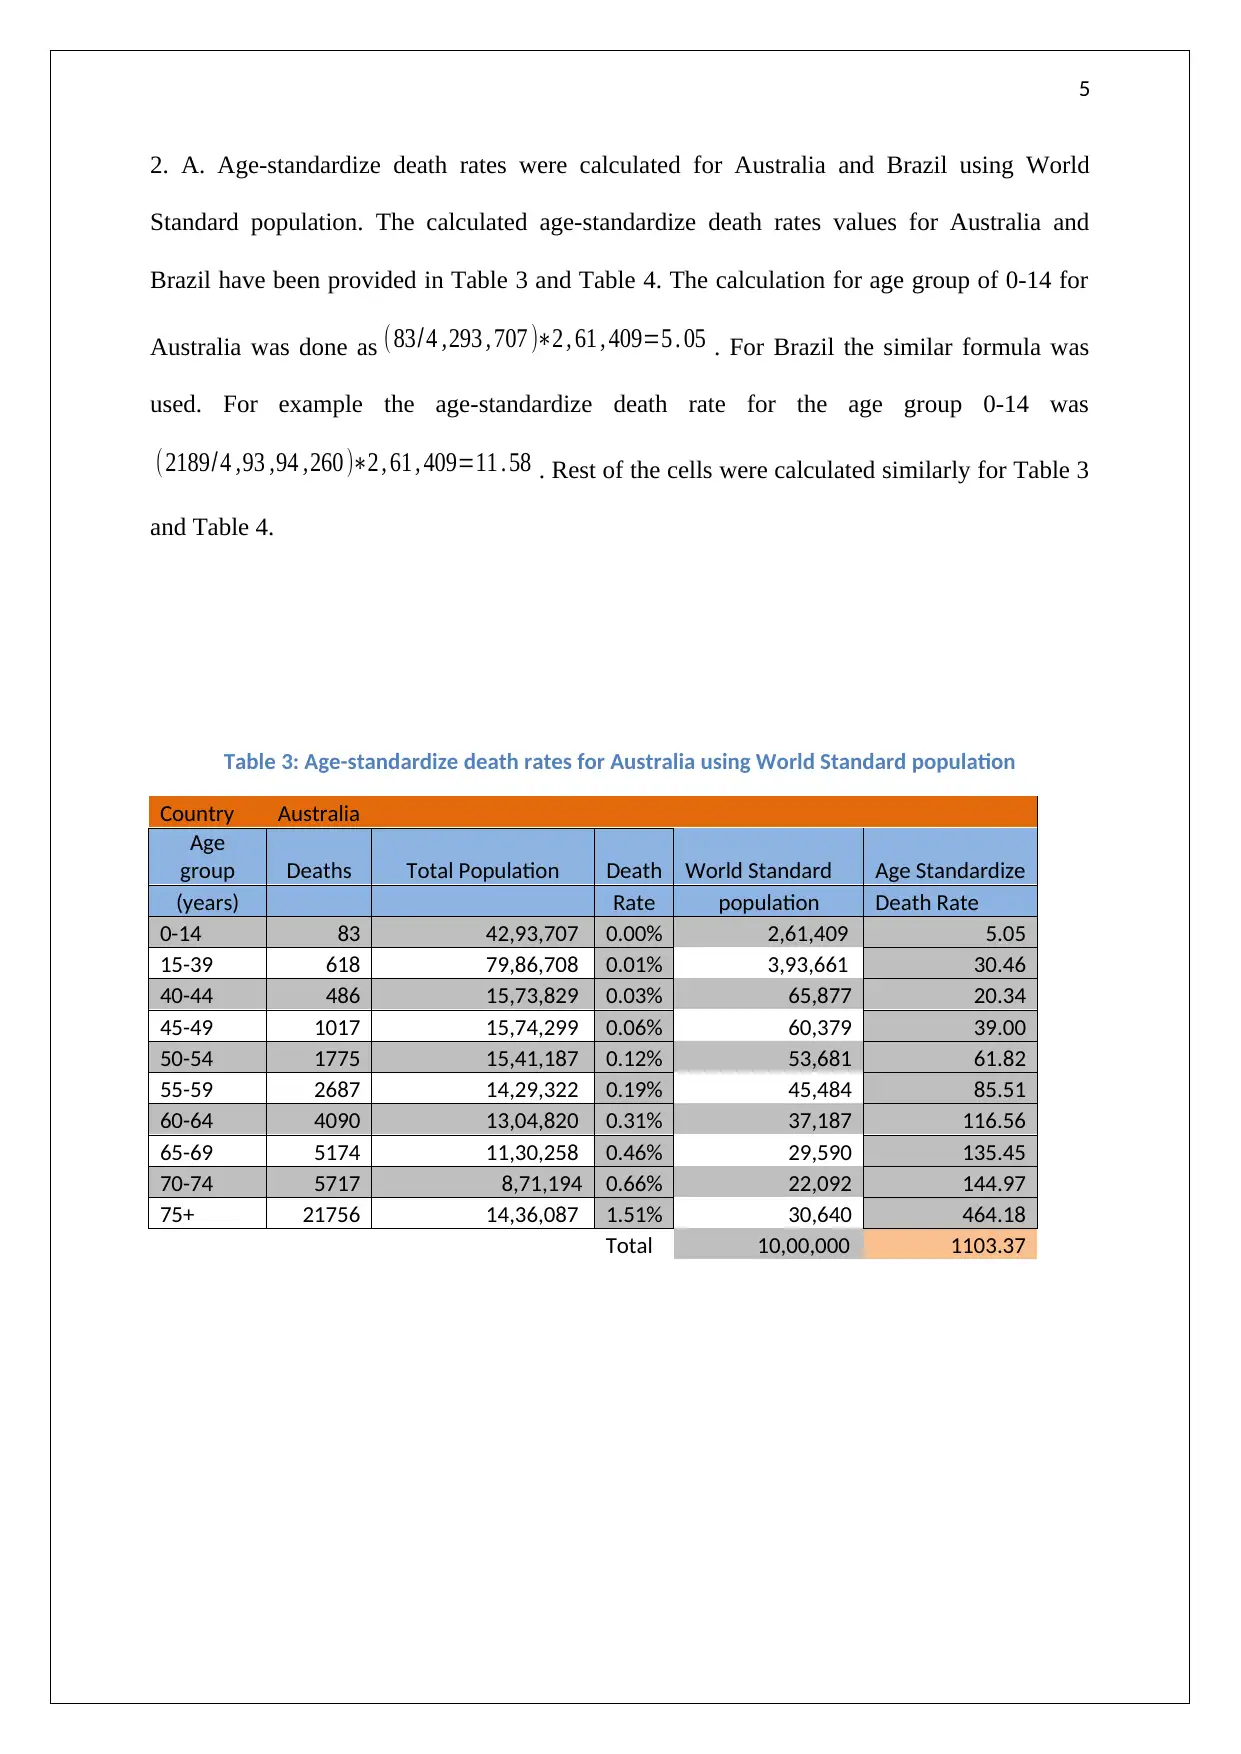
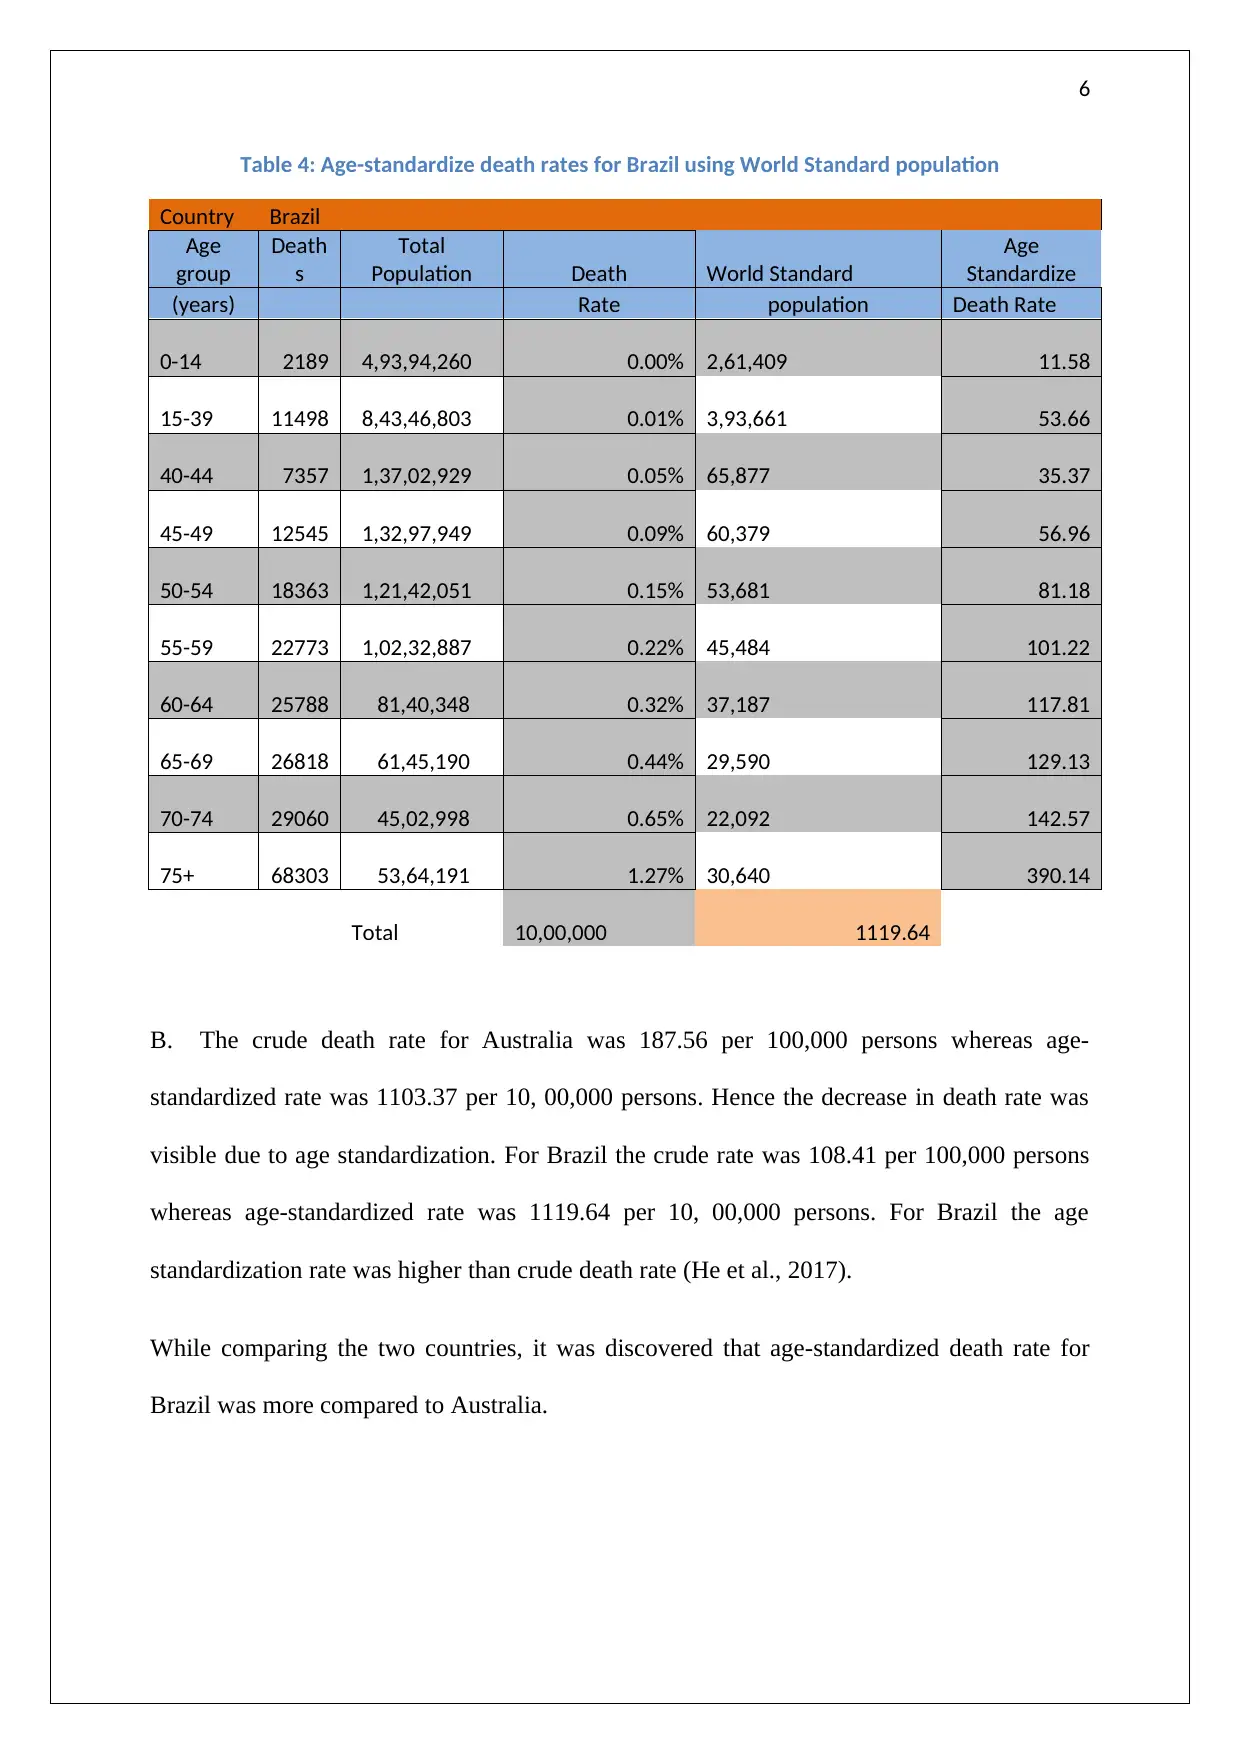
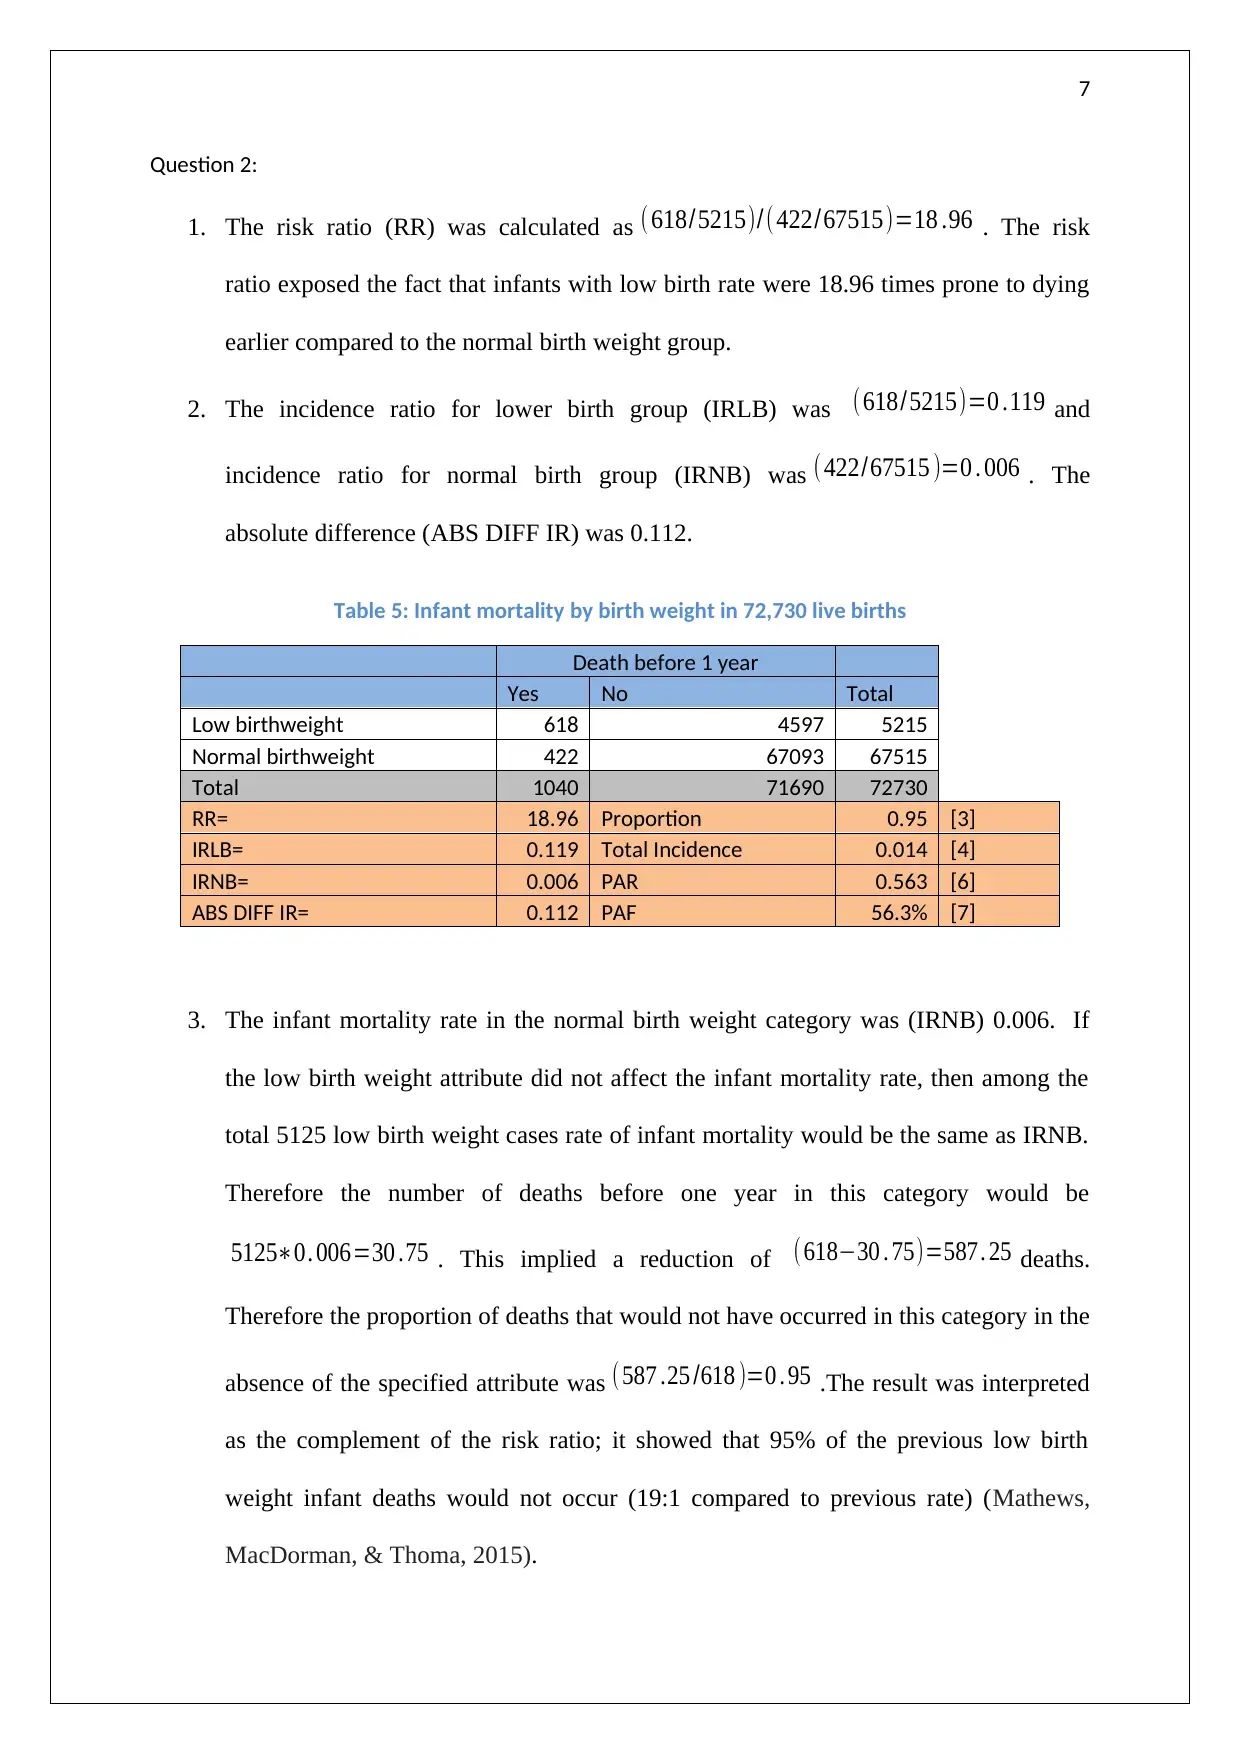
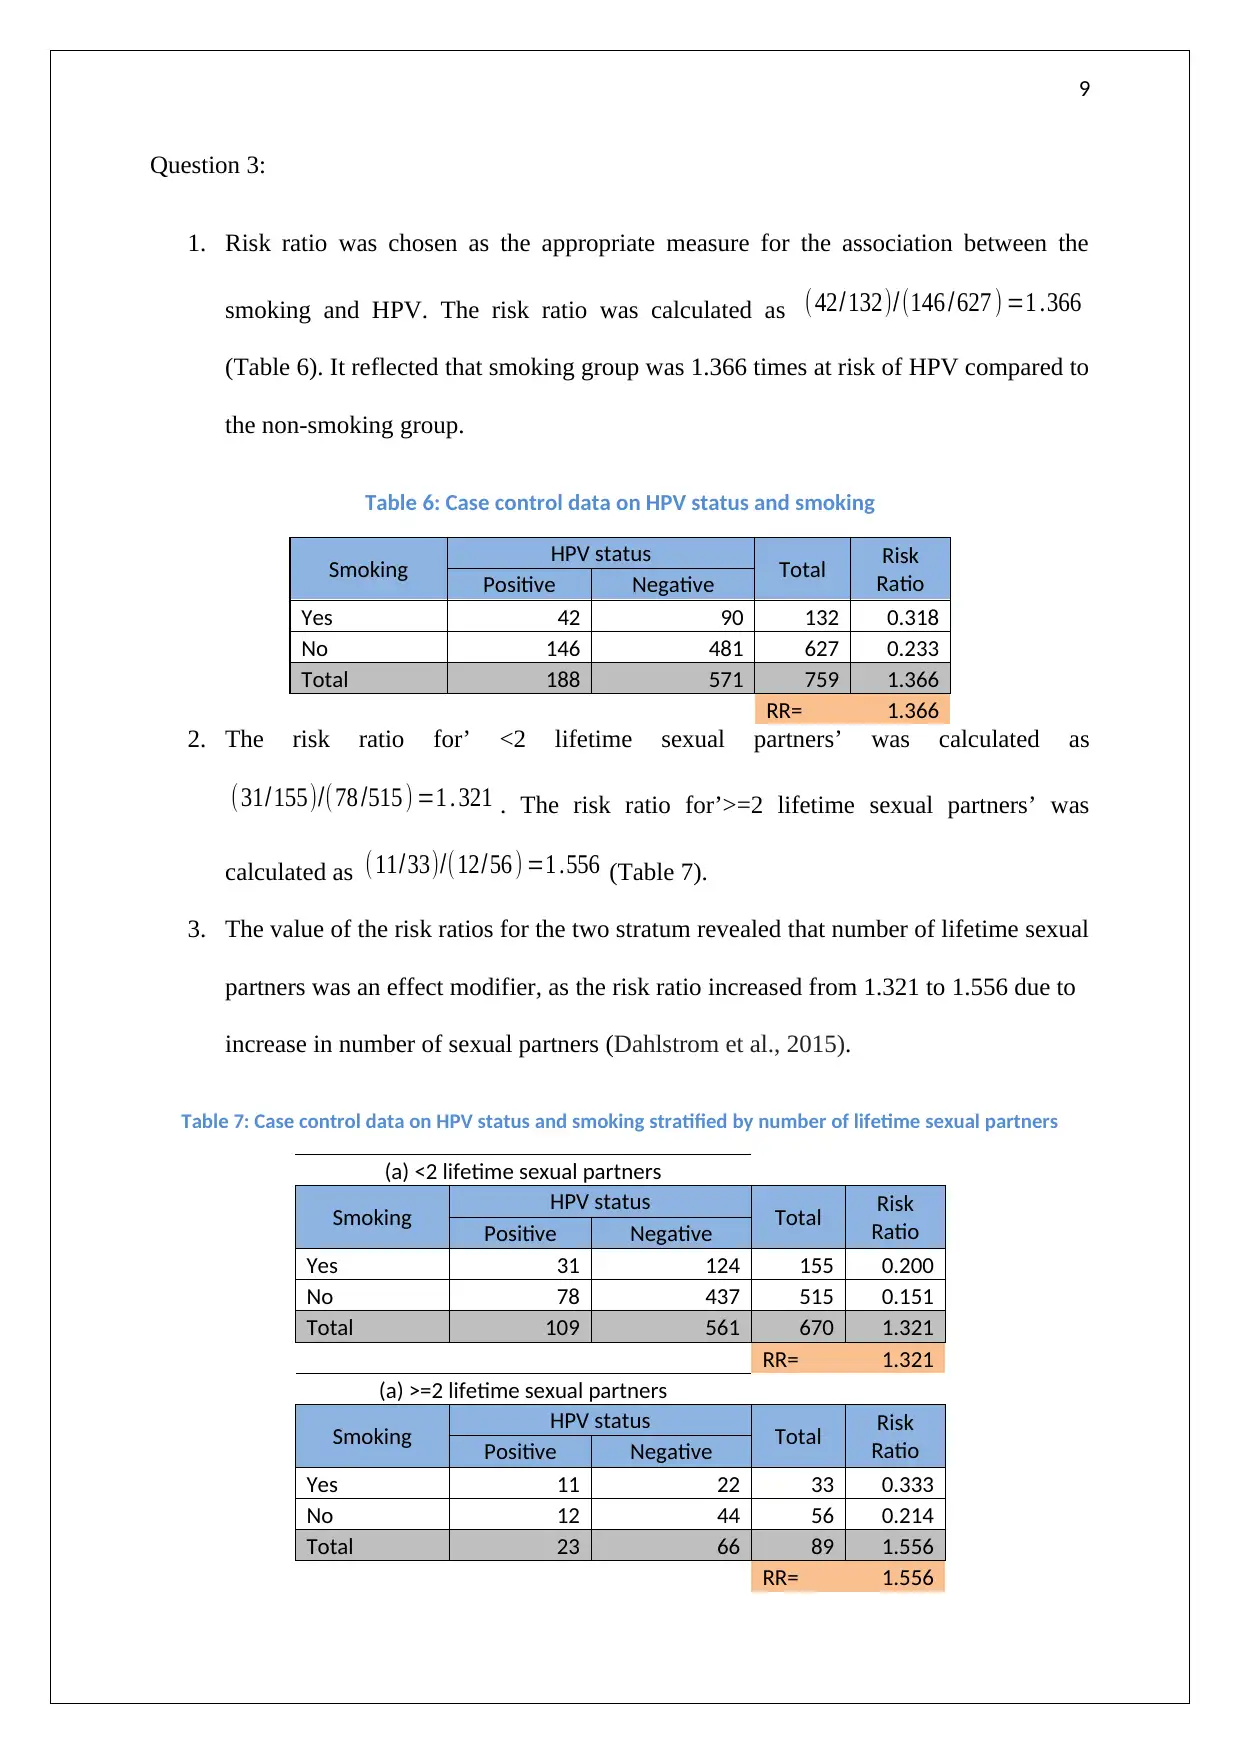
This epidemiology assignment analyzes cancer and infant mortality data, exploring various statistical measures and risk factors. The assignment begins by comparing crude and age-specific cancer death rates between Australia and Brazil, highlighting the exponential increase in death rates with age and the differences observed in specific age groups. It then delves into age-standardized death rates, demonstrating how this method adjusts for population age differences. The assignment also examines infant mortality, calculating risk ratios related to low birth weight and assessing the impact of this factor on infant mortality rates. Finally, it investigates the association between smoking and HPV, calculating risk ratios and exploring the effect of lifetime sexual partners as a potential modifier. The analysis includes the use of tables, graphs, and statistical calculations to support the findings.
Document Page
1
Problems in Epidemiology
Student Name: Student ID:
Subject Name: Subject ID:
Due Date:
tabler-icon-diamond-filled.svg

Secure Best Marks with AI Grader

Need help grading? Try our AI Grader for instant feedback on your assignments.
Document Page
2
Question: 1
1. A. Crude death for Australia is calculated as the ratio of total deaths across all age
groups to the total population across all age groups. The ratio has been multiplied by
100,000 to obtain crude death ratefor(per 100,000) population across all age groups.
The value of crude death rate for Australia was 187.56 (Table 1). The crude death rate
for (per 100,000) population of Brazil was 108.41 (Table 2). It was observed that,
overall death due to Cancer (per 100,000 Population) in 2012 across all age groups in
Australia was (187.56/108.41) 1.73 times than that of Brazil.
Table 1: Crude and age-specific death rates due to Cancer, Australia, 2012
Age group Deaths Total Population Death per Percentage
(years) 100,000 population Death Rate
0-14 83 42,93,707 1.93 0.00%
15-39 618 79,86,708 7.74 0.01%
40-44 486 15,73,829 30.88 0.03%
45-49 1017 15,74,299 64.60 0.06%
50-54 1775 15,41,187 115.17 0.12%
55-59 2687 14,29,322 187.99 0.19%
60-64 4090 13,04,820 313.45 0.31%
65-69 5174 11,30,258 457.77 0.46%
70-74 5717 8,71,194 656.23 0.66%
75+ 21756 14,36,087 1514.95 1.51%
Total (all ages) 43,403 2,31,41,411 187.56 0.19%
Table 2: Crude and age-specific death rates due to Cancer,Brazil,2012
Age group Deaths Total Population Death per Percentage
(years) 100,000 population Death Rate
0-14 2189 4,93,94,260 4.43 0.00%
15-39 11498 8,43,46,803 13.63 0.01%
40-44 7357 1,37,02,929 53.69 0.05%
45-49 12545 1,32,97,949 94.34 0.09%
50-54 18363 1,21,42,051 151.23 0.15%
55-59 22773 1,02,32,887 222.55 0.22%
60-64 25788 81,40,348 316.79 0.32%
65-69 26818 61,45,190 436.41 0.44%
70-74 29060 45,02,998 645.35 0.65%
75+ 68303 53,64,191 1,273.31 1.27%
Total (all ages) 2,24,694 20,72,69,606 108.41 0.11%
Document Page
3
B. Age specific death ratios have been calculated in table 1 and table2 for each age group,
both in percentage format and ‘per 100,000 Population’. These values were calculated as the
ratio of deaths in an age group to the total population in that age group and then multiplied by
100,000. For example the death rate for Australia in the age group of 0-14 was calculated as
(83/42,93,707)*100,000 = 1.93.
C. The age-specific death rates for Australia and Brazil was graphed using bar-chart. Figure1
and figure2 represents the trend in age specific death rates for Australia and Brazil in 2012.
Exponential increase in cancer-death rate was witnessed with increase in age for Australia as
well for Brazil in 2012. Specific comparison for each age group revealed an interesting trend.
For the age groups below 55 years of age, the age specific death rates for Australia were
significantly lower compared to corresponding age group rates for Brazil. The reverse of this
trend was observed for age groups over 55 years of age (Melaku et al., 2018).
0-14 15-39 40-44 45-49 50-54 55-59 60-64 65-69 70-74 75+
0.00
200.00
400.00
600.00
800.00
1000.00
1200.00
1400.00
1600.00
Age-Specific Death Rates for Australia, 2012
No of Deaths
Figure 1: Age specific death rates of Australia in 2012
Document Page
4
0-14 15-39 40-44 45-49 50-54 55-59 60-64 65-69 70-74 75+
-
200.00
400.00
600.00
800.00
1,000.00
1,200.00
1,400.00
1,600.00
Age-Specific Death Rates for Brazil, 2012
No of Deaths
Figure 2: Age specific death rates of Brazil in 2012
D. Crude Cancer death in Australia was at 187.56 per 100,000 Population. But the age
specific death rate of the country in 2012, which was represented in figure 1, revealed that the
rate was lowest (1.93 per 100,000 people) for the age group of 0-14. The rate increased with
gradual increase in age. But the jumps in difference for the death rates were comparatively
high after the age of 55 years. The death rate at the age bracket of 50-54 was 115.17 (per
100,000 people), whereas the rate was 187.99 for the age group of 55-59 years. Maximum
rate was observed for 75 or more age group with death rate of 1514.95 per 100,000 people.
tabler-icon-diamond-filled.svg

Secure Best Marks with AI Grader

Need help grading? Try our AI Grader for instant feedback on your assignments.
Document Page
5
2. A. Age-standardize death rates were calculated for Australia and Brazil using World
Standard population. The calculated age-standardize death rates values for Australia and
Brazil have been provided in Table 3 and Table 4. The calculation for age group of 0-14 for
Australia was done as ( 83/4 ,293 , 707 )2 , 61 , 409=5 . 05 . For Brazil the similar formula was
used. For example the age-standardize death rate for the age group 0-14 was
(2189/ 4 ,93 ,94 ,260 )2 , 61 , 409=11 . 58 . Rest of the cells were calculated similarly for Table 3
and Table 4.
Table 3: Age-standardize death rates for Australia using World Standard population
Country Australia
Age
group Deaths Total Population Death World Standard Age Standardize
(years) Rate population Death Rate
0-14 83 42,93,707 0.00% 2,61,409 5.05
15-39 618 79,86,708 0.01% 3,93,661 30.46
40-44 486 15,73,829 0.03% 65,877 20.34
45-49 1017 15,74,299 0.06% 60,379 39.00
50-54 1775 15,41,187 0.12% 53,681 61.82
55-59 2687 14,29,322 0.19% 45,484 85.51
60-64 4090 13,04,820 0.31% 37,187 116.56
65-69 5174 11,30,258 0.46% 29,590 135.45
70-74 5717 8,71,194 0.66% 22,092 144.97
75+ 21756 14,36,087 1.51% 30,640 464.18
Total 10,00,000 1103.37
Document Page
6
Table 4: Age-standardize death rates for Brazil using World Standard population
Country Brazil
Age
group
Death
s
Total
Population Death World Standard
Age
Standardize
(years) Rate population Death Rate
0-14 2189 4,93,94,260 0.00% 2,61,409 11.58
15-39 11498 8,43,46,803 0.01% 3,93,661 53.66
40-44 7357 1,37,02,929 0.05% 65,877 35.37
45-49 12545 1,32,97,949 0.09% 60,379 56.96
50-54 18363 1,21,42,051 0.15% 53,681 81.18
55-59 22773 1,02,32,887 0.22% 45,484 101.22
60-64 25788 81,40,348 0.32% 37,187 117.81
65-69 26818 61,45,190 0.44% 29,590 129.13
70-74 29060 45,02,998 0.65% 22,092 142.57
75+ 68303 53,64,191 1.27% 30,640 390.14
Total 10,00,000 1119.64
B. The crude death rate for Australia was 187.56 per 100,000 persons whereas age-
standardized rate was 1103.37 per 10, 00,000 persons. Hence the decrease in death rate was
visible due to age standardization. For Brazil the crude rate was 108.41 per 100,000 persons
whereas age-standardized rate was 1119.64 per 10, 00,000 persons. For Brazil the age
standardization rate was higher than crude death rate (He et al., 2017).
While comparing the two countries, it was discovered that age-standardized death rate for
Brazil was more compared to Australia.
Document Page
7
Question 2:
1. The risk ratio (RR) was calculated as (618/5215)/(422/67515)=18 .96 . The risk
ratio exposed the fact that infants with low birth rate were 18.96 times prone to dying
earlier compared to the normal birth weight group.
2. The incidence ratio for lower birth group (IRLB) was (618/5215)=0 .119 and
incidence ratio for normal birth group (IRNB) was (422/67515 )=0 . 006 . The
absolute difference (ABS DIFF IR) was 0.112.
Table 5: Infant mortality by birth weight in 72,730 live births
Death before 1 year
Yes No Total
Low birthweight 618 4597 5215
Normal birthweight 422 67093 67515
Total 1040 71690 72730
RR= 18.96 Proportion 0.95 [3]
IRLB= 0.119 Total Incidence 0.014 [4]
IRNB= 0.006 PAR 0.563 [6]
ABS DIFF IR= 0.112 PAF 56.3% [7]
3. The infant mortality rate in the normal birth weight category was (IRNB) 0.006. If
the low birth weight attribute did not affect the infant mortality rate, then among the
total 5125 low birth weight cases rate of infant mortality would be the same as IRNB.
Therefore the number of deaths before one year in this category would be
51250. 006=30 .75 . This implied a reduction of ( 61830 . 75)=587. 25 deaths.
Therefore the proportion of deaths that would not have occurred in this category in the
absence of the specified attribute was (587 .25 /618 )=0 . 95 .The result was interpreted
as the complement of the risk ratio; it showed that 95% of the previous low birth
weight infant deaths would not occur (19:1 compared to previous rate) (Mathews,
MacDorman, & Thoma, 2015).
tabler-icon-diamond-filled.svg

Paraphrase This Document

Need a fresh take? Get an instant paraphrase of this document with our AI Paraphraser
Document Page
8
4. Overall incidence of infant mortality (Total Incidence) was evaluated as the ratio of
total number of deaths before one year (1040) to the total number of births (72730).
This was calculated as 0.014 (Table 5).
5. If there were no low birth weight births, then the incidence rate of infant mortality
would be identical to the case of normal birth weight births (IRNB), 0.006.
6. The risk ratio (RR) was 18.96 and the ratio (Pe) between total births for low birth
weight and total population was (5215/72730)=0. 072 . The population attribution
risk (PAR) was evaluated as ( Pe( RR1) )/( Pe( RR1 )+ 1)= 0. 563 . PAR of 0.563
indicated the proportion of infant mortality cases that would not have had occurred in
the total population of births if the low birth weight attribute factor was eliminated.
7. Population attribute fraction (PAF) was 56.3%, which was the percentage from of
PAR.
Document Page
9
Question 3:
1. Risk ratio was chosen as the appropriate measure for the association between the
smoking and HPV. The risk ratio was calculated as (42/132)/(146 /627 ) =1 .366
(Table 6). It reflected that smoking group was 1.366 times at risk of HPV compared to
the non-smoking group.
Table 6: Case control data on HPV status and smoking
Smoking HPV status Total Risk
RatioPositive Negative
Yes 42 90 132 0.318
No 146 481 627 0.233
Total 188 571 759 1.366
RR= 1.366
2. The risk ratio for’ <2 lifetime sexual partners’ was calculated as
(31/155)/(78 /515 ) =1 . 321 . The risk ratio for’>=2 lifetime sexual partners’ was
calculated as ( 11/33)/( 12/56 ) =1 .556 (Table 7).
3. The value of the risk ratios for the two stratum revealed that number of lifetime sexual
partners was an effect modifier, as the risk ratio increased from 1.321 to 1.556 due to
increase in number of sexual partners (Dahlstrom et al., 2015).
Table 7: Case control data on HPV status and smoking stratified by number of lifetime sexual partners
(a) <2 lifetime sexual partners
Smoking HPV status Total Risk
RatioPositive Negative
Yes 31 124 155 0.200
No 78 437 515 0.151
Total 109 561 670 1.321
RR= 1.321
(a) >=2 lifetime sexual partners
Smoking HPV status Total Risk
RatioPositive Negative
Yes 11 22 33 0.333
No 12 44 56 0.214
Total 23 66 89 1.556
RR= 1.556
Document Page
10
References
Melaku, Y.A., Appleton, S.L., Gill, T.K., Ogbo, F.A., Buckley, E., Shi, Z., Driscoll, T.,
Adams, R., Cowie, B.C. and Fitzmaurice, C., 2018. Incidence, prevalence, mortality,
disability-adjusted life years and risk factors of cancer in Australia and comparison with
OECD countries, 1990–2015: findings from the Global Burden of Disease Study
2015. Cancer epidemiology, 52, pp.43-54.
He, V.Y., Condon, J.R., Baade, P.D., Zhang, X. and Zhao, Y., 2017. Different survival
analysis methods for measuring long-term outcomes of Indigenous and non-Indigenous
Australian cancer patients in the presence and absence of competing risks. Population health
metrics, 15(1), p.1.
Dahlstrom, K.R., Bell, D., Hanby, D., Li, G., Wang, L.E., Wei, Q., Williams, M.D. and
Sturgis, E.M., 2015. Socioeconomic characteristics of patients with oropharyngeal carcinoma
according to tumor HPV status, patient smoking status, and sexual behavior. Oral
oncology, 51(9), pp.832-838.
Mathews, T.J., MacDorman, M.F. and Thoma, M.E., 2015. Infant mortality statistics from the
2013 period linked birth/infant death data set.
chevron_up_icon
1 out of 10
circle_padding
hide_on_mobile
zoom_out_icon
[object Object]