Epidemiology Biostatistics Homework: Data Analysis and Insights

Verified

Added on  2022/11/26

|13
|1097
|437
Homework Assignment
AI Summary
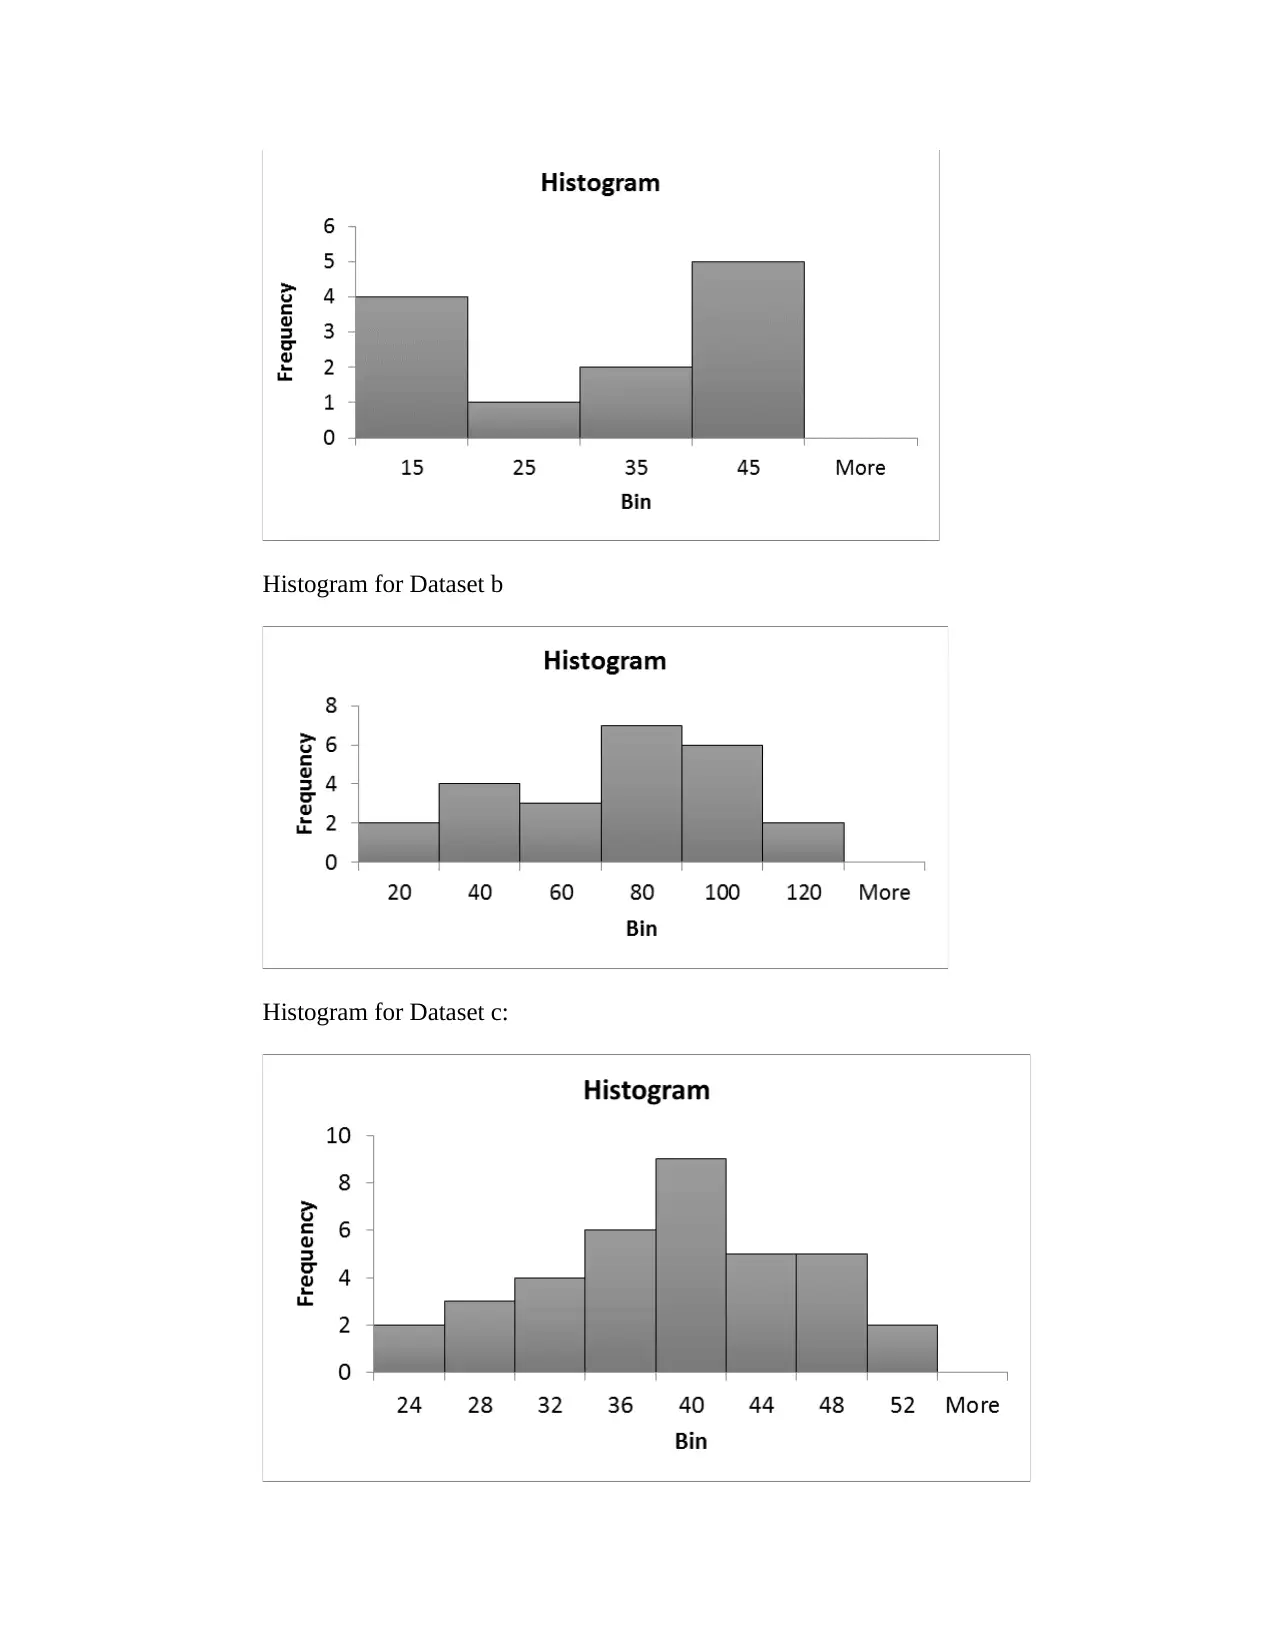
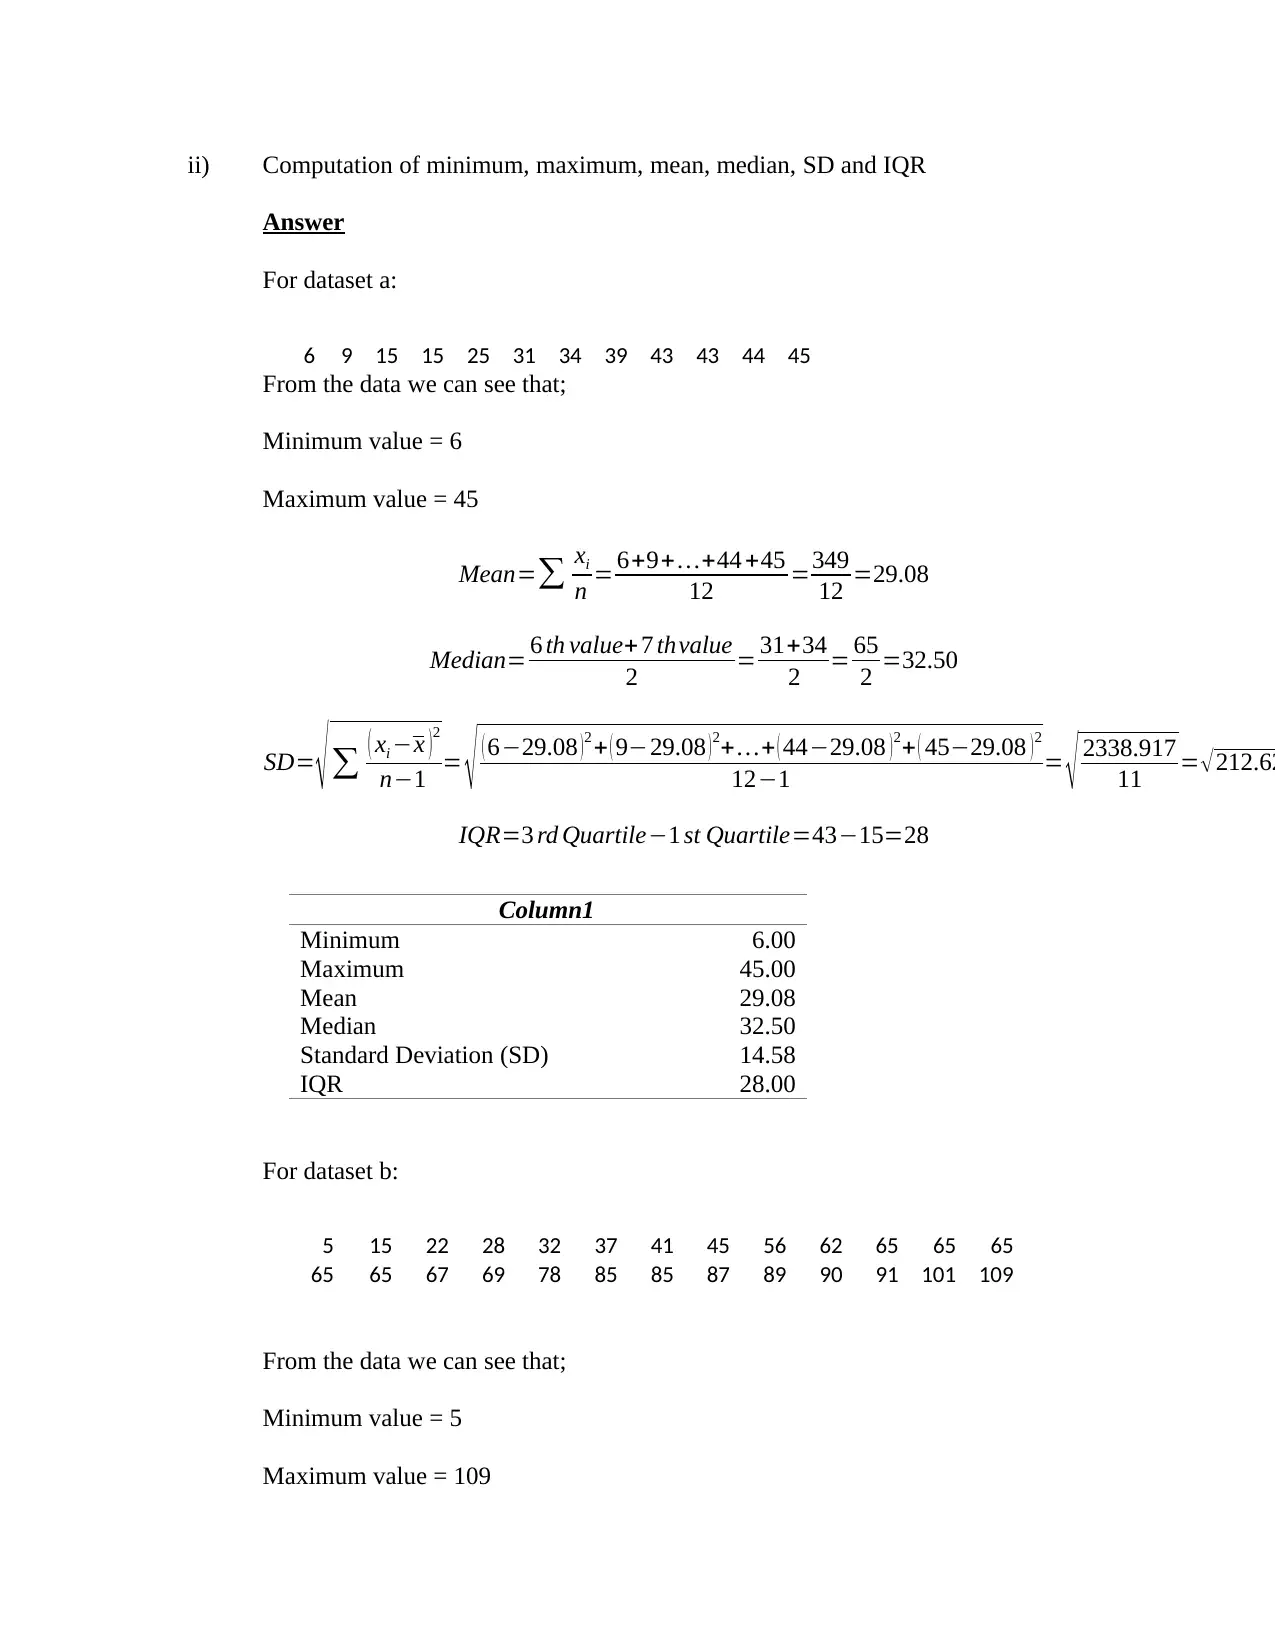
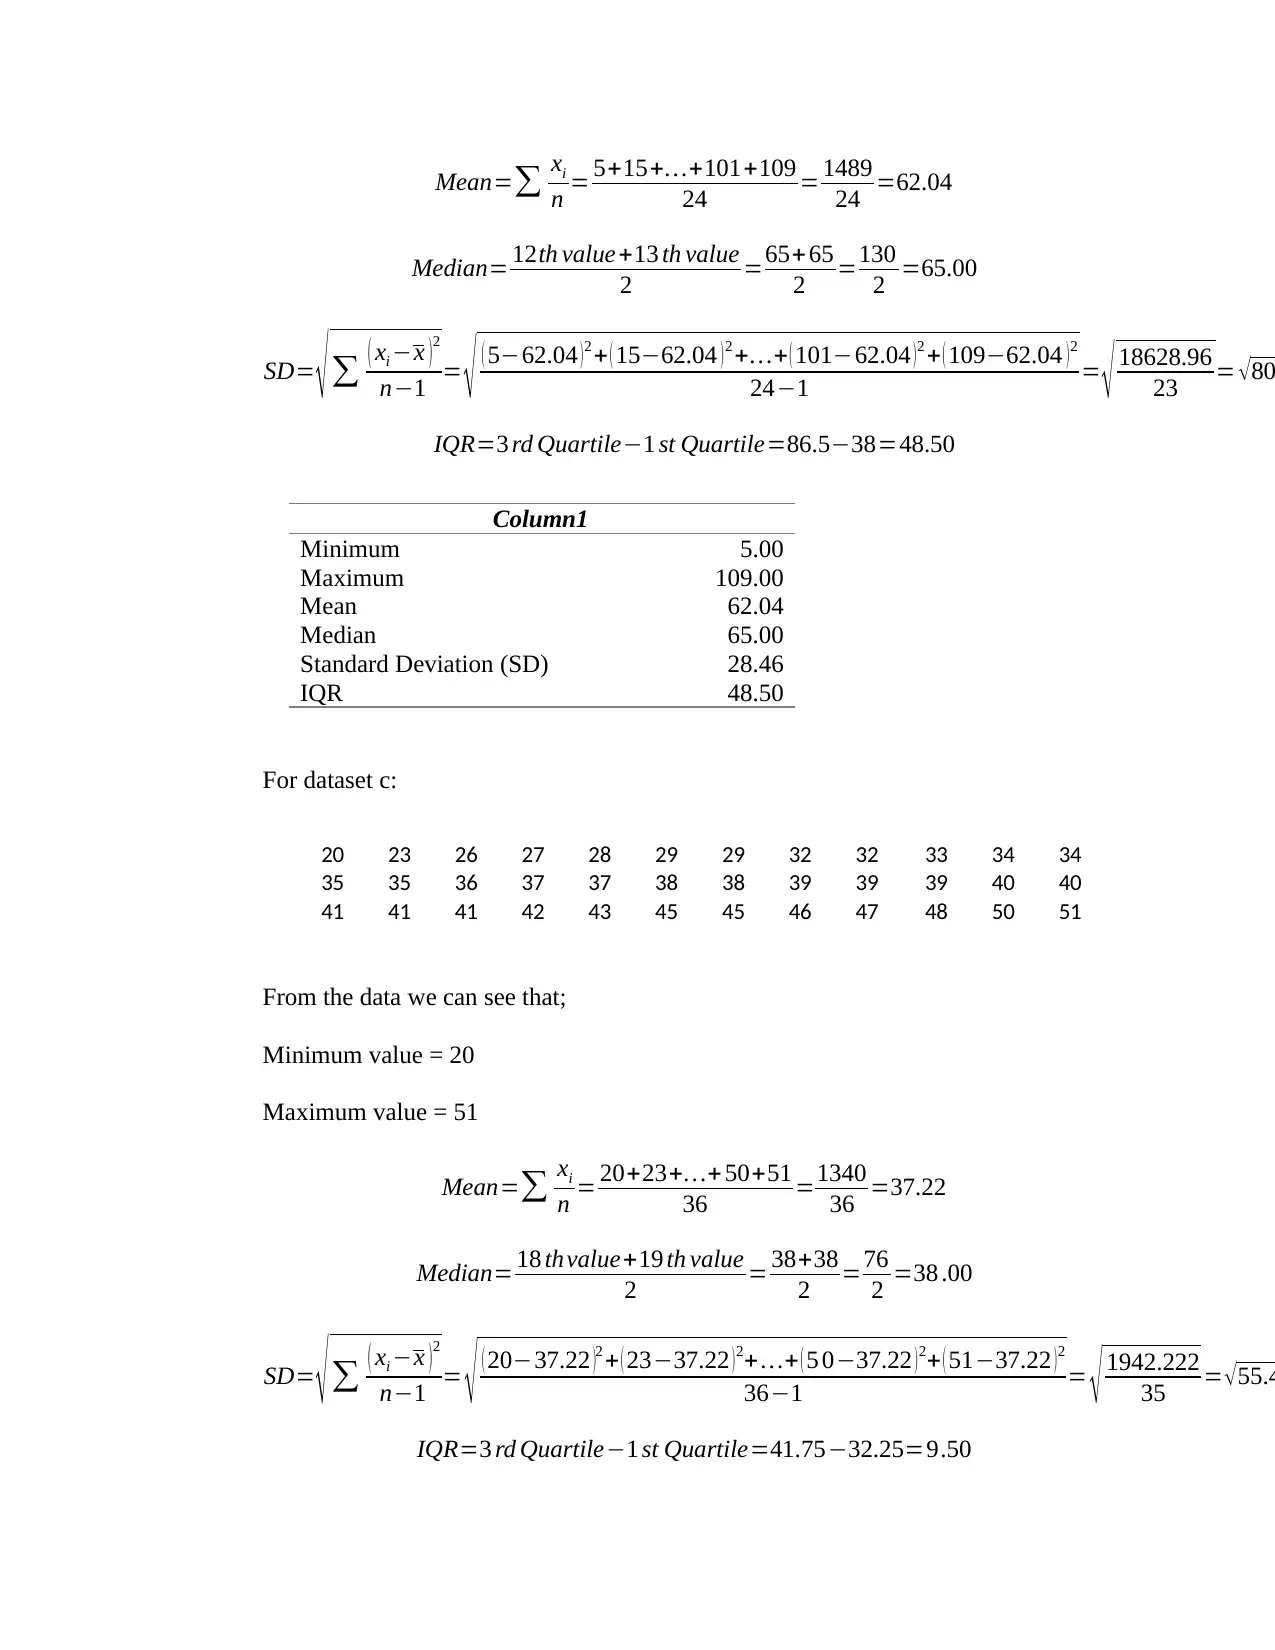
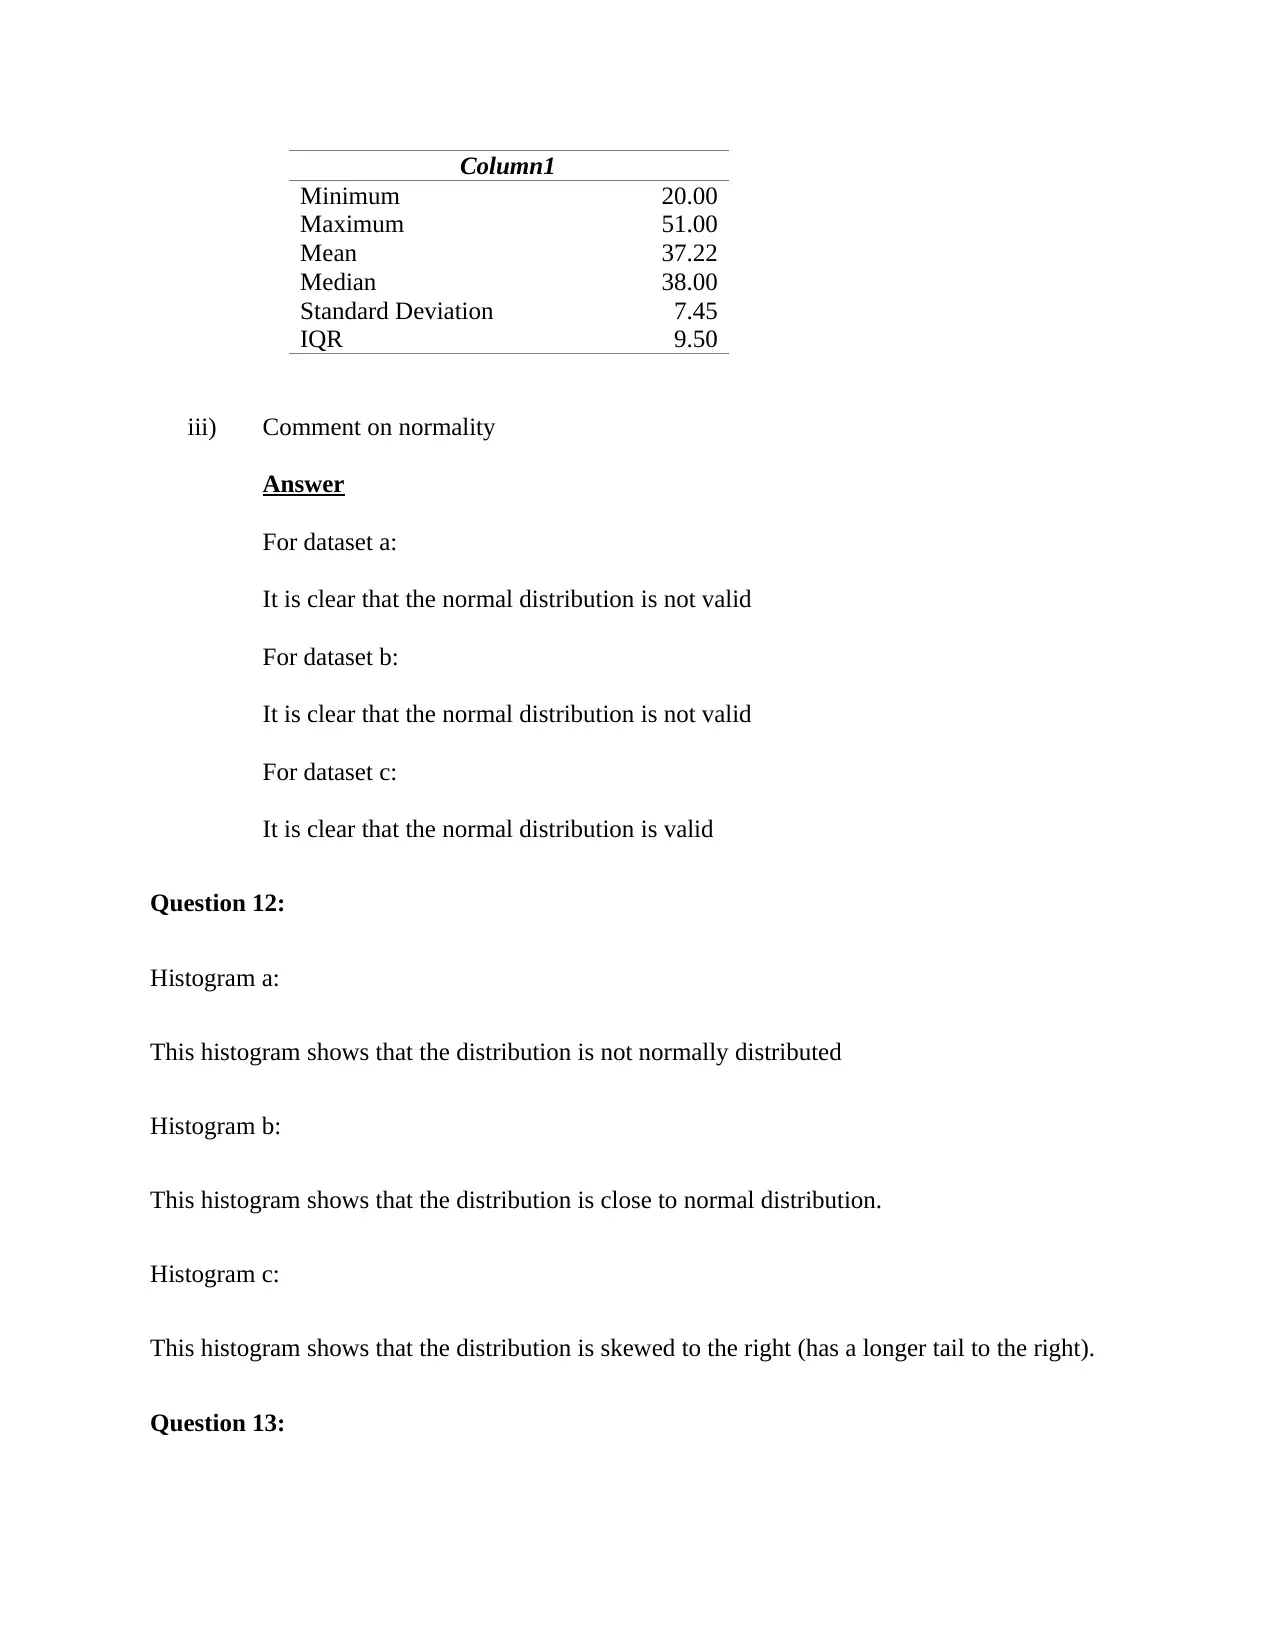
This document presents a comprehensive solution to an epidemiology biostatistics assignment, addressing various statistical concepts and techniques. The assignment covers a range of topics, including identifying data types, calculating proportions and standard errors, interpreting histograms, and analyzing scatterplots. The solution includes detailed calculations, interpretations of distributions, and comparisons of data sets. Key areas of focus include the analysis of normal distributions, skewness, and the application of statistical methods to real-world scenarios, such as assessing the relationship between weight and RN scores. The document provides a complete breakdown of the problem-solving process, offering valuable insights into data analysis and interpretation. Furthermore, the assignment explores the concepts of mean, median, range, standard deviation, and standard error, providing a robust understanding of statistical principles.
tabler-icon-diamond-filled.svg

Contribute Materials

Your contribution can guide someone’s learning journey. Share your documents today.
Document Page
Epidemiology biostatistics
Student Name:
Instructor Name:
Course Number:
18 May 2019
tabler-icon-diamond-filled.svg

Secure Best Marks with AI Grader

Need help grading? Try our AI Grader for instant feedback on your assignments.
Document Page
Question 1:
Not a valid proportion
Answer
1.2 is not a valid proportion
Question 2:
Data type
Answer
Nominal is the data type for male
Question 3:
Data type
Answer
This is a continuous data
Question 4:
A patient is recorded as having 3rd degree burns. What type of data is this?
Answer
This is ordinal type of data
Question 5:
The true statement regarding the sex differences between particular matter exposures.
Document Page
Answer
The true choice is c which says that the men in this sample have a larger range of particulate
matter exposure values than the women.
Question 6:
The true statement regarding the sex differences between depression scores.
Answer
The true choice is b which says the distribution of depression scores in men and women are
skewed in opposing directions.
Question 7:
Normal resting heart rate.
Answer
The correct choice is b which says that the team’s resting heart rates are at the lower end of
normal resting heart rate for adults.
Question 8:
Which one of the statements about the number 0.18 is correct?
Answer
The correct answer is a. Which says it is a sample proportion.
Question 9:
The estimated difference in proportion
Document Page
Answer
The estimated difference in proportion is computed as follows;
Females: p= 15
10 0 =0.15
Males: p= 12
100 =0.12
So the difference in proportion is 0.150.12=0.03
Therefore the difference in proportion is 0.03.
Question 10:
Standard error of the mean
Answer
The formula for the standard error of the mean is given as
S . E ( x ) = s
n
¿ 4.5
12 =1.299
Therefore the answer is b which is 1.299.
Question 11:
i) Histogram
Answer
Histogram for Dataset a
tabler-icon-diamond-filled.svg

Secure Best Marks with AI Grader

Need help grading? Try our AI Grader for instant feedback on your assignments.
Document Page
Histogram for Dataset b
Histogram for Dataset c:
Document Page
ii) Computation of minimum, maximum, mean, median, SD and IQR
Answer
For dataset a:
6 9 15 15 25 31 34 39 43 43 44 45
From the data we can see that;
Minimum value = 6
Maximum value = 45
Mean= xi
n = 6+9+ +44 +45
12 =349
12 =29.08
Median= 6 th value+7 thvalue
2 = 31+34
2 = 65
2 =32.50
SD= ( xi x ) 2
n1 = ( 629.08 ) 2 + ( 929.08 ) 2++ ( 4429.08 ) 2+ ( 4529.08 ) 2
121 = 2338.917
11 = 212.62
IQR=3 rd Quartile1 st Quartile=4315=28
Column1
Minimum 6.00
Maximum 45.00
Mean 29.08
Median 32.50
Standard Deviation (SD) 14.58
IQR 28.00
For dataset b:
5 15 22 28 32 37 41 45 56 62 65 65 65
65 65 67 69 78 85 85 87 89 90 91 101 109
From the data we can see that;
Minimum value = 5
Maximum value = 109
Document Page
Mean= xi
n = 5+15++101+109
24 = 1489
24 =62.04
Median= 12th value+13 th value
2 =65+ 65
2 =130
2 =65.00
SD= ( xi x )2
n1 = ( 562.04 )2 + ( 1562.04 )2 ++ ( 10162.04 )2 + ( 10962.04 )2
241 = 18628.96
23 = 80
IQR=3 rd Quartile1 st Quartile=86.538=48.50
Column1
Minimum 5.00
Maximum 109.00
Mean 62.04
Median 65.00
Standard Deviation (SD) 28.46
IQR 48.50
For dataset c:
20 23 26 27 28 29 29 32 32 33 34 34
35 35 36 37 37 38 38 39 39 39 40 40
41 41 41 42 43 45 45 46 47 48 50 51
From the data we can see that;
Minimum value = 20
Maximum value = 51
Mean= xi
n = 20+23++ 50+51
36 =1340
36 =37.22
Median= 18 thvalue+19 th value
2 = 38+38
2 =76
2 =38 .00
SD= ( xi x ) 2
n1 = ( 2037.22 )2 + ( 2337.22 ) 2+ + ( 5 037.22 ) 2+ ( 5137.22 ) 2
361 = 1942.222
35 = 55.4
IQR=3 rd Quartile1 st Quartile=41.7532.25=9.50
tabler-icon-diamond-filled.svg

Paraphrase This Document

Need a fresh take? Get an instant paraphrase of this document with our AI Paraphraser
Document Page
Column1
Minimum 20.00
Maximum 51.00
Mean 37.22
Median 38.00
Standard Deviation 7.45
IQR 9.50
iii) Comment on normality
Answer
For dataset a:
It is clear that the normal distribution is not valid
For dataset b:
It is clear that the normal distribution is not valid
For dataset c:
It is clear that the normal distribution is valid
Question 12:
Histogram a:
This histogram shows that the distribution is not normally distributed
Histogram b:
This histogram shows that the distribution is close to normal distribution.
Histogram c:
This histogram shows that the distribution is skewed to the right (has a longer tail to the right).
Question 13:
Document Page
808 882 1062 970 909 802 374 416 784 997 651 716 438 1420 1525 948 1050 976 572 403 626
774 1253 549 1325 446 465 1769 671 696 1156 684 1933 748 1203 2433 1255 1100
a) Interpreting the distribution of the histogram
Answer
The distribution of calcium intake is skewed to the right (positively skewed). This is
based on the shape of the histogram which has a longer tail to the right.
b) Calculating the mean, median, range, standard deviation and the standard error
Answer
374 403 416 438 446 465 549 572 626 651 671 684 696
716 748 774 784 802 808 882 909 948 970 976 997 1050
1062 1100 1156 1203 1253 1255 1325 1420 1525 1769 1933 2433
From the data we can see that;
Minimum value = 374
Maximum value = 2433
Mean= xi
n = 374+ 403++1933+2433
38 = 35789
38 =941.82
Median= 19 th value+20 th value
2 = 808+882
2 = 1690
2 =845 .00
SD= ( xi x )2
n1 = ( 374941.82 )2 + ( 403941.82 )2 ++ ( 1933941.82 )2+ ( 2433941.82 )2
381 = 7446
37
Variance=SD2=448.622=201262.75
Standard error = SD
n = 448.62
38 =72.78
Calcium intake
Mean 941.82
Median 845.00
Document Page
Range 2059.00
Standard Deviation 448.62
Sample Variance 201262.75
Standard Error 72.78
c) What proportion of these women meet or exceed this intake
Answer
Proportion , ^p= x
n = 9
38 =0.2368
d) What is the mean and SD of the binomial distribution
Answer
Mean , x=np= 389
38 =9
SD= npq= 380.2368 ( 10.2368 ) = 6.867579=2.6206
e) An aged care home has 1240 residents, 897 men and 343 men. How many residents
would you expect to be meeting their RDA of calcium?
Answer
^p=0.2368
x=n ^p=0.23681240 294
For males we have;
x=n ^p=0.2368897 212
For females we have;
x=n ^p=0.2368343 81
Therefore approximately 294 residents are expected to meet their RDA of calcium.
Question 14:
a) Scatterplot between weight and RN
tabler-icon-diamond-filled.svg

Secure Best Marks with AI Grader

Need help grading? Try our AI Grader for instant feedback on your assignments.
Document Page
Answer
b) Comment on the plot
Answer
The above plot presents a scatter plot of RN score against weight. As can be seen,
there is a positive relationship between the two variables (RN score and weight).
c) Box plots
Answer
Document Page
d) Description of differences and similarities
Answer
Weight
Document Page
Considering the variable weight, in terms of similarities we can see that the box plot
for both the females and the males shows a right a skewed distribution (positively
skewed). In terms of the differences, we can see that the female weight data has some
outliers while that of the males does not have any outliers.
RN Score
Considering the variable RN Score, in terms of similarities we can see that the box
plot for both the females and the males shows that there are no outliers for both the
females and the males. In terms of the differences, we can see that the female RN
score is close to normal distribution while the male RN score is right skewed
(positively skewed).
e) Would sex be considered to confound the association between weight and RN Score?
Explain your reasoning.
Answer
Yes I believe that sex can be considered to confound the association between weight
and RN Score. This is based on the fact that the distribution of the data on RN score
based on sex greatly varies.
chevron_up_icon
1 out of 13
circle_padding
hide_on_mobile
zoom_out_icon
logo.png

Your All-in-One AI-Powered Toolkit for Academic Success.

Available 24*7 on WhatsApp / Email

[object Object]