Epidemiology 10 Assignment: Study Designs, Bias, and Analysis

Verified

Added on  2021/06/18

|10
|1463
|325
Homework Assignment
AI Summary
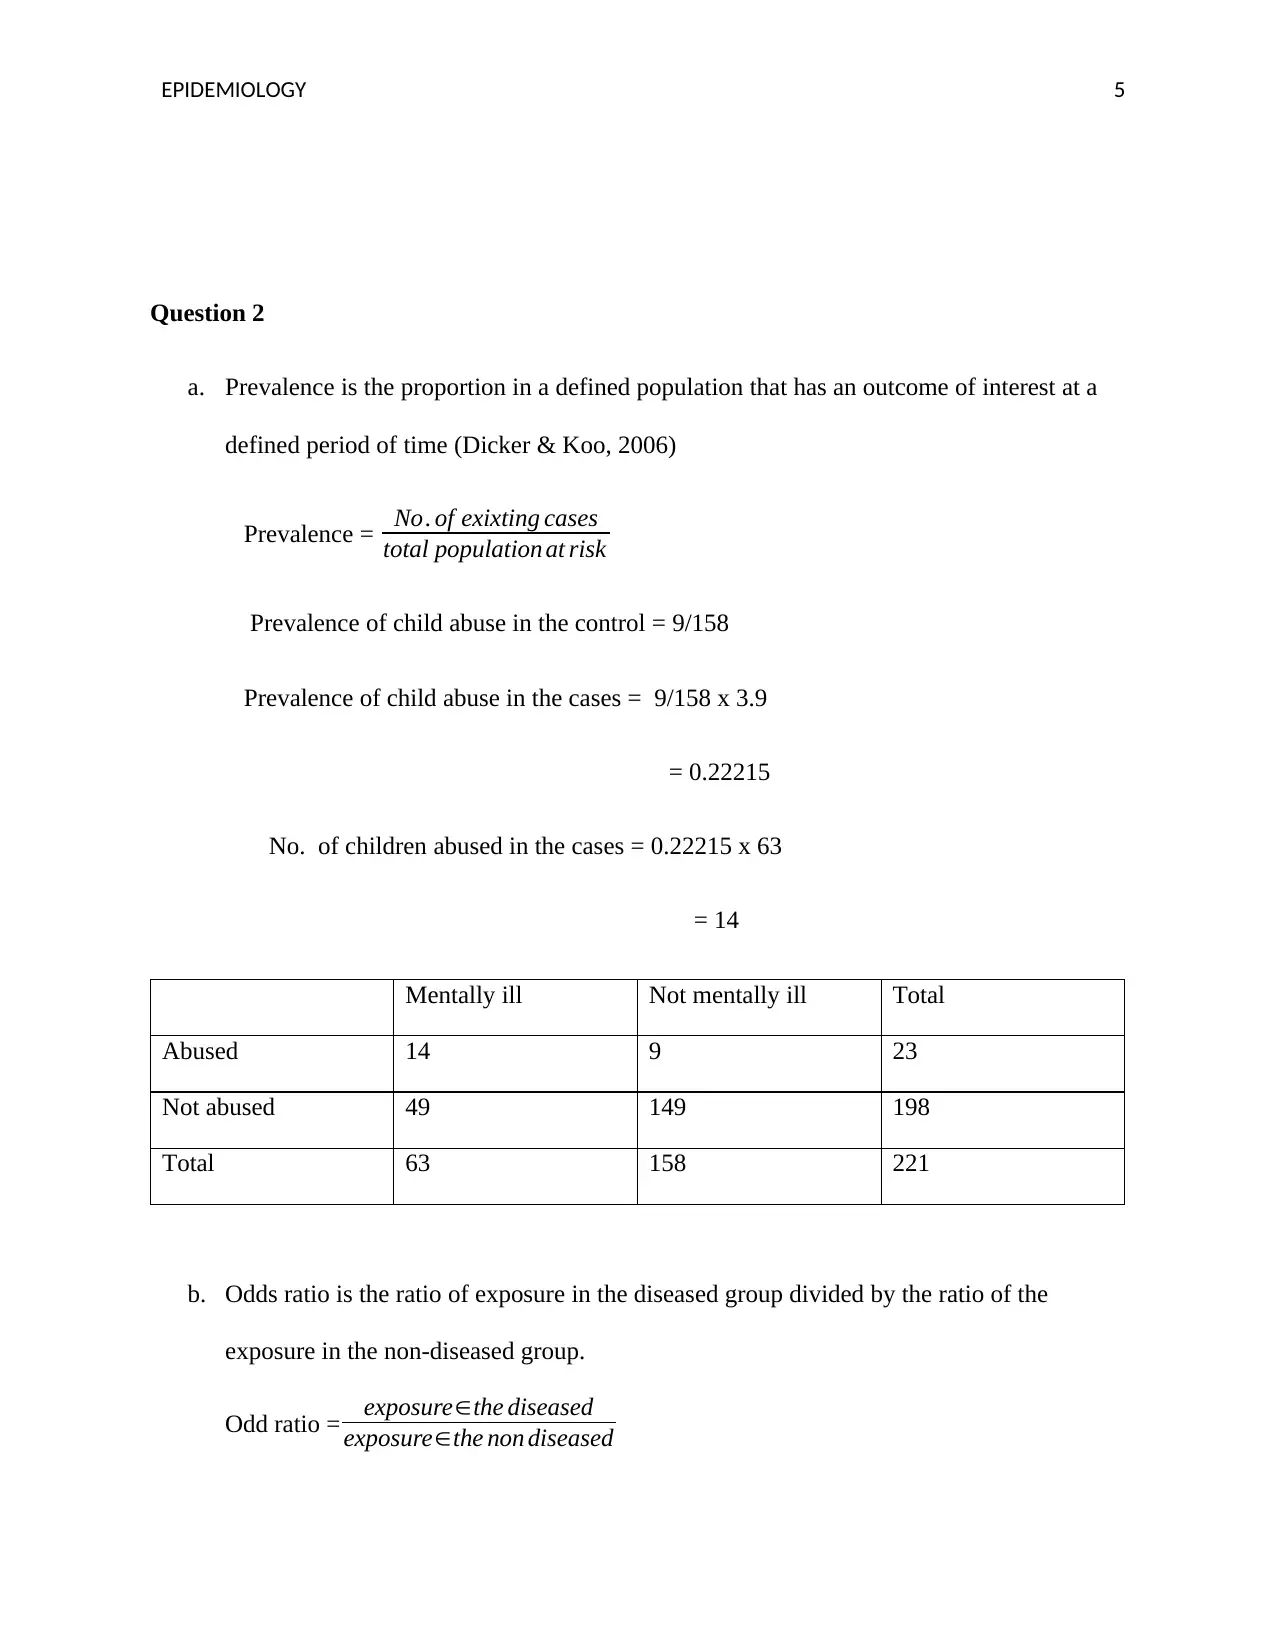
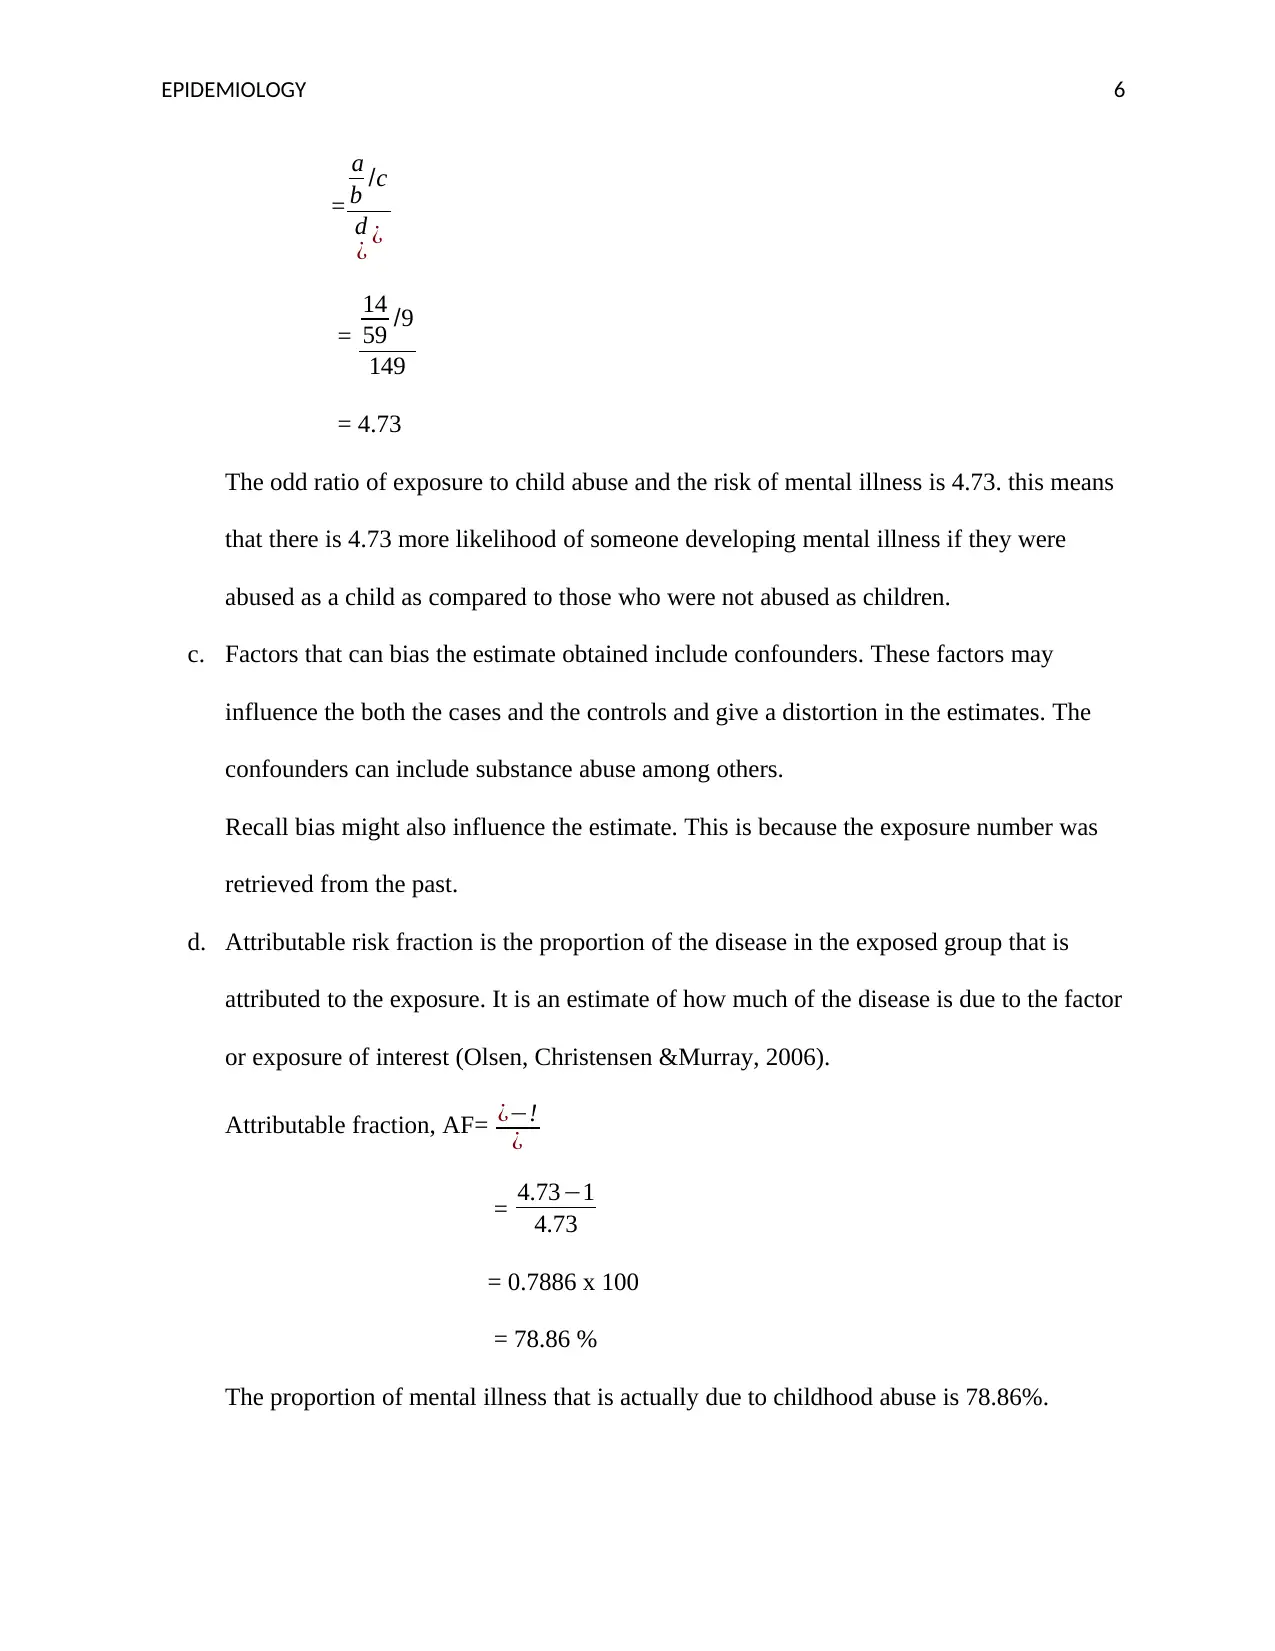
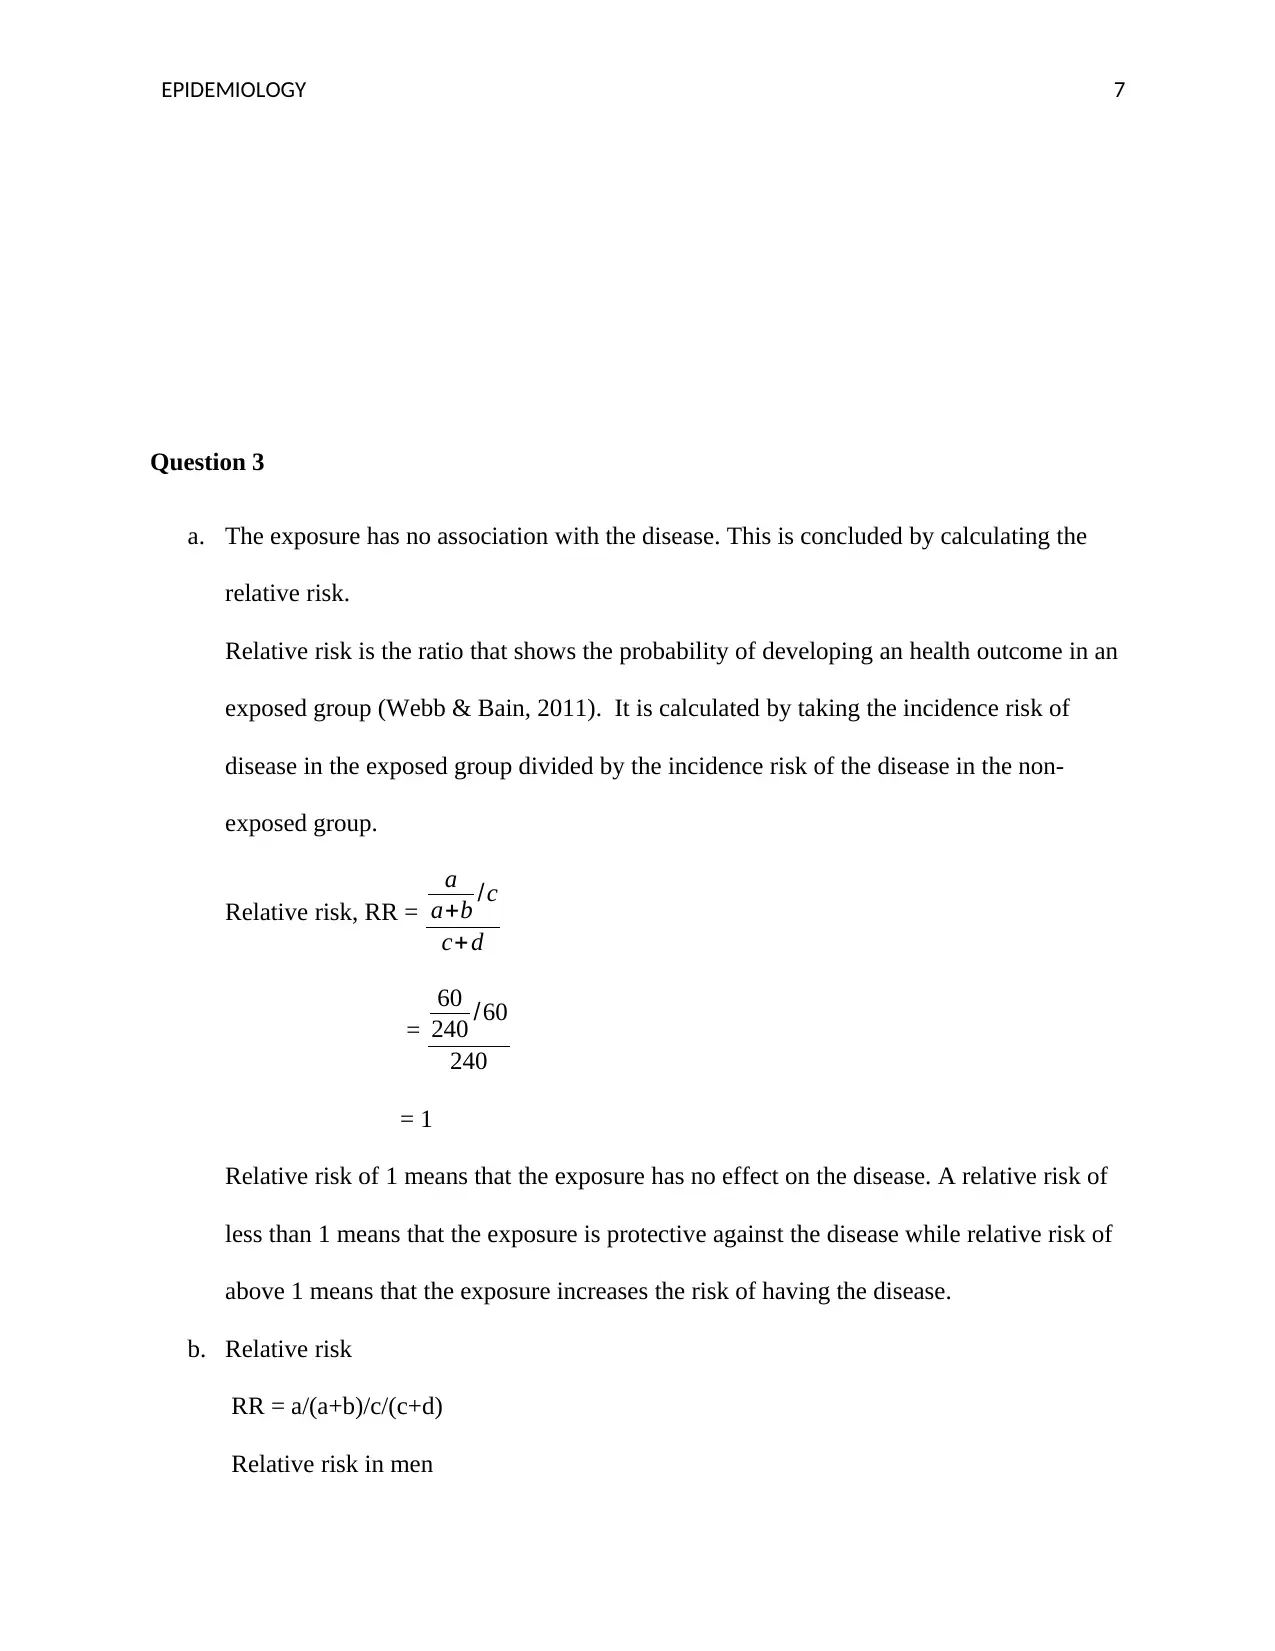
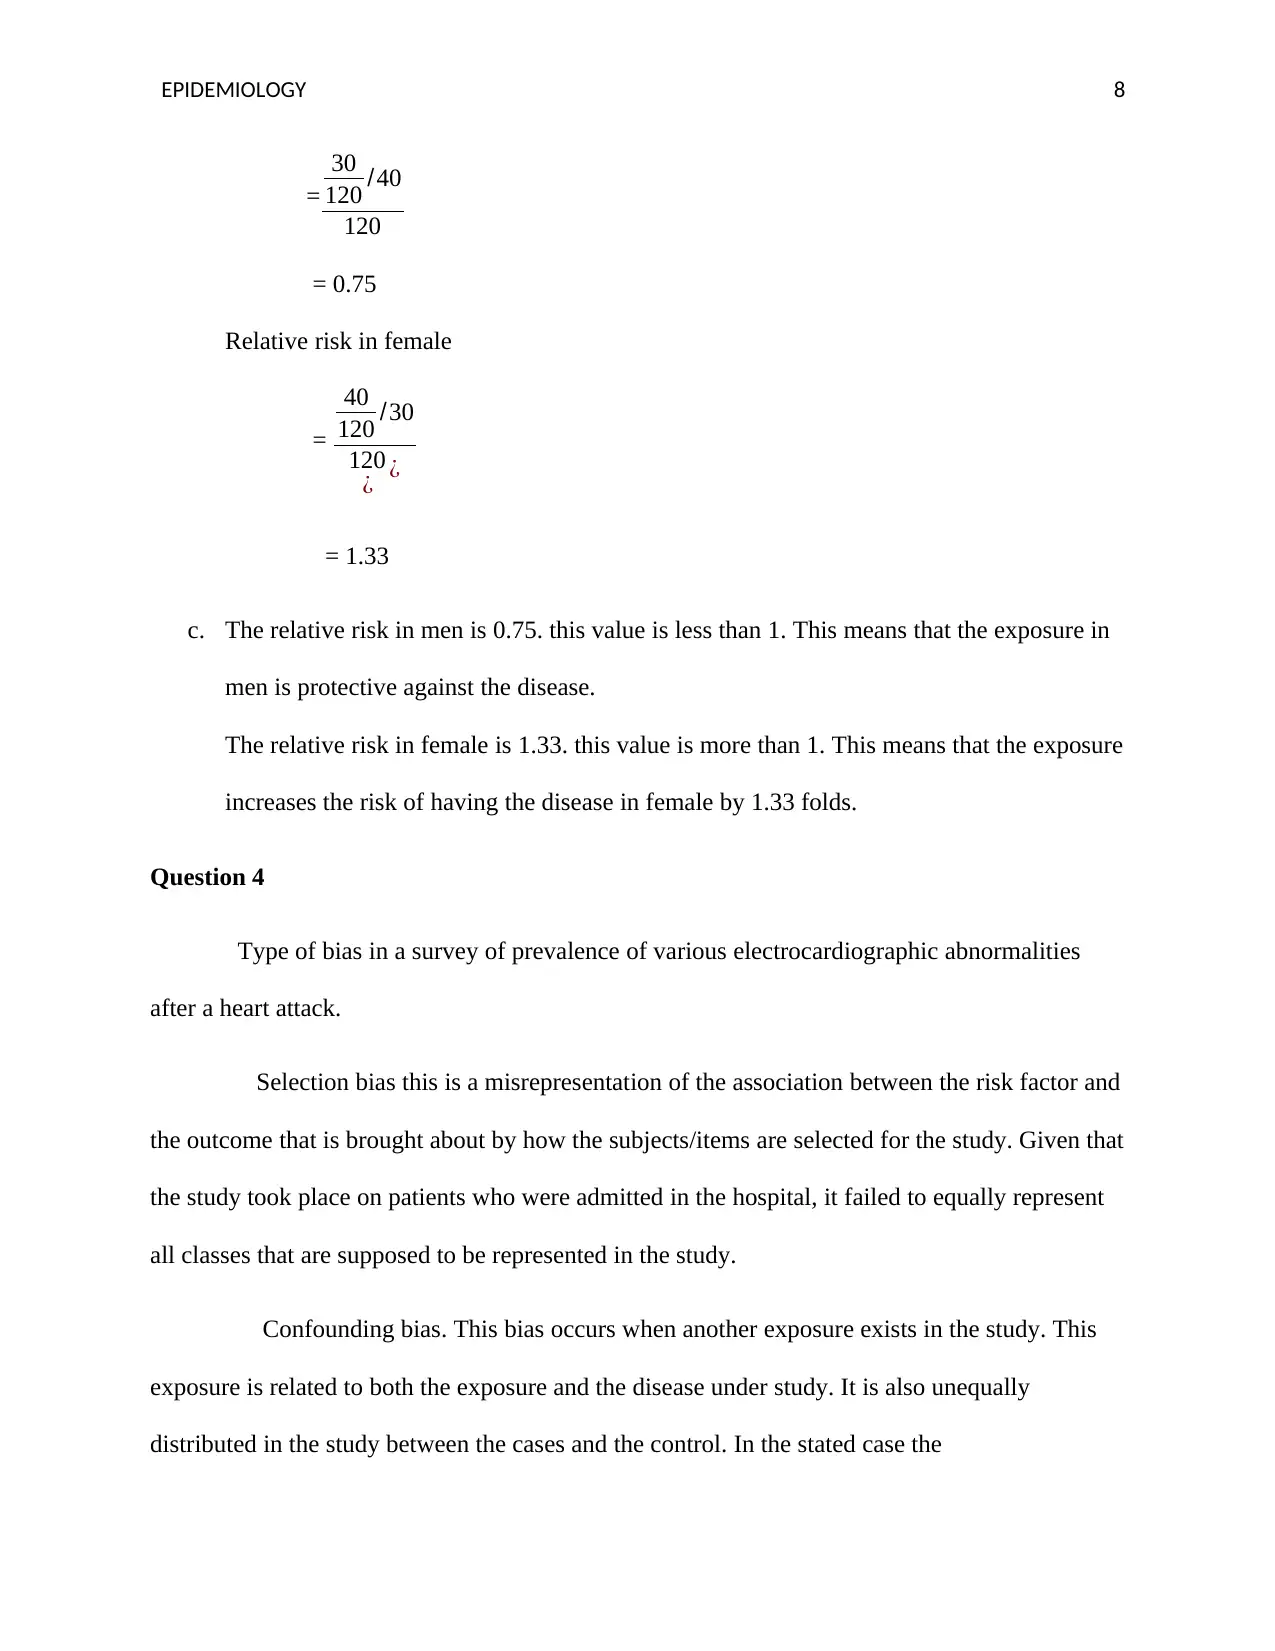
This epidemiology assignment delves into various critical areas within the field. It begins with an analysis of a prospective cohort study, detailing its advantages, the calculation of crude and quintile-specific incidence rates, and the assessment of relative risk. The assignment then explores prevalence calculations, odds ratios, and attributable risk, using a case study of child abuse and mental illness to illustrate these concepts. Further, the document calculates and interprets relative risk in the context of exposure and disease, differentiating between men and women. It also examines biases like selection, confounding, and diagnostic bias within the context of epidemiological studies, specifically in a survey of electrocardiographic abnormalities after a heart attack. The assignment concludes by addressing the impact of loss of participants on study validity. The student has provided comprehensive answers to all the questions.
Document Page
RUNNING HEADER: EPIDEMIOLOGY 1
EPIDEMIOLOGY
Student’s name
Institutional affiliation
tabler-icon-diamond-filled.svg

Secure Best Marks with AI Grader

Need help grading? Try our AI Grader for instant feedback on your assignments.
Document Page
EPIDEMIOLOGY 2
Epidemiology
Introduction
Epidemiology is the study of the distribution and the determinant of health events in a
population and its applications in solving health problems. This paper examines various area of
epidemiology. These areas include study designs, measures of association, research analysis, bias
and errors. These areas have been covered by means of answering given test questions.
Question 1.
a. The study is a prospective cohort study. The advantages of a prospective cohort study is
that it can be used to calculate incidence of the disease and the risk of developing the
outcome from the exposure. It is also suitable to study rare exposures. The study can also
be used to study an exposure with multiple outcome (Wang & Clayton, 2006).
b. Crude incidence rate is a of incidence that takes into account the time taken to observe
the subjects. It incorporates time into the denominator. The denominator is usually in
person-time units (Wang & Clayton, 2006)
Crude incidence rate =
number of new cases of the diseasea defined period of time
number of persontimeunit at risk during the defined period of time
= 1879
722419
= 0.0026
= 2.6 cases per 1000 person-year.
Document Page
EPIDEMIOLOGY 3
c. Quintile specific incidence rate = number of new cases of disease withthe quantile
number of persontimeunit
Quintile 1 = 392
144698
= 2.7 per 1000 person-year
Quintile 2 = 352
144403
= 2.4 per 1000 person-year
Quintile 3 = 368
144438
= 2.6 per 1000 person-year
Quintile 4 = 358
144471
= 2.5 per 1000 person-year
Quintile 5 ¿ 405
144409
= 2.8 per1000 person-year
Quintile crude relative risk
2 = 0.86 x 0.43
= 0.3698
3 = 0.85 x 0.83
= 0.7055
4 =0.77 x 1.31
Document Page
EPIDEMIOLOGY 4
= 1.00
5 = 0.84 x 2.70
= 2.268
No pattern of association can be can be observed from the unadjusted crude data.
d. The pattern of association in Table 2 Model 2 is a positive correlation. If a line of fit
was to be drawn it will have a positive slope (Webb & Bain, 2011)
e. The authors adjusted their analysis for alcohol, cigarette smoking, family history of
diabetes and physical activity because these factors are cofounders. If these cofounders
are not adjusted then they will affect and create a biased association. Some of these
factors vary greatly from quintile to quintile. An example is physical activity with a
baseline adjustment of 36, 41, 44, 47 and 50 across the quintiles respectively. The trend
also applies to cigarette smoking.
f. The main possible bias in this study is loss of follow up. Loss of follow up is a form of
selection bias. It is common in prospective cohort study. In this study loss of follow up
can be seen by the varying person-year values. This means some subjects left the study.
This bias might affect the credibility of the results as the subjects who left the study
might be different from the ones who remained.
tabler-icon-diamond-filled.svg

Secure Best Marks with AI Grader

Need help grading? Try our AI Grader for instant feedback on your assignments.
Document Page
EPIDEMIOLOGY 5
Question 2
a. Prevalence is the proportion in a defined population that has an outcome of interest at a
defined period of time (Dicker & Koo, 2006)
Prevalence = No. of exixting cases
total population at risk
Prevalence of child abuse in the control = 9/158
Prevalence of child abuse in the cases = 9/158 x 3.9
= 0.22215
No. of children abused in the cases = 0.22215 x 63
= 14
Mentally ill Not mentally ill Total
Abused 14 9 23
Not abused 49 149 198
Total 63 158 221
b. Odds ratio is the ratio of exposure in the diseased group divided by the ratio of the
exposure in the non-diseased group.
Odd ratio = exposurethe diseased
exposurethe non diseased
Document Page
EPIDEMIOLOGY 6
=
a
b /c
d
¿ ¿
=
14
59 /9
149
= 4.73
The odd ratio of exposure to child abuse and the risk of mental illness is 4.73. this means
that there is 4.73 more likelihood of someone developing mental illness if they were
abused as a child as compared to those who were not abused as children.
c. Factors that can bias the estimate obtained include confounders. These factors may
influence the both the cases and the controls and give a distortion in the estimates. The
confounders can include substance abuse among others.
Recall bias might also influence the estimate. This is because the exposure number was
retrieved from the past.
d. Attributable risk fraction is the proportion of the disease in the exposed group that is
attributed to the exposure. It is an estimate of how much of the disease is due to the factor
or exposure of interest (Olsen, Christensen &Murray, 2006).
Attributable fraction, AF= ¿!
¿
= 4.731
4.73
= 0.7886 x 100
= 78.86 %
The proportion of mental illness that is actually due to childhood abuse is 78.86%.
Document Page
EPIDEMIOLOGY 7
Question 3
a. The exposure has no association with the disease. This is concluded by calculating the
relative risk.
Relative risk is the ratio that shows the probability of developing an health outcome in an
exposed group (Webb & Bain, 2011). It is calculated by taking the incidence risk of
disease in the exposed group divided by the incidence risk of the disease in the non-
exposed group.
Relative risk, RR =
a
a+b /c
c+ d
=
60
240 /60
240
= 1
Relative risk of 1 means that the exposure has no effect on the disease. A relative risk of
less than 1 means that the exposure is protective against the disease while relative risk of
above 1 means that the exposure increases the risk of having the disease.
b. Relative risk
RR = a/(a+b)/c/(c+d)
Relative risk in men
tabler-icon-diamond-filled.svg

Paraphrase This Document

Need a fresh take? Get an instant paraphrase of this document with our AI Paraphraser
Document Page
EPIDEMIOLOGY 8
=
30
120 /40
120
= 0.75
Relative risk in female
=
40
120 /30
120
¿ ¿
= 1.33
c. The relative risk in men is 0.75. this value is less than 1. This means that the exposure in
men is protective against the disease.
The relative risk in female is 1.33. this value is more than 1. This means that the exposure
increases the risk of having the disease in female by 1.33 folds.
Question 4
Type of bias in a survey of prevalence of various electrocardiographic abnormalities
after a heart attack.
Selection bias this is a misrepresentation of the association between the risk factor and
the outcome that is brought about by how the subjects/items are selected for the study. Given that
the study took place on patients who were admitted in the hospital, it failed to equally represent
all classes that are supposed to be represented in the study.
Confounding bias. This bias occurs when another exposure exists in the study. This
exposure is related to both the exposure and the disease under study. It is also unequally
distributed in the study between the cases and the control. In the stated case the
Document Page
EPIDEMIOLOGY 9
electrocardiographic abnormality might have been cause by other health issue in addition to the
heart attack.
Restriction. The subject that were chosen for this study were limited to the hospital.
This will make generalizability of the study to the general population hard as they were only
limited to the hospital.
Diagnostic bias. Based on the researcher’s knowledge some subjects with no
electrocardiographic abnormalities may have been counted so just because they had a heart
attack.
Question 5.
Loss of participants represent a form of bias. It is known as loss of follow up bias or migration
bias. It is a bias because those who withdraw may be different from those who remained in the
study. If the loss occurs in large scale it might affect the validity of the conclusion. It might also
reduce the sample size.
Conclusion
Measures of associations include risk ratio, odds ratio and attributable risk among
others. Adjusted incidence rates are vitals in order to obtain correct associations without the
influence of confounders. Some of the biases that affect results of research include selection bias,
measurement bias and confounding factors.
Document Page
EPIDEMIOLOGY
10
References
Dicker, R., Coronado, F., & Koo, D. (2006). Principles of Epidemiology in Public Health
Practice: An introduction to applied epidemiology and biostatistics. Waldorf: PHF
Olsen, J., Christensen, K., Murray, J., & Ekbom, A. (2010). An Introduction to Epidemiology for
Health Professionals. New York: Springer
Wang, D., Clayton, T., & Bakhai, A. (2006). A practical guide to design, analysis and
reporting. London: Remedica
Webb, P., & Bain, C. (2011). Essential epidemiology. An Introduction for Students and Health
Professionals. Cambridge:University press
chevron_up_icon
1 out of 10
circle_padding
hide_on_mobile
zoom_out_icon
logo.png

Your All-in-One AI-Powered Toolkit for Academic Success.

Available 24*7 on WhatsApp / Email

[object Object]