Epidemiology Assignment: Public Health Case Studies and Analysis

Verified

Added on  2022/09/13

|9
|1572
|11
Homework Assignment
AI Summary
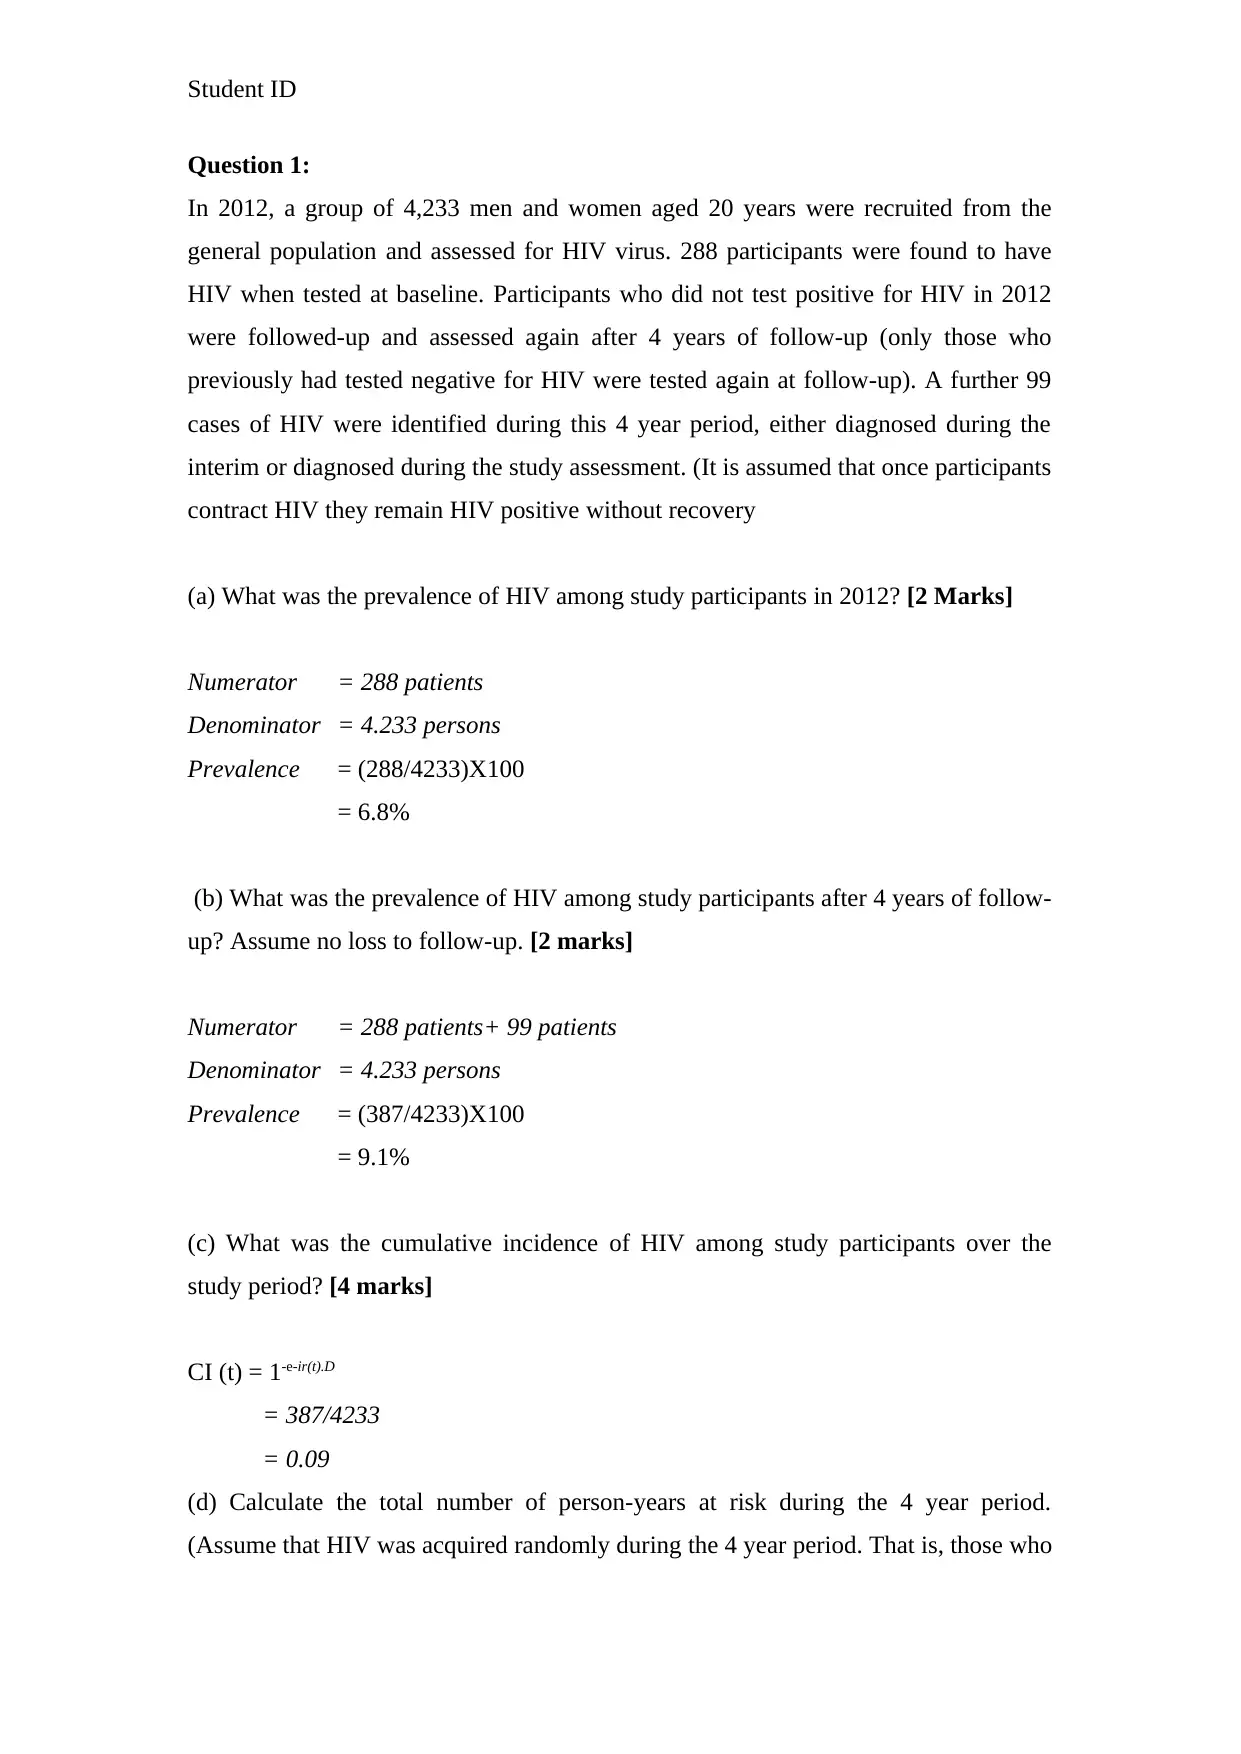
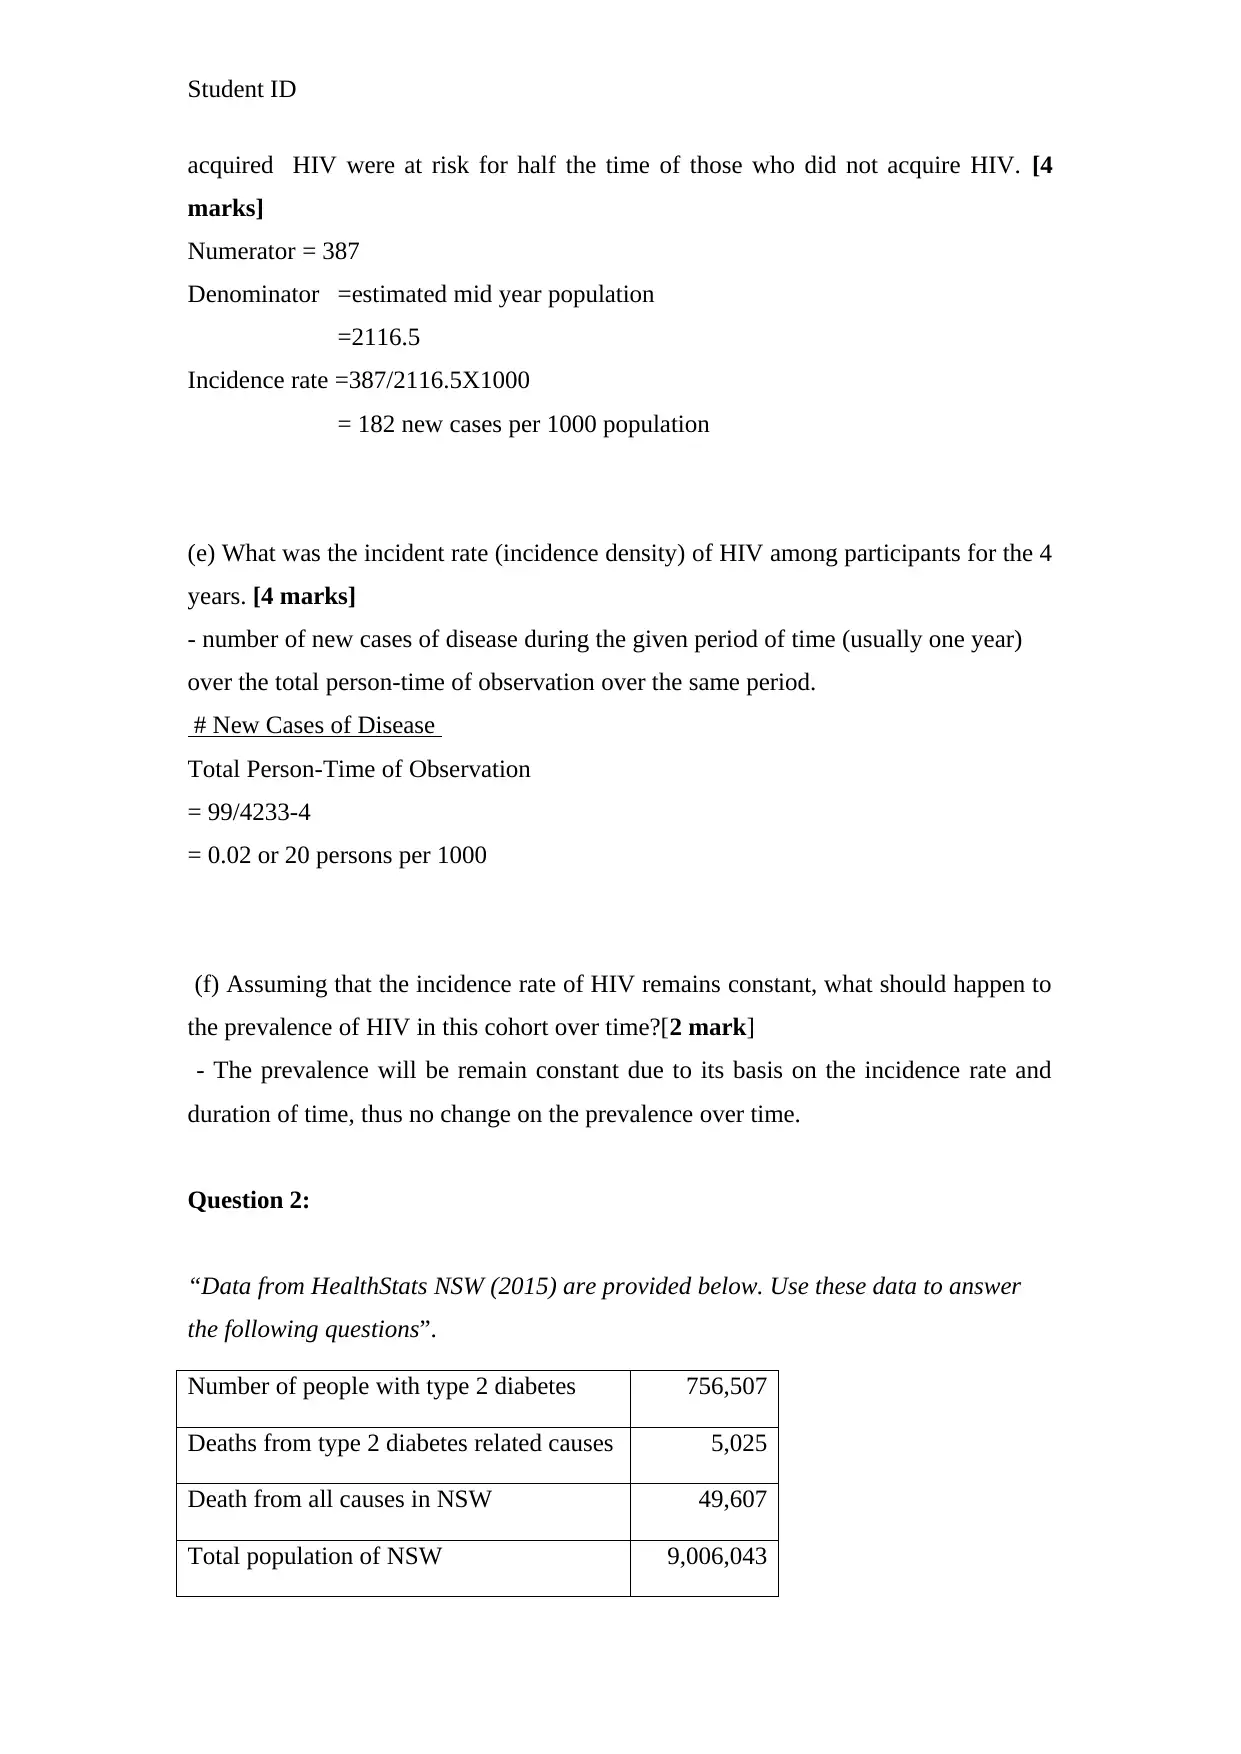
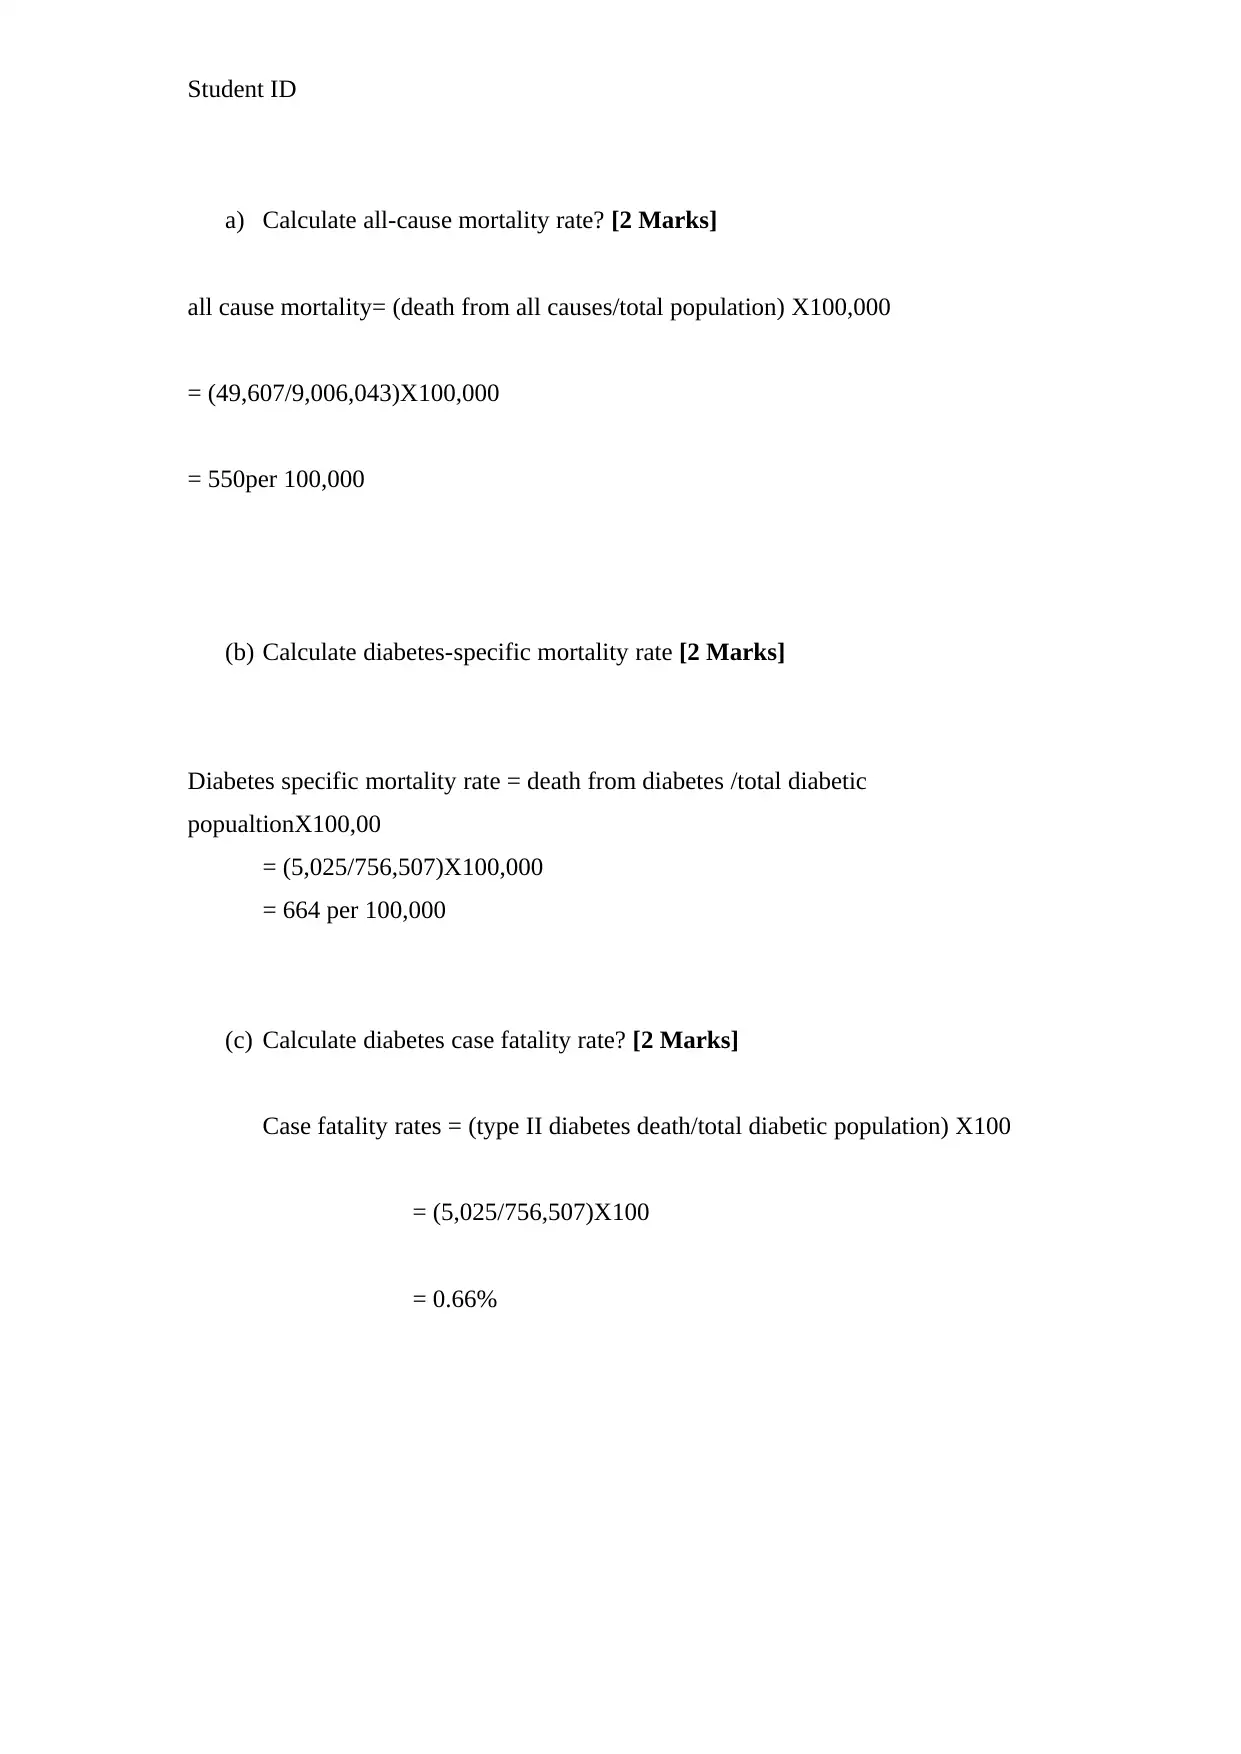
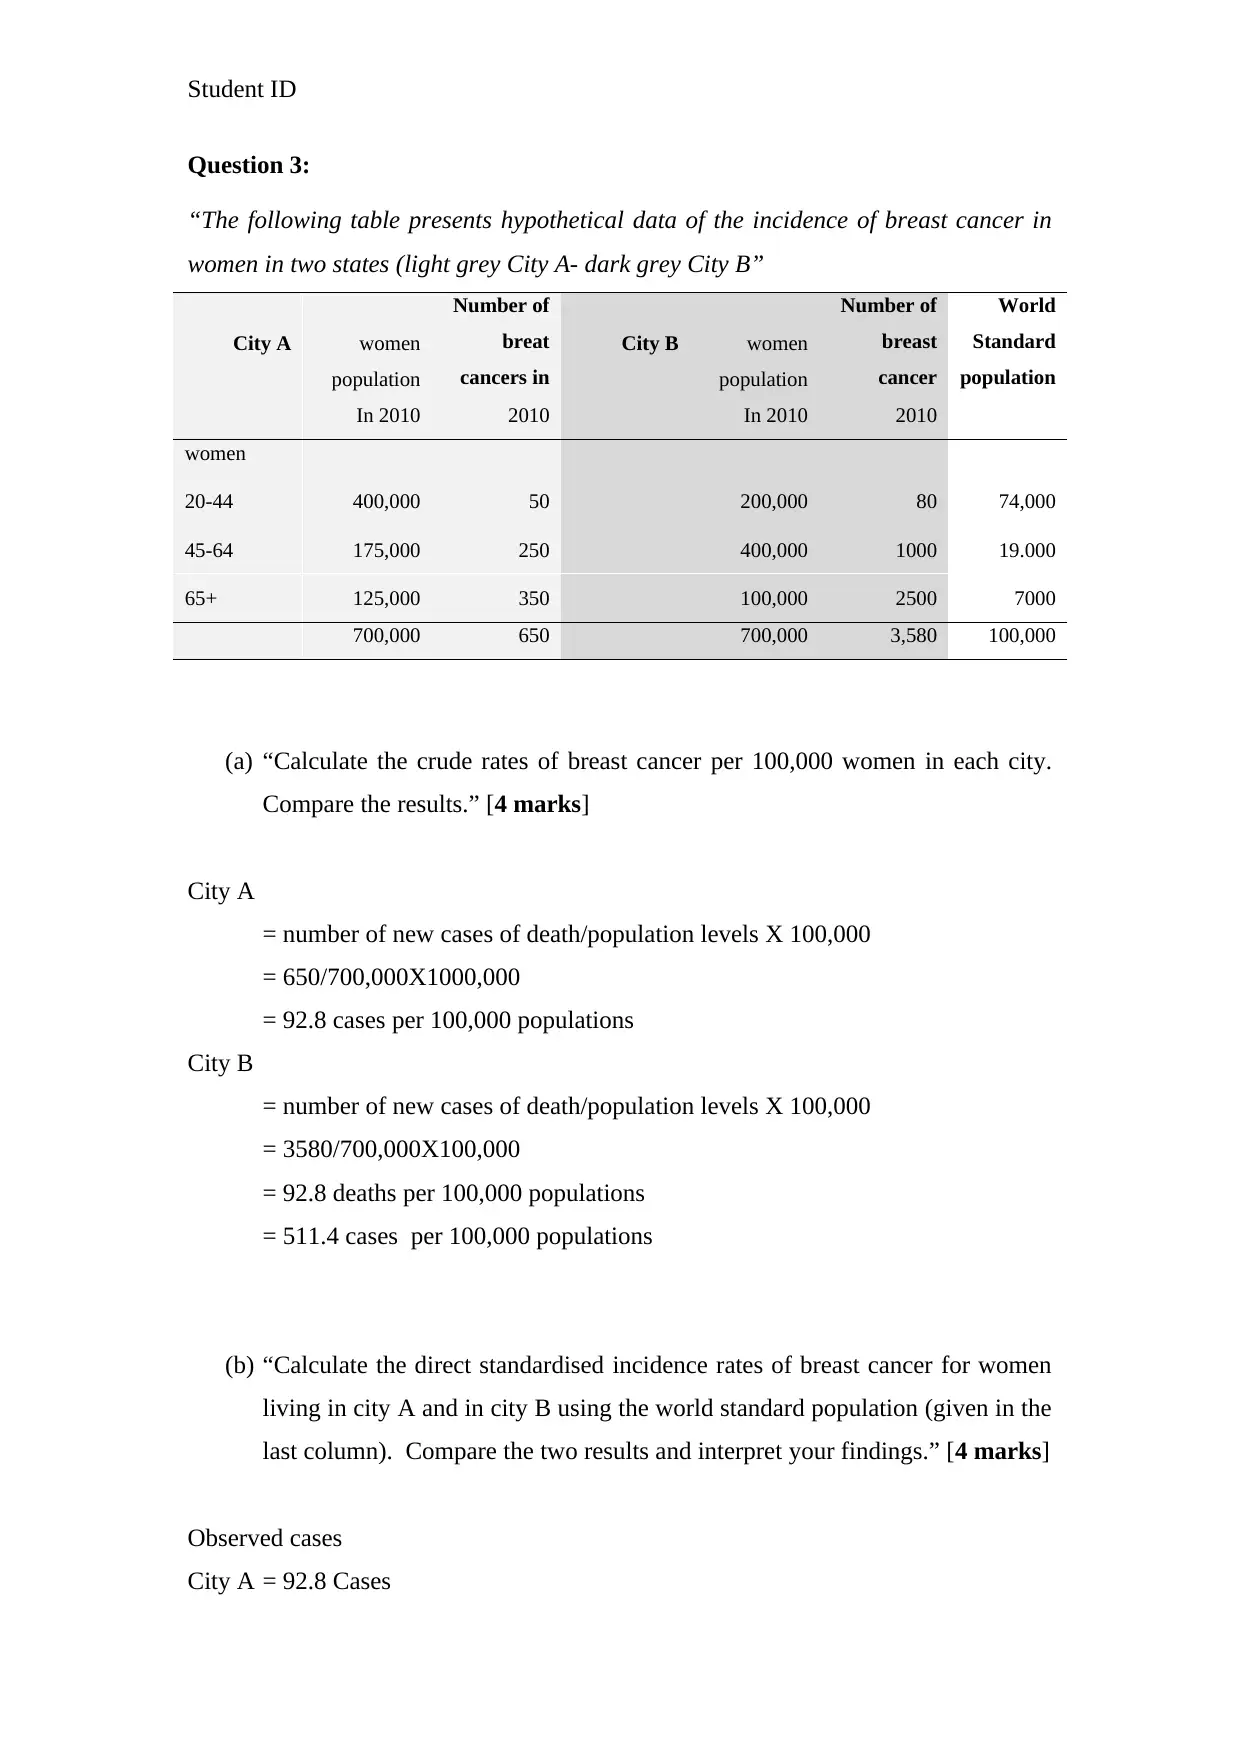
This epidemiology assignment presents a comprehensive analysis of public health data, focusing on HIV and breast cancer. The assignment begins with a case study on HIV, calculating prevalence, cumulative incidence, and incidence rate based on a cohort study. It then moves on to analyze data from HealthStats NSW, calculating all-cause mortality, diabetes-specific mortality, and case fatality rates. The assignment further delves into breast cancer incidence in two cities, calculating crude and standardized incidence rates and discussing the impact of age structure. Finally, it explores study designs, proposing a case-control study to investigate the association between delayed age of first child and breast cancer incidence, and discussing participant details, data collection, and alternative study designs like cross-sectional studies. The assignment demonstrates an understanding of epidemiological concepts and their application in public health scenarios, with appropriate referencing.
Document Page
Student ID
Epidemiology
University
Name
tabler-icon-diamond-filled.svg

Secure Best Marks with AI Grader

Need help grading? Try our AI Grader for instant feedback on your assignments.
Document Page
Student ID
Question 1:
In 2012, a group of 4,233 men and women aged 20 years were recruited from the
general population and assessed for HIV virus. 288 participants were found to have
HIV when tested at baseline. Participants who did not test positive for HIV in 2012
were followed-up and assessed again after 4 years of follow-up (only those who
previously had tested negative for HIV were tested again at follow-up). A further 99
cases of HIV were identified during this 4 year period, either diagnosed during the
interim or diagnosed during the study assessment. (It is assumed that once participants
contract HIV they remain HIV positive without recovery
(a) What was the prevalence of HIV among study participants in 2012? [2 Marks]
Numerator = 288 patients
Denominator = 4.233 persons
Prevalence = (288/4233)X100
= 6.8%
(b) What was the prevalence of HIV among study participants after 4 years of follow-
up? Assume no loss to follow-up. [2 marks]
Numerator = 288 patients+ 99 patients
Denominator = 4.233 persons
Prevalence = (387/4233)X100
= 9.1%
(c) What was the cumulative incidence of HIV among study participants over the
study period? [4 marks]
CI (t) = 1-e-ir(t).D
= 387/4233
= 0.09
(d) Calculate the total number of person-years at risk during the 4 year period.
(Assume that HIV was acquired randomly during the 4 year period. That is, those who
Document Page
Student ID
acquired HIV were at risk for half the time of those who did not acquire HIV. [4
marks]
Numerator = 387
Denominator =estimated mid year population
=2116.5
Incidence rate =387/2116.5X1000
= 182 new cases per 1000 population
(e) What was the incident rate (incidence density) of HIV among participants for the 4
years. [4 marks]
- number of new cases of disease during the given period of time (usually one year)
over the total person-time of observation over the same period.
# New Cases of Disease
Total Person-Time of Observation
= 99/4233-4
= 0.02 or 20 persons per 1000
(f) Assuming that the incidence rate of HIV remains constant, what should happen to
the prevalence of HIV in this cohort over time?[2 mark]
- The prevalence will be remain constant due to its basis on the incidence rate and
duration of time, thus no change on the prevalence over time.
Question 2:
“Data from HealthStats NSW (2015) are provided below. Use these data to answer
the following questions”.
Number of people with type 2 diabetes 756,507
Deaths from type 2 diabetes related causes 5,025
Death from all causes in NSW 49,607
Total population of NSW 9,006,043
Document Page
Student ID
a) Calculate all-cause mortality rate? [2 Marks]
all cause mortality= (death from all causes/total population) X100,000
= (49,607/9,006,043)X100,000
= 550per 100,000
(b) Calculate diabetes-specific mortality rate [2 Marks]
Diabetes specific mortality rate = death from diabetes /total diabetic
popualtionX100,00
= (5,025/756,507)X100,000
= 664 per 100,000
(c) Calculate diabetes case fatality rate? [2 Marks]
Case fatality rates = (type II diabetes death/total diabetic population) X100
= (5,025/756,507)X100
= 0.66%
tabler-icon-diamond-filled.svg

Secure Best Marks with AI Grader

Need help grading? Try our AI Grader for instant feedback on your assignments.
Document Page
Student ID
Question 3:
“The following table presents hypothetical data of the incidence of breast cancer in
women in two states (light grey City A- dark grey City B”
City A women
population
Number of
breat
cancers in
City B women
population
Number of
breast
cancer
World
Standard
population
In 2010 2010 In 2010 2010
women
20-44 400,000 50 200,000 80 74,000
45-64 175,000 250 400,000 1000 19.000
65+ 125,000 350 100,000 2500 7000
700,000 650 700,000 3,580 100,000
(a) “Calculate the crude rates of breast cancer per 100,000 women in each city.
Compare the results.” [4 marks]
City A
= number of new cases of death/population levels X 100,000
= 650/700,000X1000,000
= 92.8 cases per 100,000 populations
City B
= number of new cases of death/population levels X 100,000
= 3580/700,000X100,000
= 92.8 deaths per 100,000 populations
= 511.4 cases per 100,000 populations
(b) “Calculate the direct standardised incidence rates of breast cancer for women
living in city A and in city B using the world standard population (given in the
last column). Compare the two results and interpret your findings.” [4 marks]
Observed cases
City A = 92.8 Cases
Document Page
Student ID
City B =511.4 cases
Expected cases
City A
= number of new cases of death/population levels X 100,000
= 650/100,000X1000,000
= 650 cases per 100,000 populations
City B
= number of new cases of death/population levels X 100,000
= 3580/100,000X100,000
= 3580 cases per 100,000 populations
City A
SIR= 92.8/650
= 0.14
City B
SIR =511/3580
= 0.14
The two results shows that there is an observed decreased of 14%. There is no
statistical difference between the two cities
(c) “Based on the data you have just calculated would you say that age structure can
explain the differences between the two cities in crude breast cancer? Justify”
[4marks]
Document Page
Student ID
- Based on no difference on standardized incidence rate, age could play a role in
the crude breast rate in the two cities. Age could a factor as a confounding
factor affecting the overall crude breast cancer rate for the two populations.
Question 4:
(a) What is the study type that generated this figure? [2 marks]
- Correlation study (Cross sectional study)
(b) What are the key features that led you to this choice? [2 marks]
- The key features entail assessment and correlation of the per capita sugar
intake and age adjusted mortality of cancer deaths.
- What is the main message from this graph, in your own words? [2 Marks]
Sugar intake of between 300-400 calories per day is linked to increased
mortality rates of prostate cancer, signifying a correlation between high intake
and mortality, while majority of the population are consuming an average of
300-40 calories of sugar per day.
Source: Colli et al. Urologic Oncology 2005
tabler-icon-diamond-filled.svg

Paraphrase This Document

Need a fresh take? Get an instant paraphrase of this document with our AI Paraphraser
Document Page
Student ID
Question 5:
“Investigators wishes to examine if delaying the age of having first child is
associated with higher incidence of breast cancer in young women 18-40 years
old.”
a) Propose an epidemiological study design to explore this question and justify
why you chose this design? [4 Marks]
- Case control study (Friis & Sellers, 2020). In this study design, persons with
certain outcomes such as these with breast cancer and have a child and control
for those who do not have a child are observed over time to assess any
correlation on breast cancer incidences.
b) Assuming you are one of the investigators – please provide a short description
about the participants in the study, what data you will need to collect to
answer your research question and at which time point you collect this data
[4 Marks]
- The participants in this study will comprise women of ages 18-40 years who
do not have any history of cancer. Two groups will be developed. One with
onset program of having children while the other those who are willing to
delay the onset of first child in a progressive manner, let’s say 3 years, 5 years
and 6 years. This will be obtained by interviewing and grouping the
participants and putting them in groups for follow up and assessment. Data
collected will be baseline information, onset of cancer, prevalence of cancer in
the various onset an inception of child bearing and incidence levels.
c) What other study design you can consider for this research question and
explain why you chose it [4 Marks]
- Cross sectional study (Fletcher, 2019). It is essential as it examines the
relationship between onset and occurrence of cancer and child bearing as they
exist among women aged between 18-40 years. It is a crucial in quantifying
disease prevalence and risks factors in this case making it good for
consideration.
Document Page
Student ID
References
Colli, J. L., & Colli, A. (2006). International comparisons of prostate cancer mortality
rates with dietary practices and sunlight levels. Urologic oncology, 24(3), 184–
194. https://doi.org/10.1016/j.urolonc.2005.05.023
Fletcher, G. S. (2019). Clinical epidemiology: the essentials. Lippincott Williams &
Wilkins.
Friis, R. H., & Sellers, T. (2020). Epidemiology for public health practice. Jones &
Bartlett Learning.
chevron_up_icon
1 out of 9
circle_padding
hide_on_mobile
zoom_out_icon
logo.png

Your All-in-One AI-Powered Toolkit for Academic Success.

Available 24*7 on WhatsApp / Email

[object Object]