Epidemiology Assignment: Analyzing Disease Occurrence and Mortality

Verified

Added on  2023/04/25

|8
|1688
|214
Homework Assignment
AI Summary
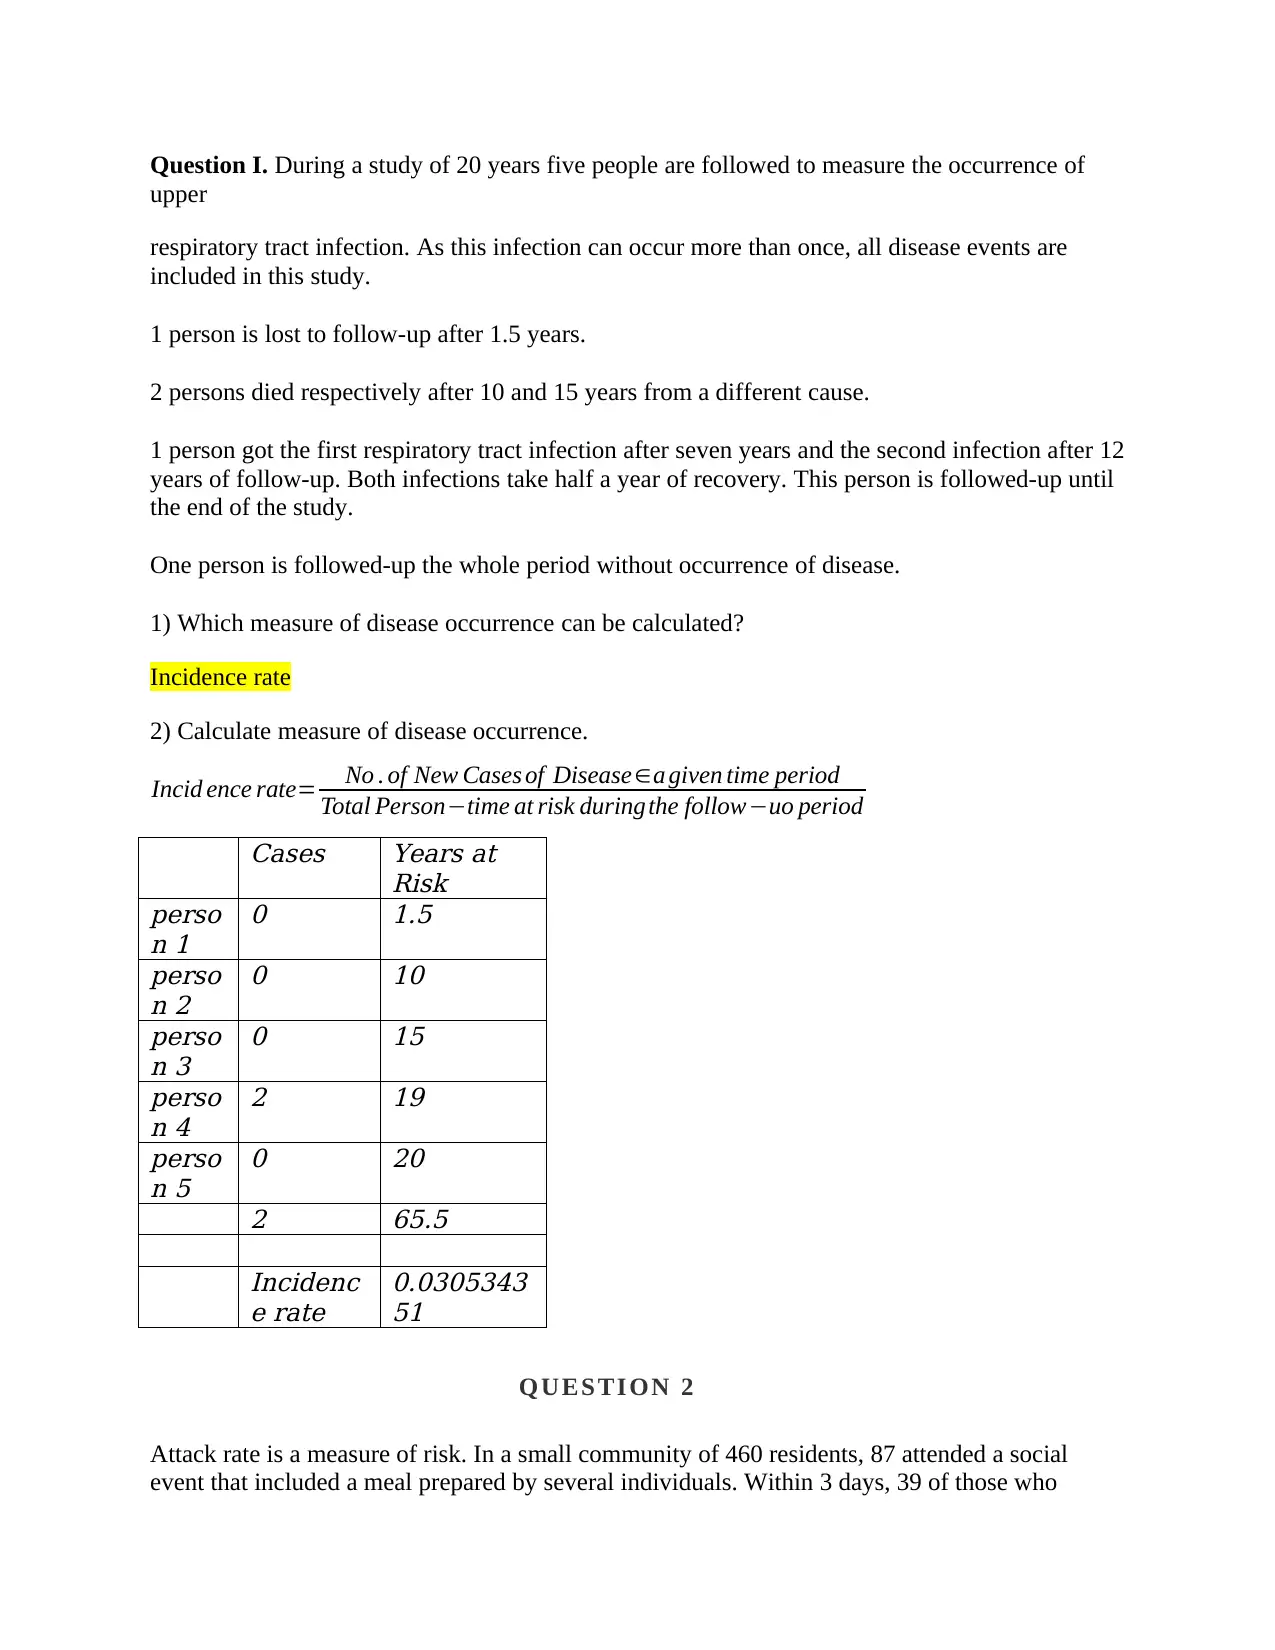
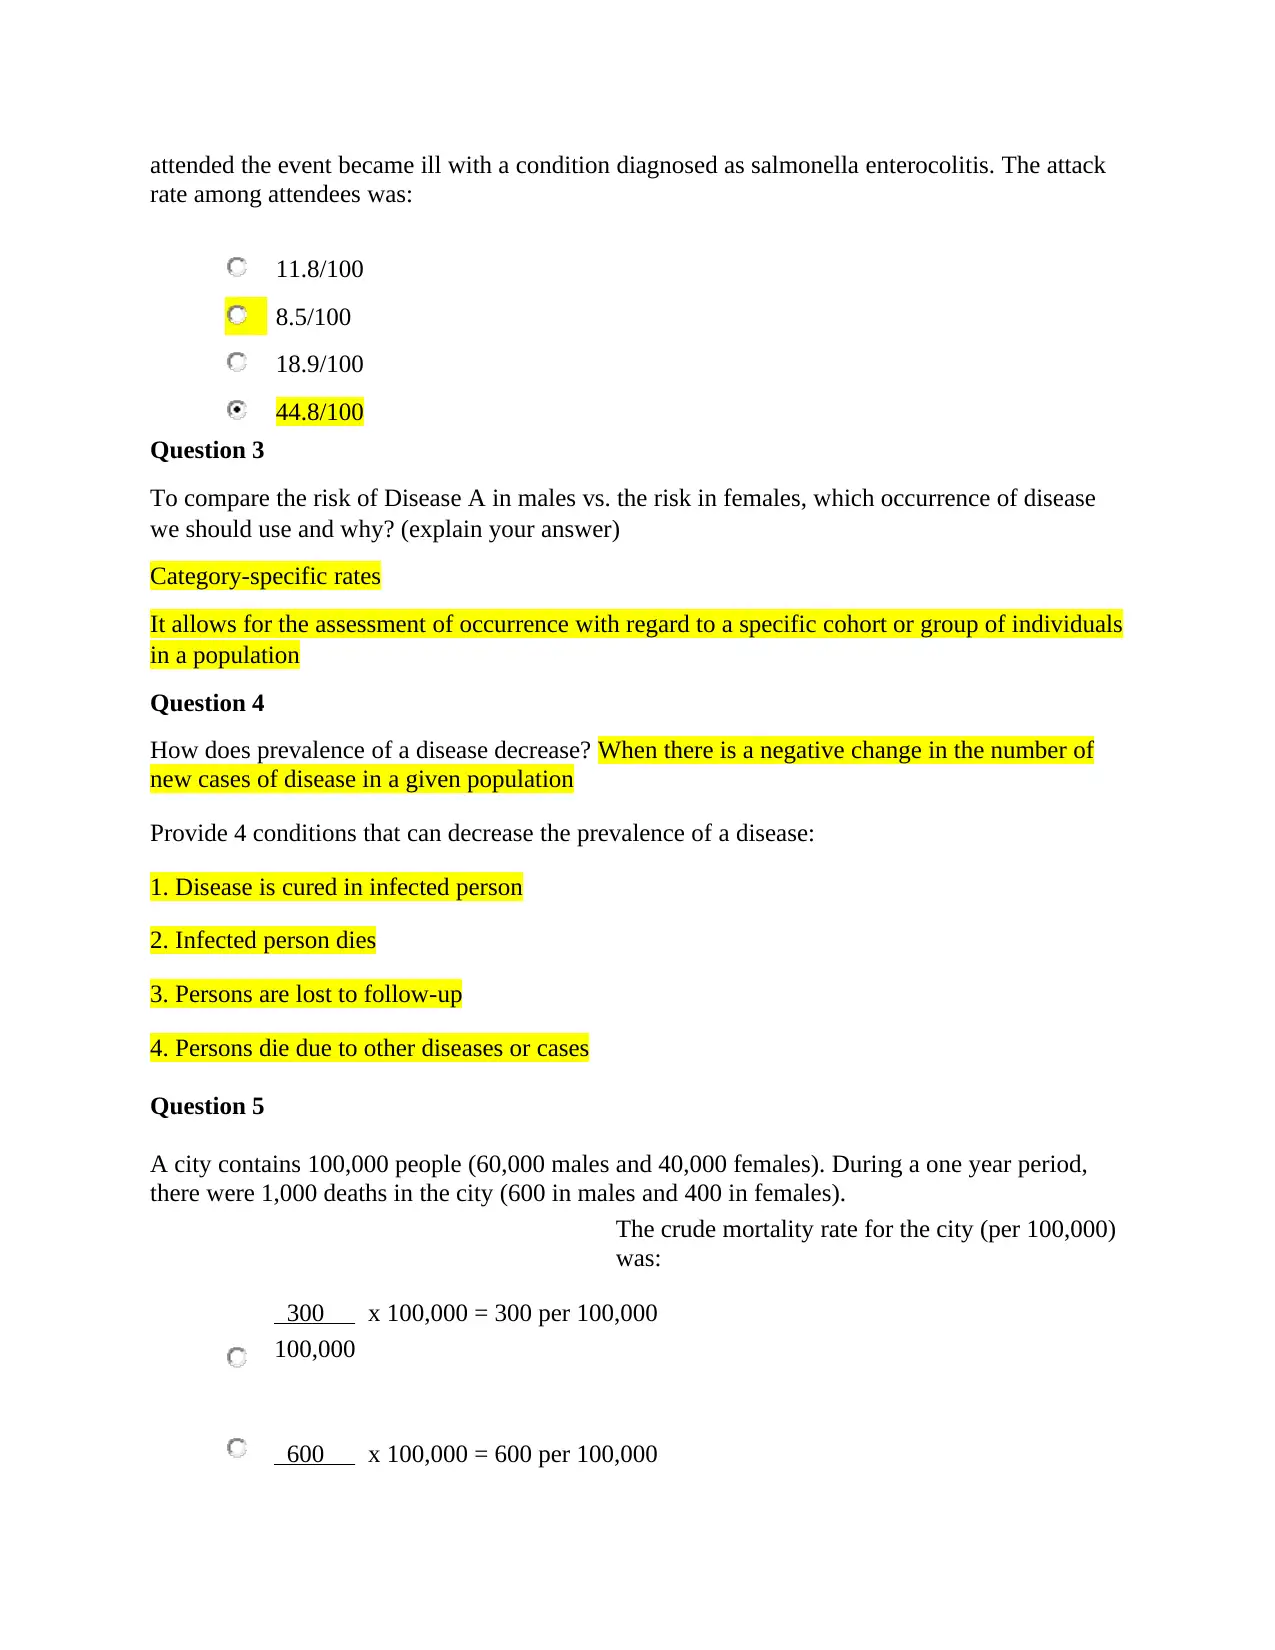
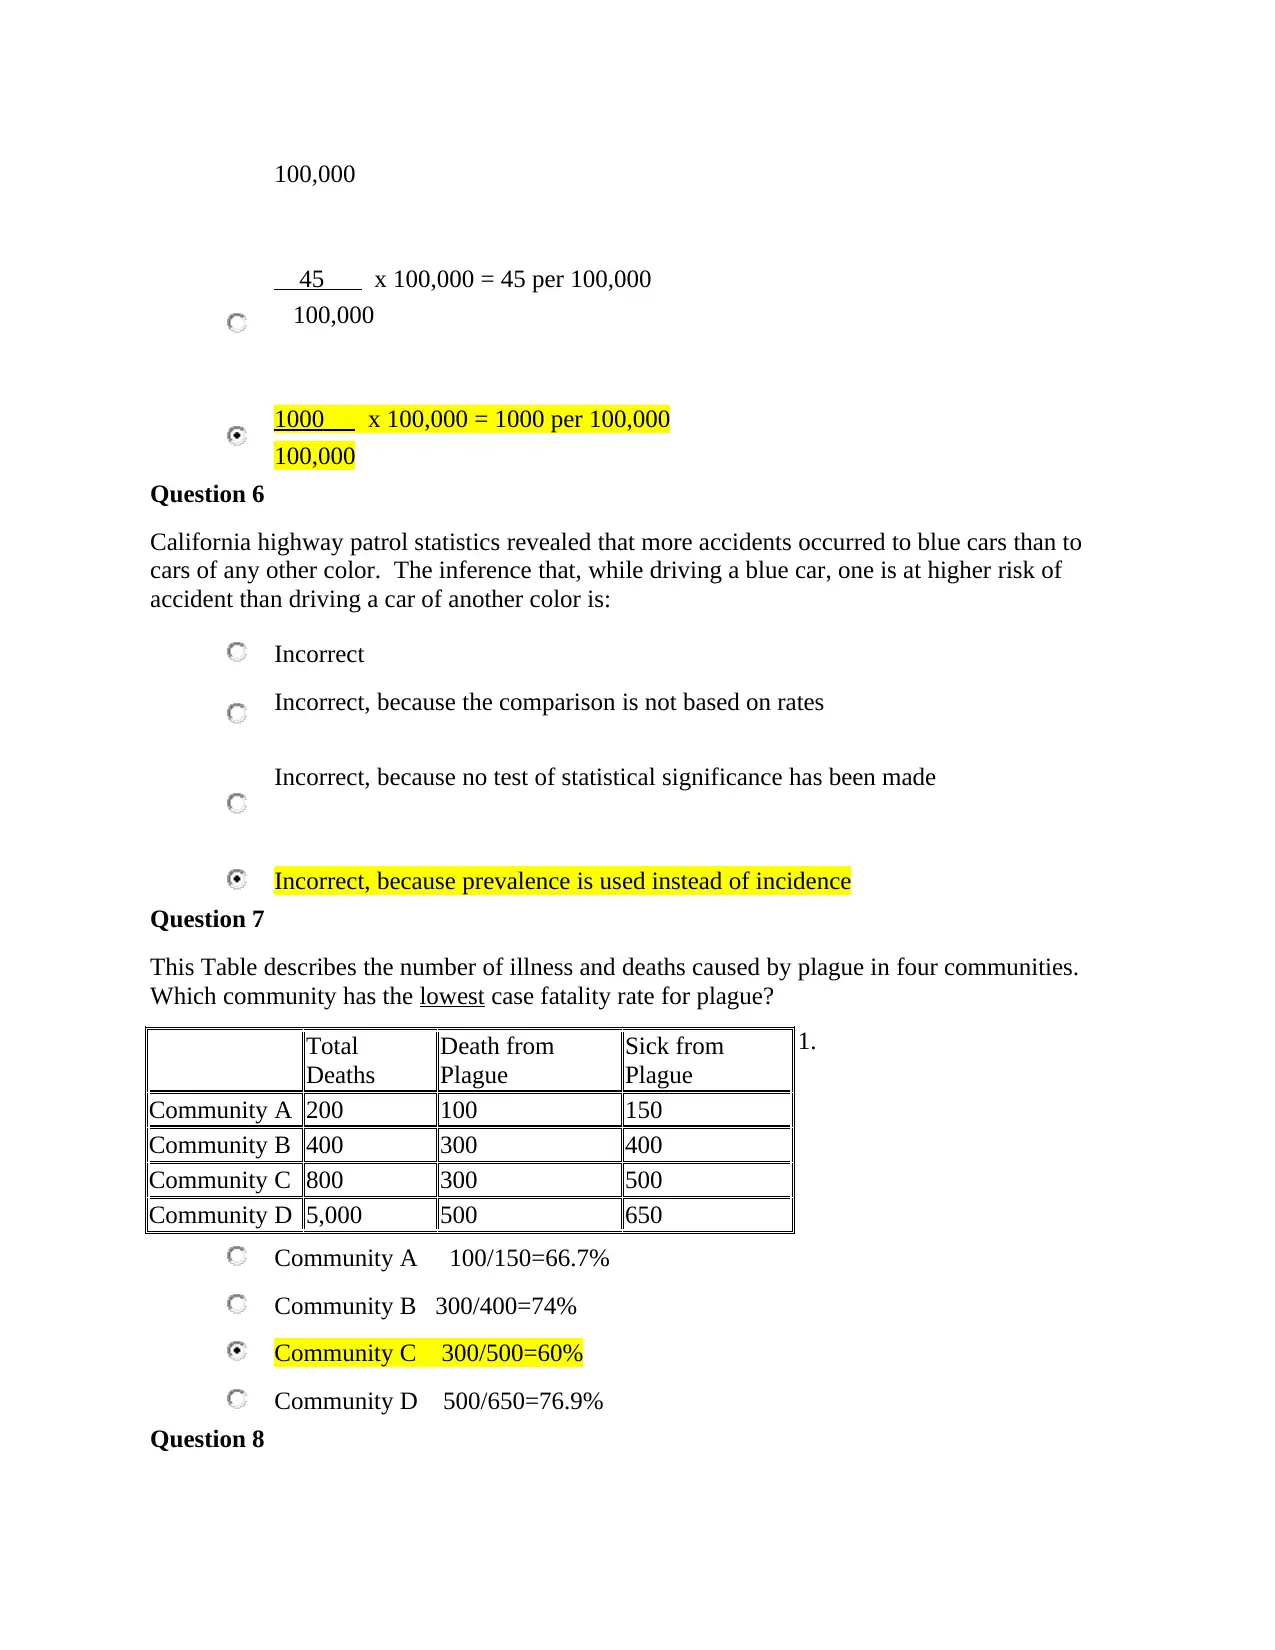
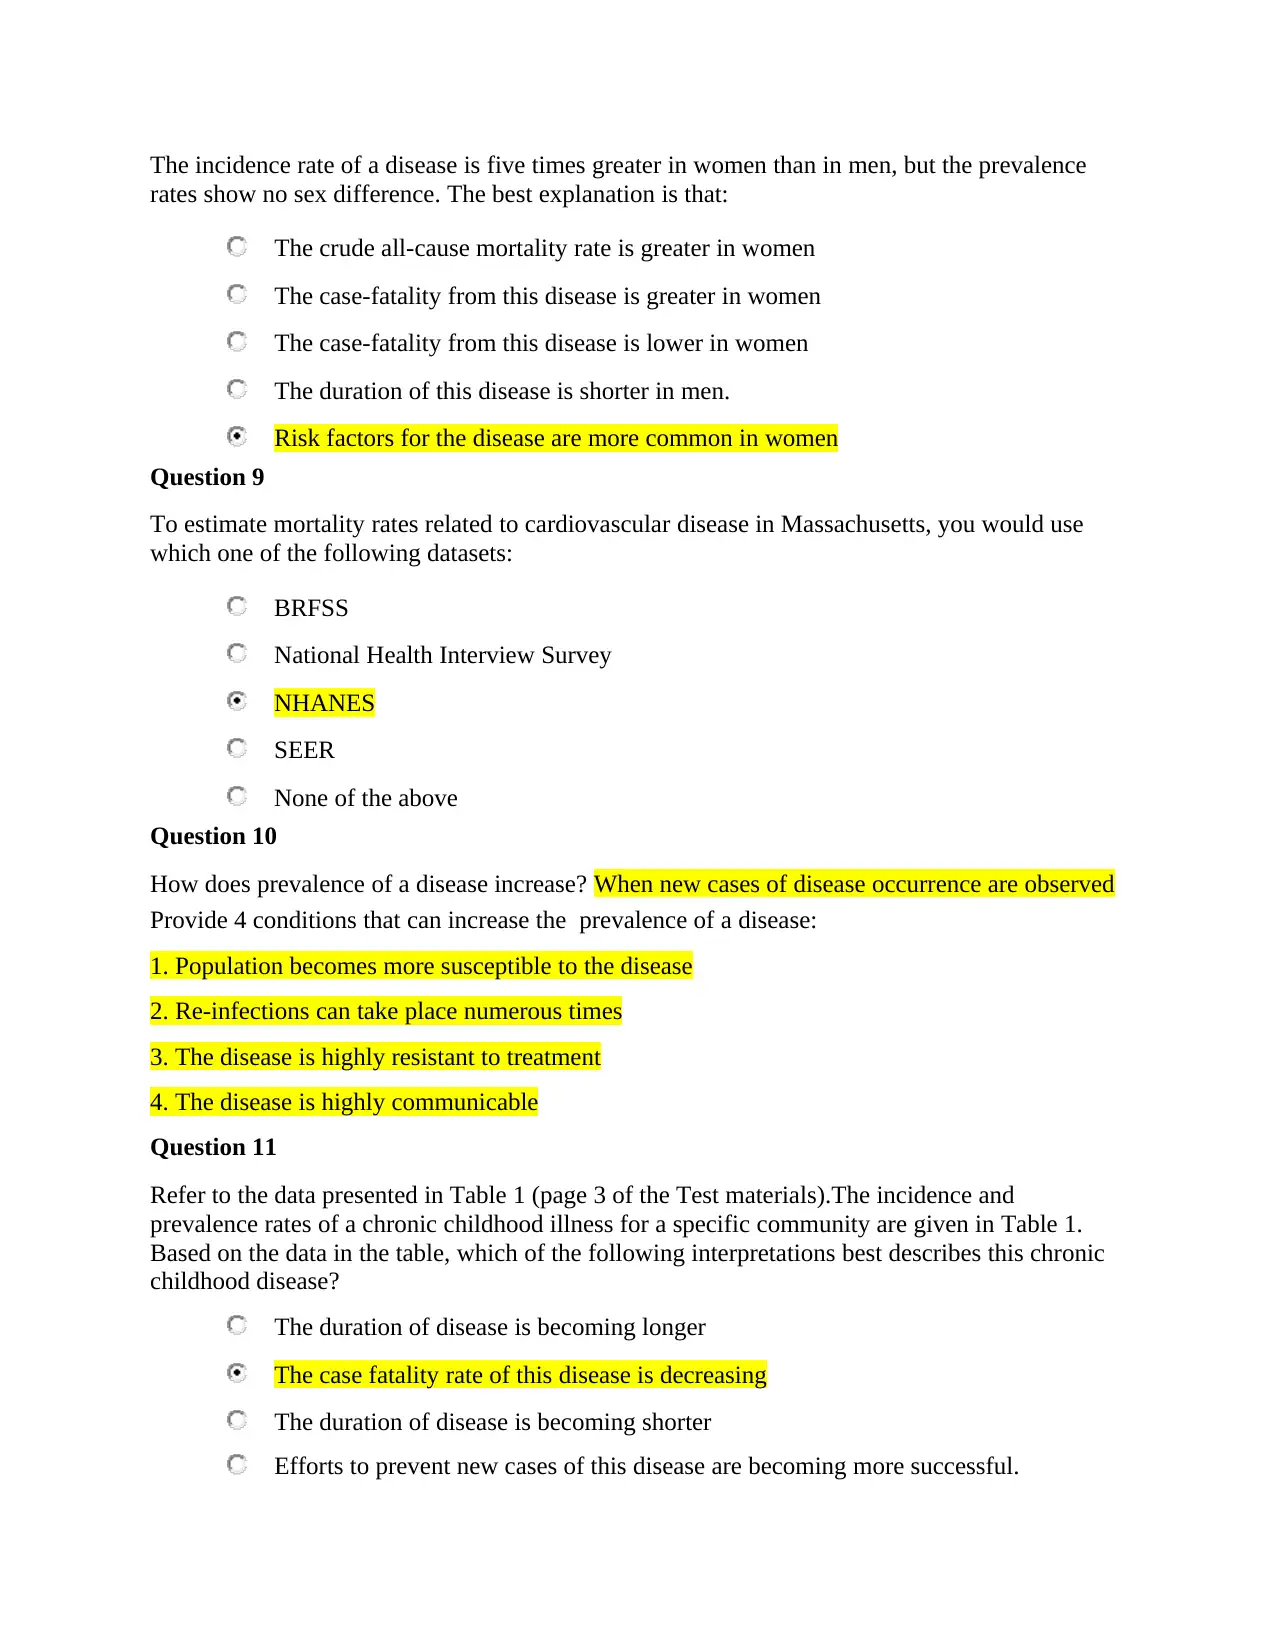
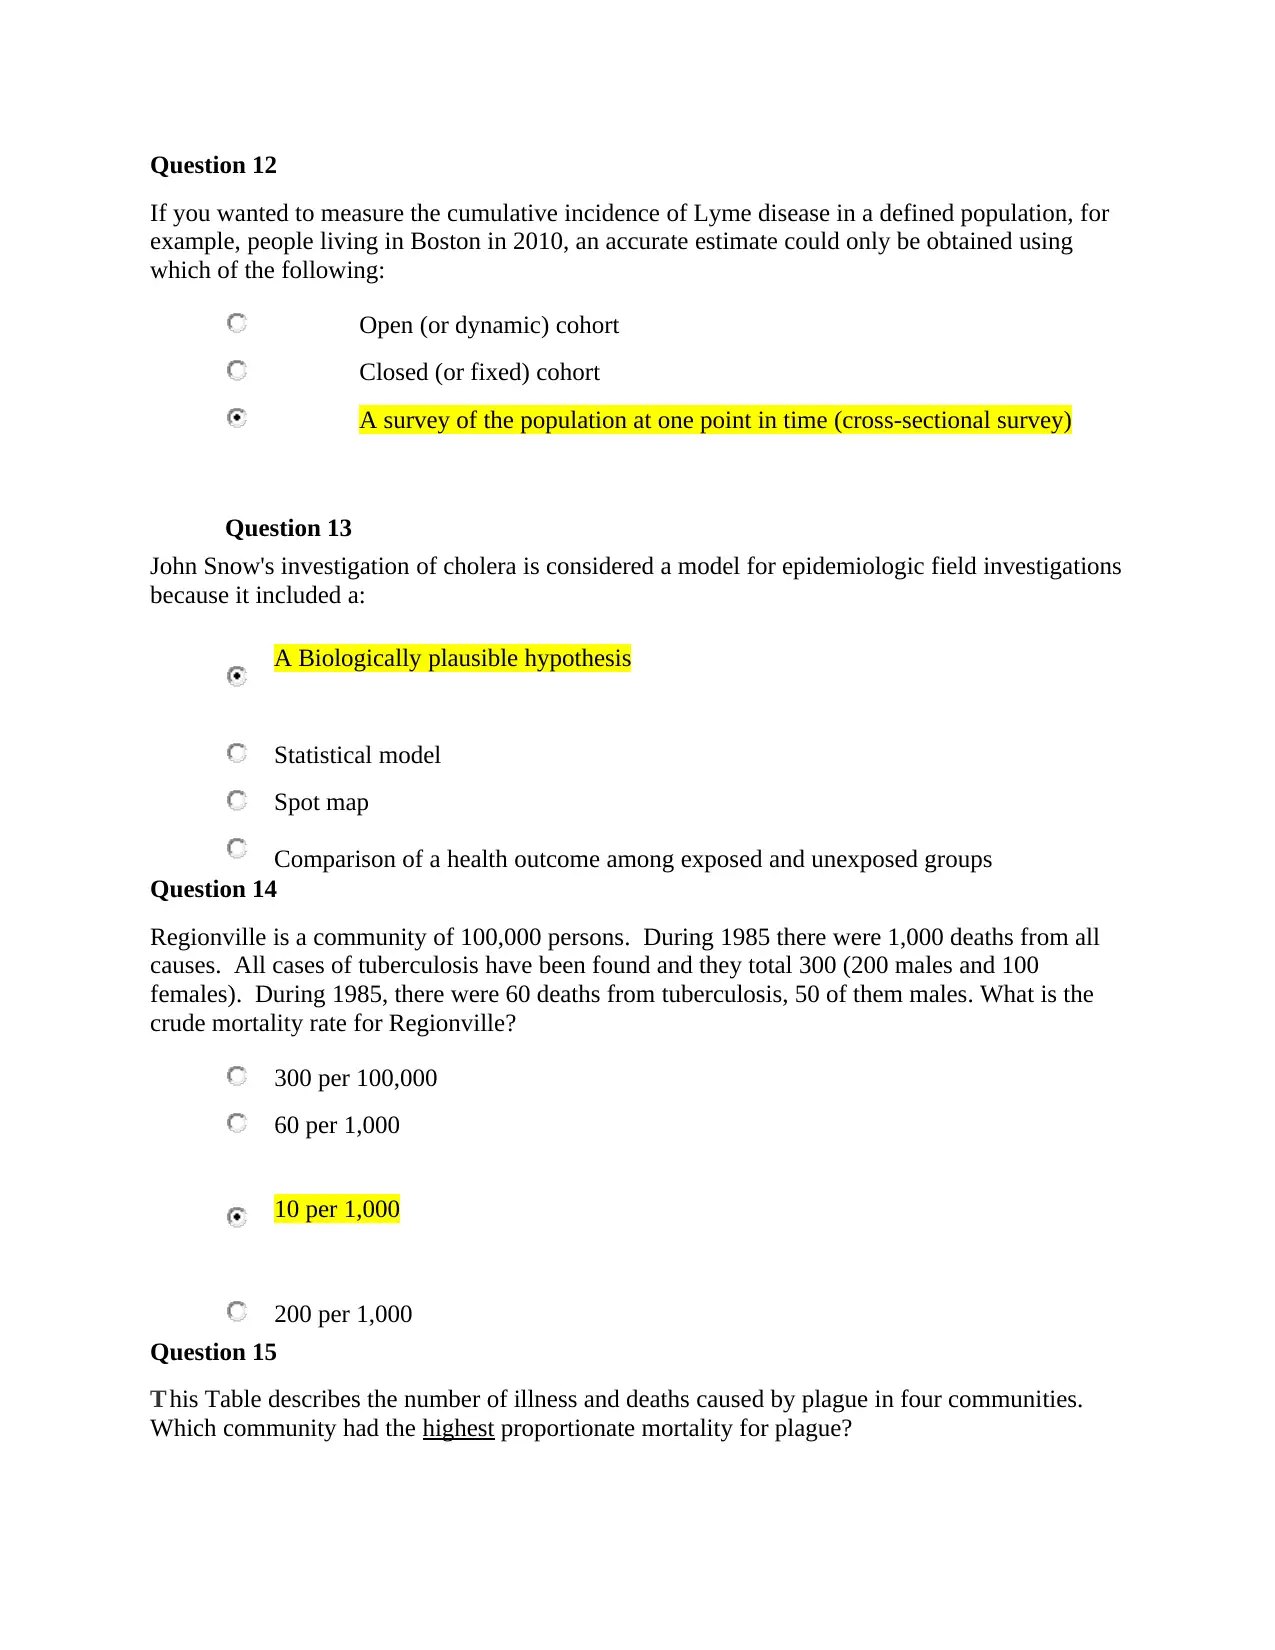
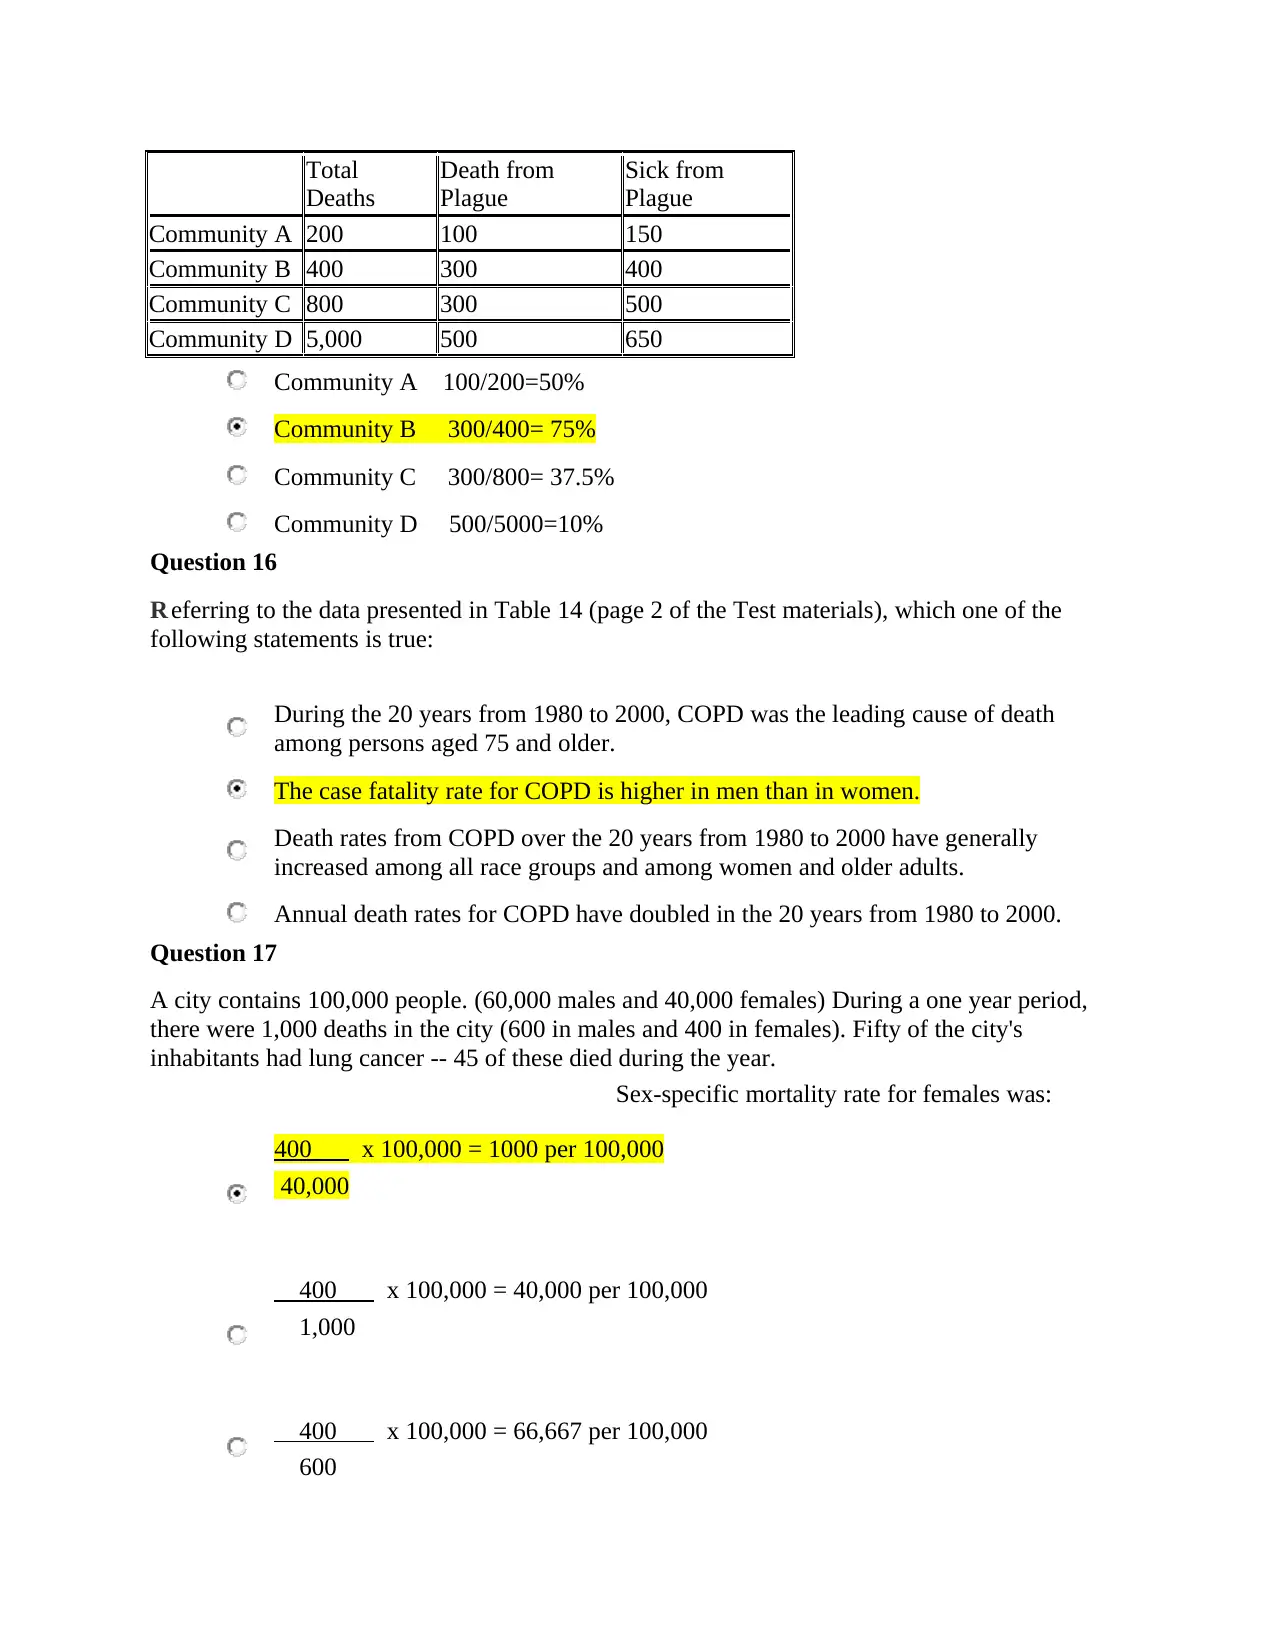
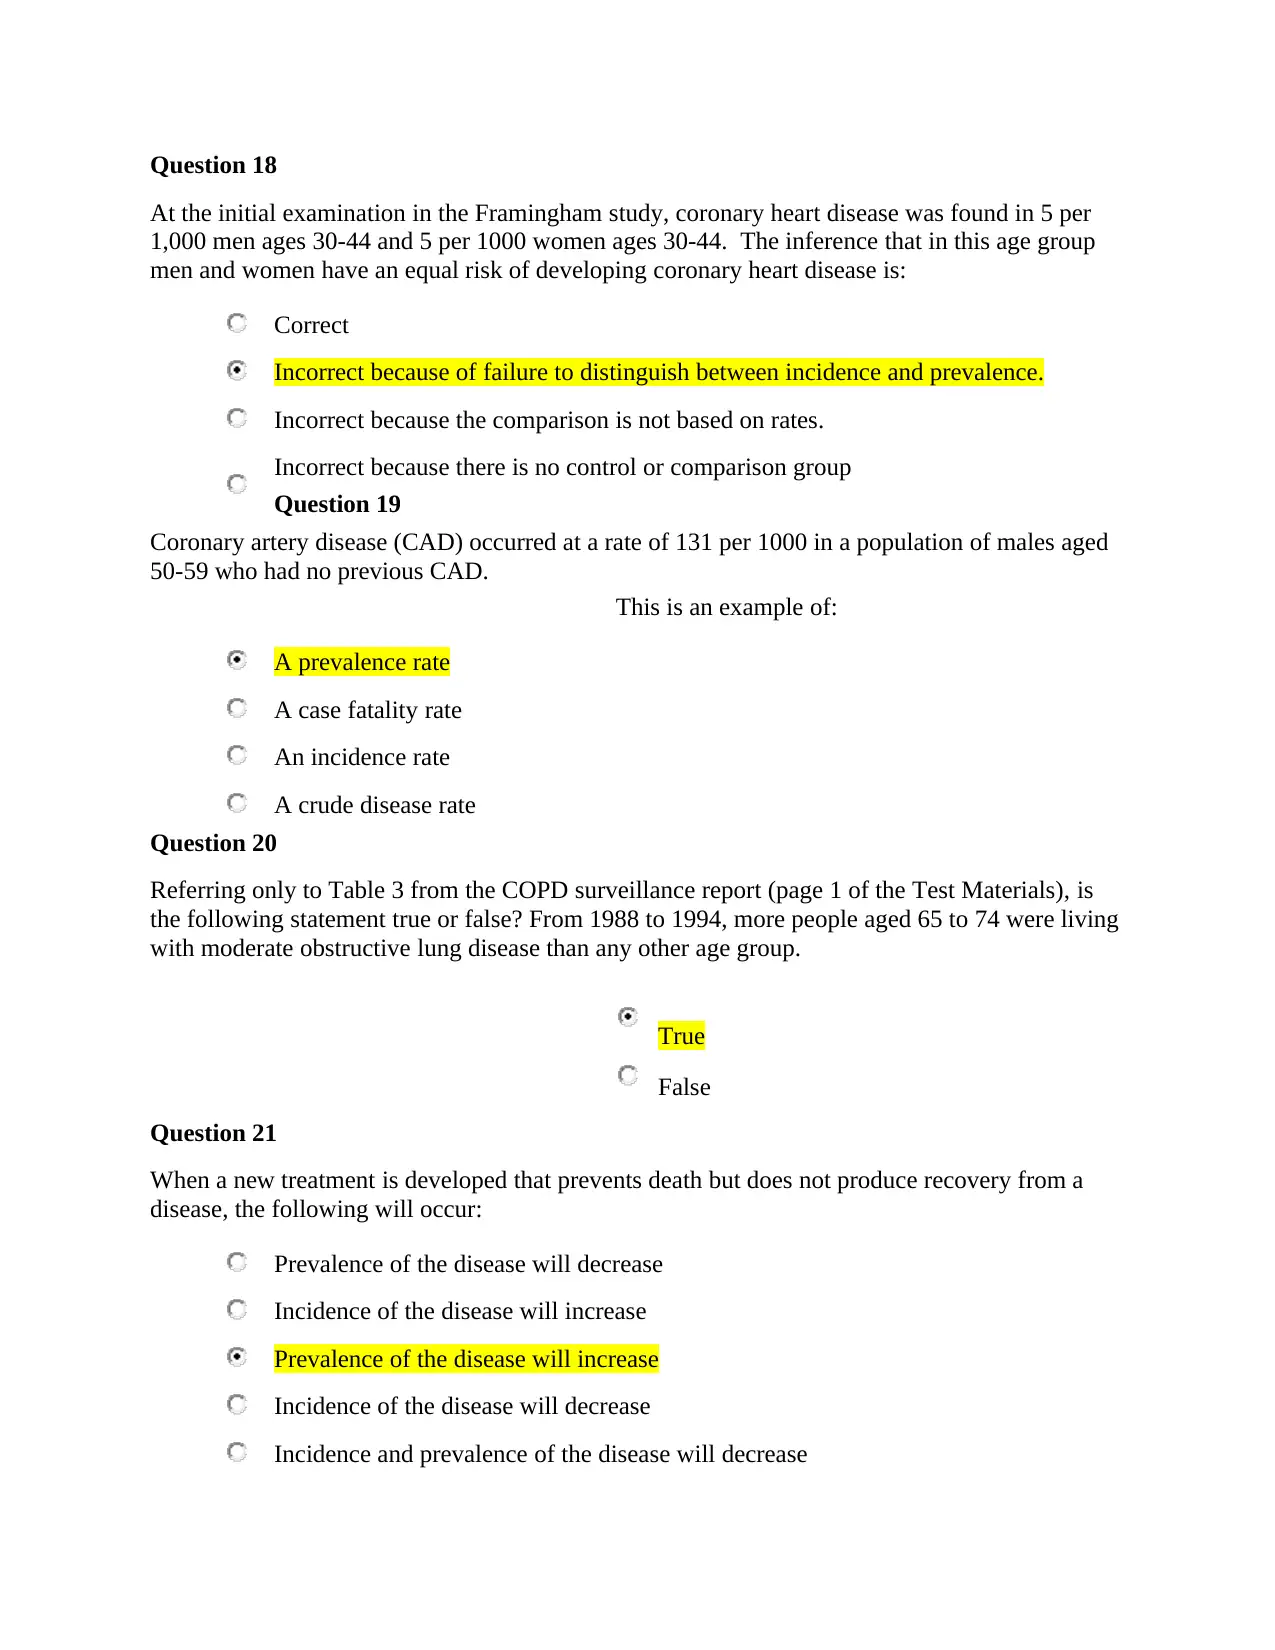
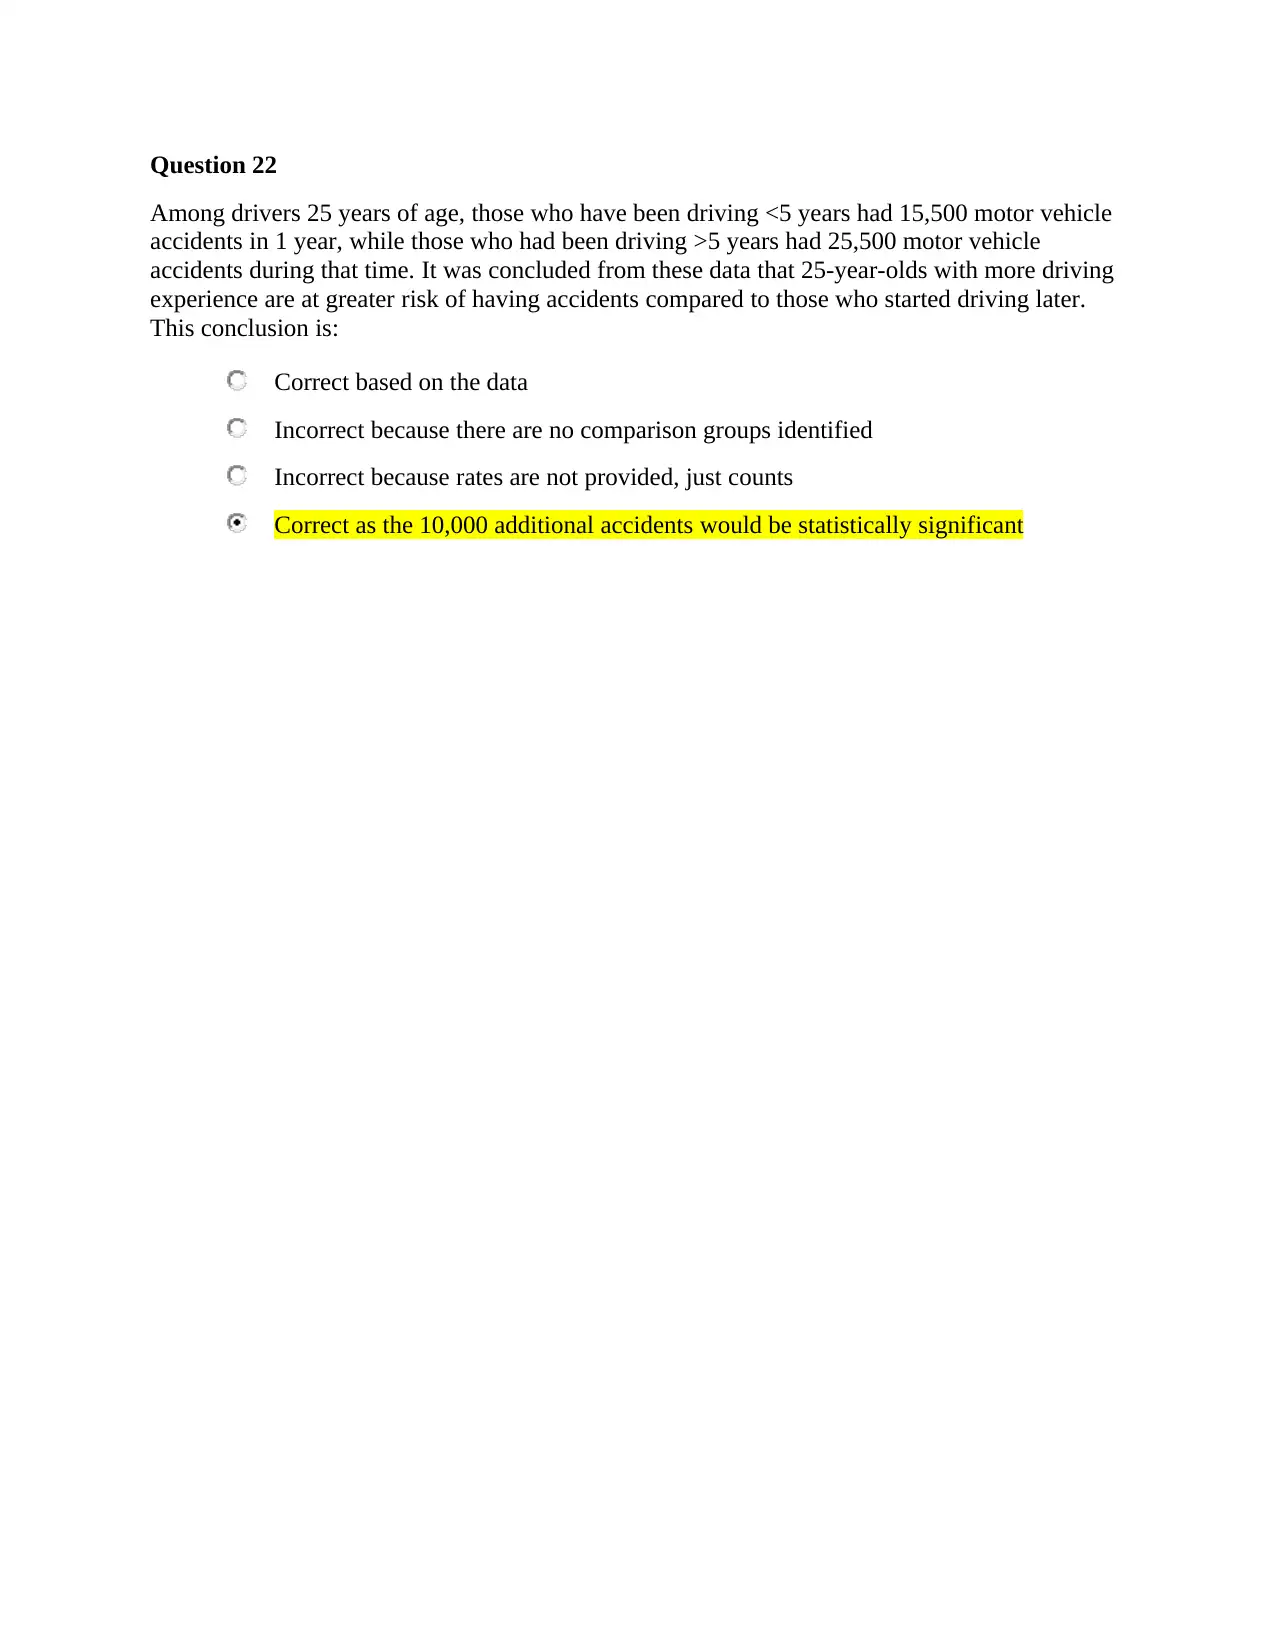
This assignment focuses on understanding and applying key measures of disease occurrence in epidemiology. It covers topics such as incidence rate, attack rate, category-specific rates, prevalence, crude mortality rate, and case fatality rate. Several questions require calculations and interpretations based on provided data, including scenarios involving respiratory tract infections, salmonella outbreaks, and mortality rates in a city. The assignment also explores factors that influence prevalence, the interpretation of epidemiological studies like John Snow's cholera investigation, and the use of datasets for estimating mortality rates related to specific diseases. Specific attention is given to the importance of using appropriate measures and comparisons to avoid incorrect inferences, highlighting the nuances of epidemiological analysis. Desklib offers more solved assignments and study resources for students.
Document Page
Question I. During a study of 20 years five people are followed to measure the occurrence of
upper
respiratory tract infection. As this infection can occur more than once, all disease events are
included in this study.
1 person is lost to follow-up after 1.5 years.
2 persons died respectively after 10 and 15 years from a different cause.
1 person got the first respiratory tract infection after seven years and the second infection after 12
years of follow-up. Both infections take half a year of recovery. This person is followed-up until
the end of the study.
One person is followed-up the whole period without occurrence of disease.
1) Which measure of disease occurrence can be calculated?
Incidence rate
2) Calculate measure of disease occurrence.
Incid ence rate= No . of New Cases of Diseasea given time period
Total Persontime at risk duringthe followuo period
Cases Years at
Risk
perso
n 1
0
1.5
perso
n 2
0
10
perso
n 3
0
15
perso
n 4
2
19
perso
n 5
0
20
2
65.5
Incidenc
e rate
0.0305343
51
Q U E S TI O N 2
Attack rate is a measure of risk. In a small community of 460 residents, 87 attended a social
event that included a meal prepared by several individuals. Within 3 days, 39 of those who
tabler-icon-diamond-filled.svg

Paraphrase This Document

Need a fresh take? Get an instant paraphrase of this document with our AI Paraphraser
Document Page
attended the event became ill with a condition diagnosed as salmonella enterocolitis. The attack
rate among attendees was:
11.8/100
8.5/100
18.9/100
44.8/100
Question 3
To compare the risk of Disease A in males vs. the risk in females, which occurrence of disease
we should use and why? (explain your answer)
Category-specific rates
It allows for the assessment of occurrence with regard to a specific cohort or group of individuals
in a population
Question 4
How does prevalence of a disease decrease? When there is a negative change in the number of
new cases of disease in a given population
Provide 4 conditions that can decrease the prevalence of a disease:
1. Disease is cured in infected person
2. Infected person dies
3. Persons are lost to follow-up
4. Persons die due to other diseases or cases
Question 5
A city contains 100,000 people (60,000 males and 40,000 females). During a one year period,
there were 1,000 deaths in the city (600 in males and 400 in females).
The crude mortality rate for the city (per 100,000)
was:
300 x 100,000 = 300 per 100,000
100,000
600 x 100,000 = 600 per 100,000
Document Page
100,000
45 x 100,000 = 45 per 100,000
100,000
1000 x 100,000 = 1000 per 100,000
100,000
Question 6
California highway patrol statistics revealed that more accidents occurred to blue cars than to
cars of any other color. The inference that, while driving a blue car, one is at higher risk of
accident than driving a car of another color is:
Incorrect
Incorrect, because the comparison is not based on rates
Incorrect, because no test of statistical significance has been made
Incorrect, because prevalence is used instead of incidence
Question 7
This Table describes the number of illness and deaths caused by plague in four communities.
Which community has the lowest case fatality rate for plague?
1.
Community A 100/150=66.7%
Community B 300/400=74%
Community C 300/500=60%
Community D 500/650=76.9%
Question 8
Total
Deaths
Death from
Plague
Sick from
Plague
Community A 200 100 150
Community B 400 300 400
Community C 800 300 500
Community D 5,000 500 650
Document Page
The incidence rate of a disease is five times greater in women than in men, but the prevalence
rates show no sex difference. The best explanation is that:
The crude all-cause mortality rate is greater in women
The case-fatality from this disease is greater in women
The case-fatality from this disease is lower in women
The duration of this disease is shorter in men.
Risk factors for the disease are more common in women
Question 9
To estimate mortality rates related to cardiovascular disease in Massachusetts, you would use
which one of the following datasets:
BRFSS
National Health Interview Survey
NHANES
SEER
None of the above
Question 10
How does prevalence of a disease increase? When new cases of disease occurrence are observed
Provide 4 conditions that can increase the prevalence of a disease:
1. Population becomes more susceptible to the disease
2. Re-infections can take place numerous times
3. The disease is highly resistant to treatment
4. The disease is highly communicable
Question 11
Refer to the data presented in Table 1 (page 3 of the Test materials).The incidence and
prevalence rates of a chronic childhood illness for a specific community are given in Table 1.
Based on the data in the table, which of the following interpretations best describes this chronic
childhood disease?
The duration of disease is becoming longer
The case fatality rate of this disease is decreasing
The duration of disease is becoming shorter
Efforts to prevent new cases of this disease are becoming more successful.
tabler-icon-diamond-filled.svg

Paraphrase This Document

Need a fresh take? Get an instant paraphrase of this document with our AI Paraphraser
Document Page
Question 12
If you wanted to measure the cumulative incidence of Lyme disease in a defined population, for
example, people living in Boston in 2010, an accurate estimate could only be obtained using
which of the following:
Open (or dynamic) cohort
Closed (or fixed) cohort
A survey of the population at one point in time (cross-sectional survey)
Question 13
John Snow's investigation of cholera is considered a model for epidemiologic field investigations
because it included a:
A Biologically plausible hypothesis
Statistical model
Spot map
Comparison of a health outcome among exposed and unexposed groups
Question 14
Regionville is a community of 100,000 persons. During 1985 there were 1,000 deaths from all
causes. All cases of tuberculosis have been found and they total 300 (200 males and 100
females). During 1985, there were 60 deaths from tuberculosis, 50 of them males. What is the
crude mortality rate for Regionville?
300 per 100,000
60 per 1,000
10 per 1,000
200 per 1,000
Question 15
T his Table describes the number of illness and deaths caused by plague in four communities.
Which community had the highest proportionate mortality for plague?
Document Page
Community A 100/200=50%
Community B 300/400= 75%
Community C 300/800= 37.5%
Community D 500/5000=10%
Question 16
R eferring to the data presented in Table 14 (page 2 of the Test materials), which one of the
following statements is true:
During the 20 years from 1980 to 2000, COPD was the leading cause of death
among persons aged 75 and older.
The case fatality rate for COPD is higher in men than in women.
Death rates from COPD over the 20 years from 1980 to 2000 have generally
increased among all race groups and among women and older adults.
Annual death rates for COPD have doubled in the 20 years from 1980 to 2000.
Question 17
A city contains 100,000 people. (60,000 males and 40,000 females) During a one year period,
there were 1,000 deaths in the city (600 in males and 400 in females). Fifty of the city's
inhabitants had lung cancer -- 45 of these died during the year.
Sex-specific mortality rate for females was:
400 x 100,000 = 1000 per 100,000
40,000
400 x 100,000 = 40,000 per 100,000
1,000
400 x 100,000 = 66,667 per 100,000
600
Total
Deaths
Death from
Plague
Sick from
Plague
Community A 200 100 150
Community B 400 300 400
Community C 800 300 500
Community D 5,000 500 650
Document Page
Question 18
At the initial examination in the Framingham study, coronary heart disease was found in 5 per
1,000 men ages 30-44 and 5 per 1000 women ages 30-44. The inference that in this age group
men and women have an equal risk of developing coronary heart disease is:
Correct
Incorrect because of failure to distinguish between incidence and prevalence.
Incorrect because the comparison is not based on rates.
Incorrect because there is no control or comparison group
Question 19
Coronary artery disease (CAD) occurred at a rate of 131 per 1000 in a population of males aged
50-59 who had no previous CAD.
This is an example of:
A prevalence rate
A case fatality rate
An incidence rate
A crude disease rate
Question 20
Referring only to Table 3 from the COPD surveillance report (page 1 of the Test Materials), is
the following statement true or false? From 1988 to 1994, more people aged 65 to 74 were living
with moderate obstructive lung disease than any other age group.
True
False
Question 21
When a new treatment is developed that prevents death but does not produce recovery from a
disease, the following will occur:
Prevalence of the disease will decrease
Incidence of the disease will increase
Prevalence of the disease will increase
Incidence of the disease will decrease
Incidence and prevalence of the disease will decrease
tabler-icon-diamond-filled.svg

Paraphrase This Document

Need a fresh take? Get an instant paraphrase of this document with our AI Paraphraser
Document Page
Question 22
Among drivers 25 years of age, those who have been driving <5 years had 15,500 motor vehicle
accidents in 1 year, while those who had been driving >5 years had 25,500 motor vehicle
accidents during that time. It was concluded from these data that 25-year-olds with more driving
experience are at greater risk of having accidents compared to those who started driving later.
This conclusion is:
Correct based on the data
Incorrect because there are no comparison groups identified
Incorrect because rates are not provided, just counts
Correct as the 10,000 additional accidents would be statistically significant
chevron_up_icon
1 out of 8
circle_padding
hide_on_mobile
zoom_out_icon
[object Object]