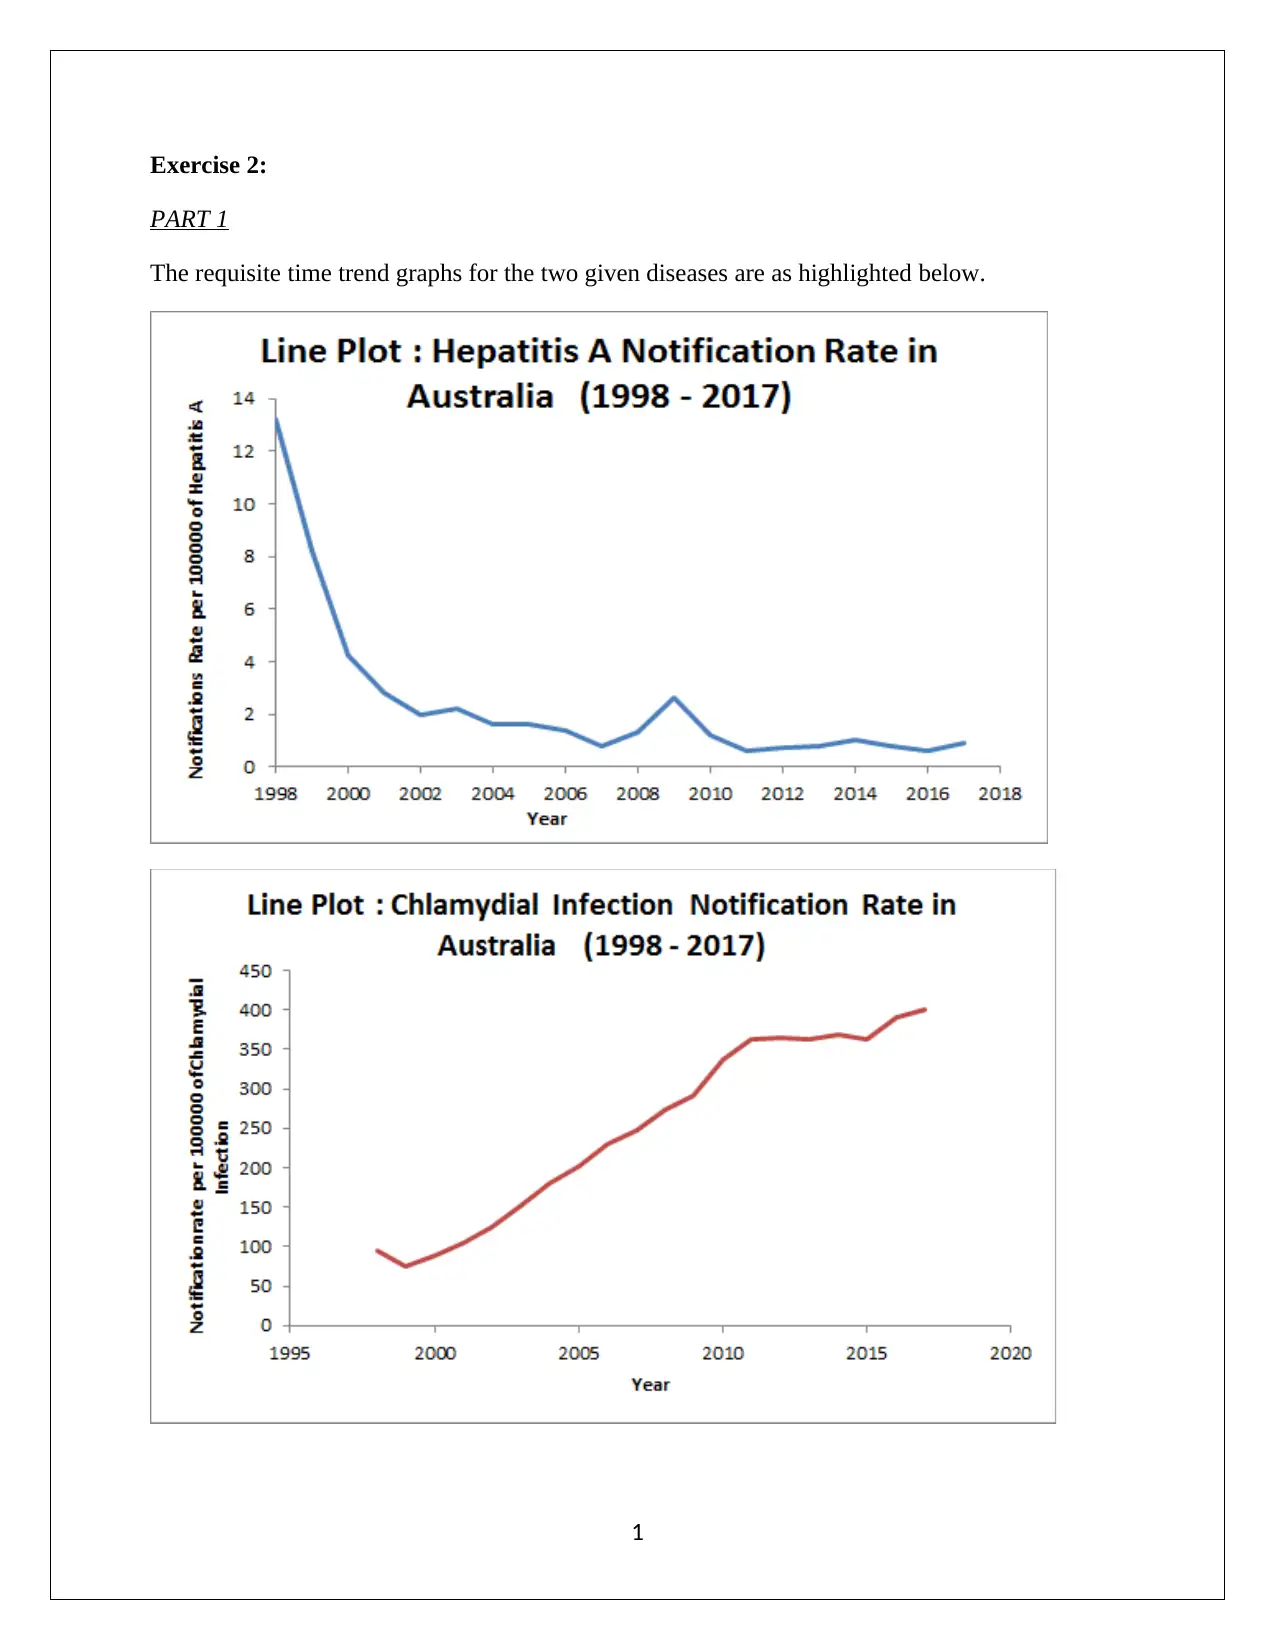
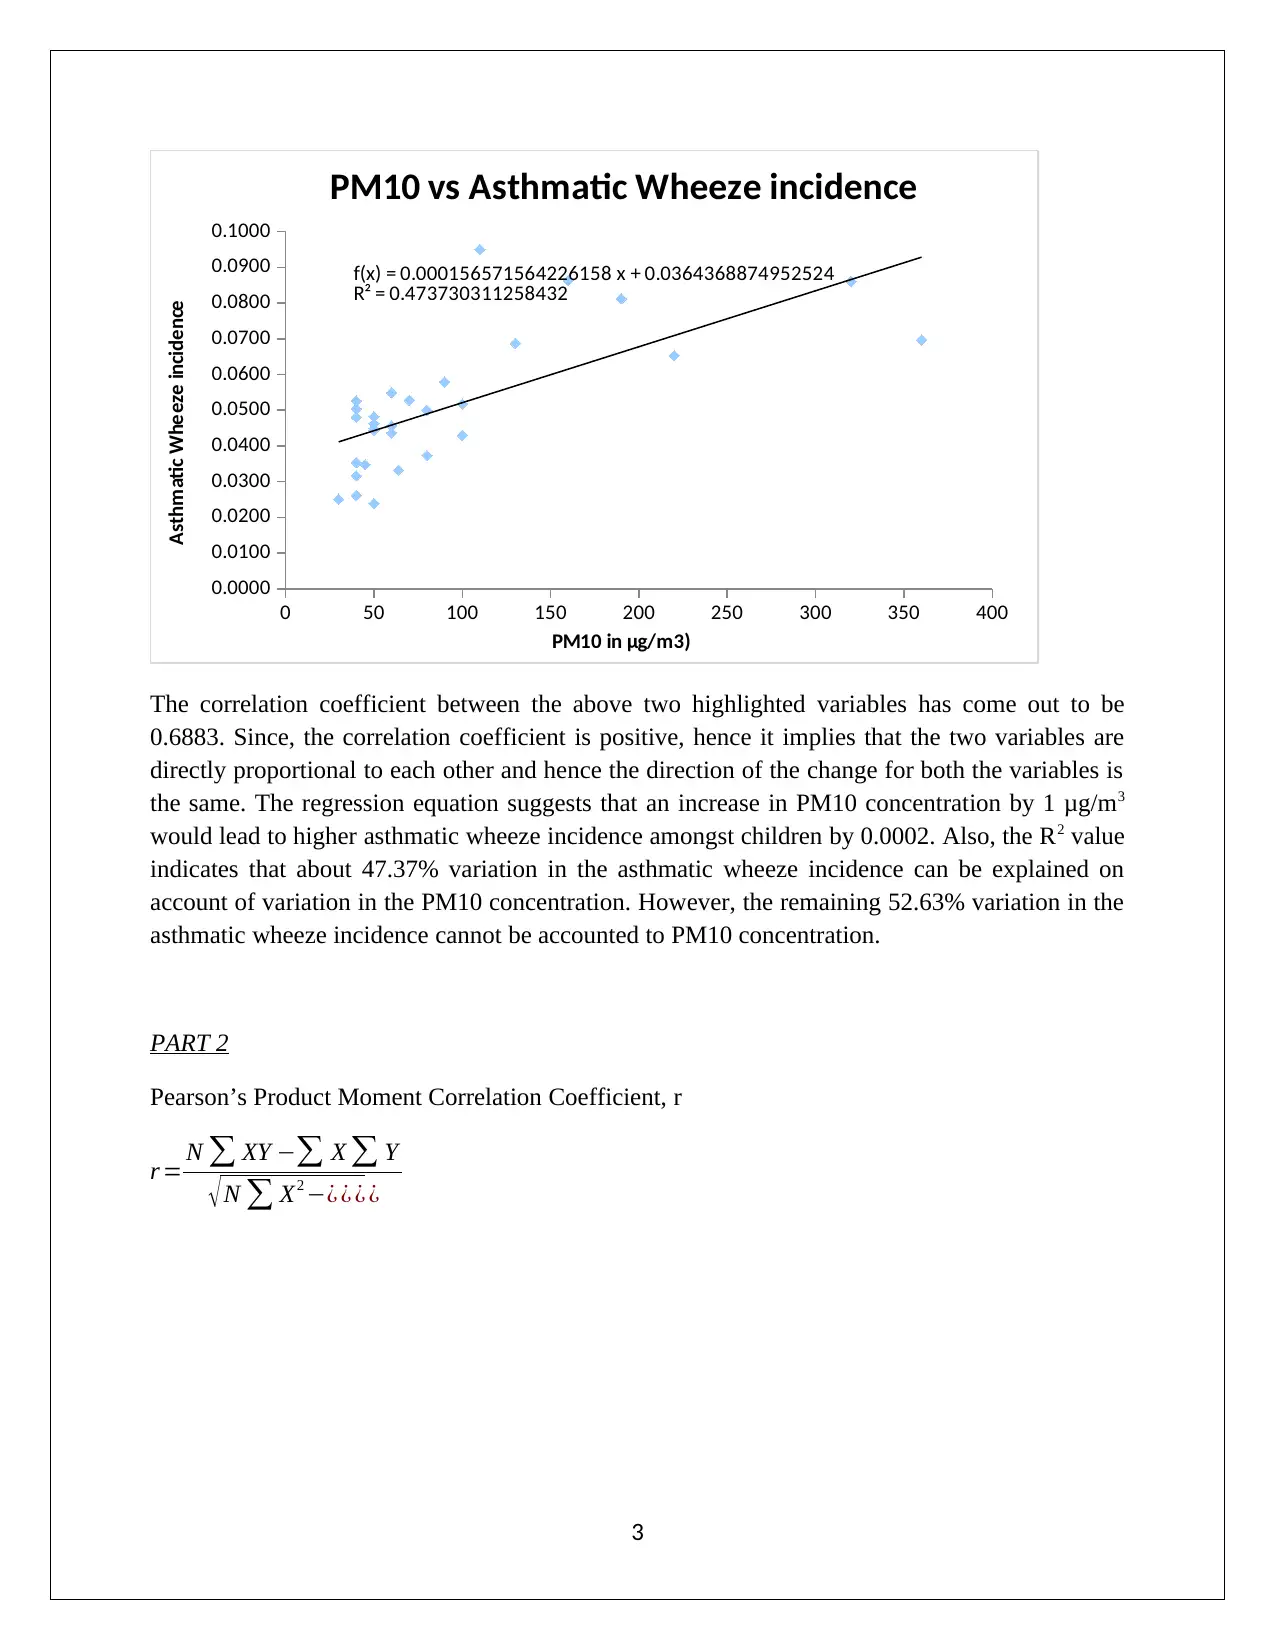
Epidemiology Exercises: Public Health, Disease Trends & Risk Analysis

Verified

Added on  2023/06/14

|9
|1467
|468
Homework Assignment
AI Summary
This assignment solution focuses on epidemiology exercises related to public health. It includes an analysis of disease trends in Australia, specifically Hepatitis A and Chlamydia, highlighting the impact of immunization programs and diagnostic improvements. The solution also examines the correlation between asthma incidence and ambient particulate matter using bivariate correlation and regression analysis. Furthermore, it conducts an association analysis to determine the relationship between eating canteen food and being overweight, recommending interventions for promoting healthier food choices. Finally, the assignment performs a relative risk analysis to identify food items with the highest risk of causing food poisoning, concluding that Salmonella is the likely cause based on symptoms and incubation period. Desklib provides students with access to a wealth of resources, including past papers and solved assignments, to support their academic endeavors.
Document Page
Health
Exercises
Student ID:
[Pick the date]
tabler-icon-diamond-filled.svg

Paraphrase This Document

Need a fresh take? Get an instant paraphrase of this document with our AI Paraphraser
Document Page
Exercise 2:
PART 1
The requisite time trend graphs for the two given diseases are as highlighted below.
1
Document Page
PART 2
Based on the above line graphs it is apprent that the incidence of Hepatitis A in Australia has
witnessed a significant fall over the years. The only aberration in this trend was the year 2009.
Also, it is clear that over the years the incidence of Chlamydia Infection has increased over the
last 20 years.
One of the key reasons for the decline in Hepaptitis A notifications in Australia is the targeted
Hepatitis A immunisation program which the Australian government has sucessful run over the
last two decades. In particular, it is notieable that the governrment extended the national
immunisation program for Hepatitis A to the indigenous children in November 2005 with the
aim of controllign fresh notifications (Thompson et. al, 2017). Additionally, consdiring that the
mechnism of transmission for Hepatitis A is through faecal-oral route and hence through
awareness coupled with immunisation program, the deceasing trend of Hepatitis B is on expected
lines (Royle and Lambert, 2015).
Unlike Hepatitis A, Chlamydia is a sexually transmitted diseases. One of the key reasons for the
increasing incidence of this disease in Australia over the last 20 years is the improvement in
diagnosis technique on account of advanced technologies (Ketty, 2016). Another key reason for
the rise could be rising secual activity that too with multiple partners as a result of which there
has been increase not only in Chlamydia but also in other sexually transmitted diseases in
Australia (Callander, 2017).
Exercise 3: Regression (Simple Correlation)
PART 1
Bivariate correlation graph in order to determine the correlation between asthma wheeze
incidence and ambient atmospheric particulate matter (PM10) is indicated below.
2
Document Page
0 50 100 150 200 250 300 350 400
0.0000
0.0100
0.0200
0.0300
0.0400
0.0500
0.0600
0.0700
0.0800
0.0900
0.1000
f(x) = 0.000156571564226158 x + 0.0364368874952524
R² = 0.473730311258432
PM10 vs Asthmatic Wheeze incidence
PM10 in μg/m3)
Asthmatic Wheeze incidence
The correlation coefficient between the above two highlighted variables has come out to be
0.6883. Since, the correlation coefficient is positive, hence it implies that the two variables are
directly proportional to each other and hence the direction of the change for both the variables is
the same. The regression equation suggests that an increase in PM10 concentration by 1 μg/m3
would lead to higher asthmatic wheeze incidence amongst children by 0.0002. Also, the R2 value
indicates that about 47.37% variation in the asthmatic wheeze incidence can be explained on
account of variation in the PM10 concentration. However, the remaining 52.63% variation in the
asthmatic wheeze incidence cannot be accounted to PM10 concentration.
PART 2
Pearson’s Product Moment Correlation Coefficient, r
r = N XY X Y
N X2 ¿ ¿ ¿ ¿
3
tabler-icon-diamond-filled.svg

Paraphrase This Document

Need a fresh take? Get an instant paraphrase of this document with our AI Paraphraser
Document Page
r =30 ( 174.2408 ){( 2819 ) (1.5345 ) }
30 ( 456821 ) ¿ ¿ ¿
r = 901.5185
2399.550.5458
r =0.6883
The value of correlation coefficient using the excel formula and manual computation indicated
above yield the same value and no difference has been observed between the two values.
Exercise 4: Association Analysis
PART 1
4
Document Page
Contingency table
Particulars Overweight Not overweight Total
Eating Canteen Food 43 130 173
Bringing lunch from
home
44 257 301
Total 87 387 474
The relevant hypotheses are as listed below.
Null Hypothesis: The eating of canteen food and the prevalence of being overweight or
underweight are independent of each other
Alternative Hypothesis: The eating of canteen food and the prevalence of being overweight or
underweight are not independent of each other
Observed frequency table
Expected
Chi-square computation
c2= ( OE )2
E
5
Document Page
X2 =3.9836+0.8955+2.2896+0.5147=7.6834
Degree of freedom = (2-1) (2-1) = 1
The p value for the above two inputs comes out to be 0.0056
Considering a significance level of 0.05, it is apparent that the computed p value is lesser than
the significance value. As a result, the available evidence is sufficient to cause rejection of the
null hypothesis and acceptance of the alternative hypothesis. Hence, it may be concluded that the
prevalence of being overweight or underweight is significantly impacted by the habit of eating
canteen food. However, it is noteworthy that preference of the student towards canteen food
actually leads to higher prevalence of being overweight in comparison to bringing home
prepared lunches.
PART 2
Based on the above hypothesis test, it is apparent that the canteen food is unhealthy and hence is
associated with higher prevalence of being overweight. As a result, the headmaster should ensure
that the menu served at the canteens is altered and focus more on vegetables, fruits and salads
instead of processed foods. Additionally, an awareness based intervention should also be
introduced by the headmaster, which should aim to education the students about healthy food
choices besides providing incentives for making healthy choices (Rees Richards and Gregory,
2008). Also, in class competition can be introduced which would aim to acknowledge students
who would bring fresh fruits as part of their lunch. Besides, certain sessions for the parents can
also be arranged highlighting the healthy dietary combinations as part of the home prepared
lunches (Kessler, 2016).
Exercise 5: Relative Risk Analysis
PART 1
The risk rate for the exposed population for various food items has been computed as indicated
below.
6
tabler-icon-diamond-filled.svg

Paraphrase This Document

Need a fresh take? Get an instant paraphrase of this document with our AI Paraphraser
Document Page
From the above table, it is apparent that the two food items with the highest risk are “Foie gras in
aspic” and “Glazed fruit tart”. For these two missed foods, there are no common ingredient
considering that the main ingredient for the former dish is Foie gras while for the latter, the main
ingredient is various fruits.
PART 2
Based on the provided information in relation with the symptoms and also the incubation period
which was observed in some hours only, it may be concluded that the given food poisoning is
Salmonella induced. The major cause of this type of food poisoning is that the meat or the dairy
product remaining undercooked. For all the above items, it is apparent that either meat or dairy
based product is used for all the above mentioned dishes. Additionally, for the other types of
food poisoning, the incubation period is not as short as has been observed in the given case.
Thus, considering the above aspects in relation to the food items at risk along with the incubation
period, it would be fair to conclude that this is Salmonella based food poisoning (Kunwar et. al.,
2013).
7
Document Page
References
Callander, D.(2017) Sexually transmissible infections: Why are STIs on the rise in Australia?,
[online] Available at http://www.abc.net.au/news/health/2017-08-16/why-are-stis-on-the-rise-in-
australia/8774378 [Accessed April 6, 2018]
Kessler, H.(2016) Simple interventions to improve healthy eating behaviors in the school
cafeteria Nutrition Reviews, 74(3), pp.198-209
Ketty, D. (2016) Chlamydia is an increasing problem [online] Available at
http://www.bodyandsoul.com.au/health/health-news/chlamydia-is-an-increasing-problem/news-
story/e4d08afb8ba7da7466249c60438e233f [Accessed April 6, 2018]
Kunwar, R., Singh, H., Mangla, V. and Hirenath, R. (2013) Outbreak
investigation: Salmonella food poisoning Medical Journal Armed Forces India, 69(4), pp. 388-
391
Rees G.A., Richards C.J. and Gregory J. (2008) Food and nutrient intakes of primary school
children: a comparison of school meals and packed lunches Journal of Human Nutrition and
Dietetics. 21(1), pp.420–427
Royle, J. and Lambert, S.B. (2015) Fifty years of immunisation in Australia (1964–2014): the
increasing opportunity to prevent diseases Journal of Paediatric Child Health, 51 (1), pp.16-20
Thompson, C., Dey, A., Fearnley, E., Polkinghome, B. and Beard, F.(2017) Impact of the
national targeted Hepatitis A immunisation program in Australia: 2000–2014 Vaccine,35(1),
pp.170-176
8
chevron_up_icon
1 out of 9
circle_padding
hide_on_mobile
zoom_out_icon
[object Object]