SOCI 1236/PUB 1236 (SCW) SOC 2407/EXQM 1007 (YC) - Problem Set 2
VerifiedAdded on 2021/04/24
|10
|1752
|96
Homework Assignment
AI Summary
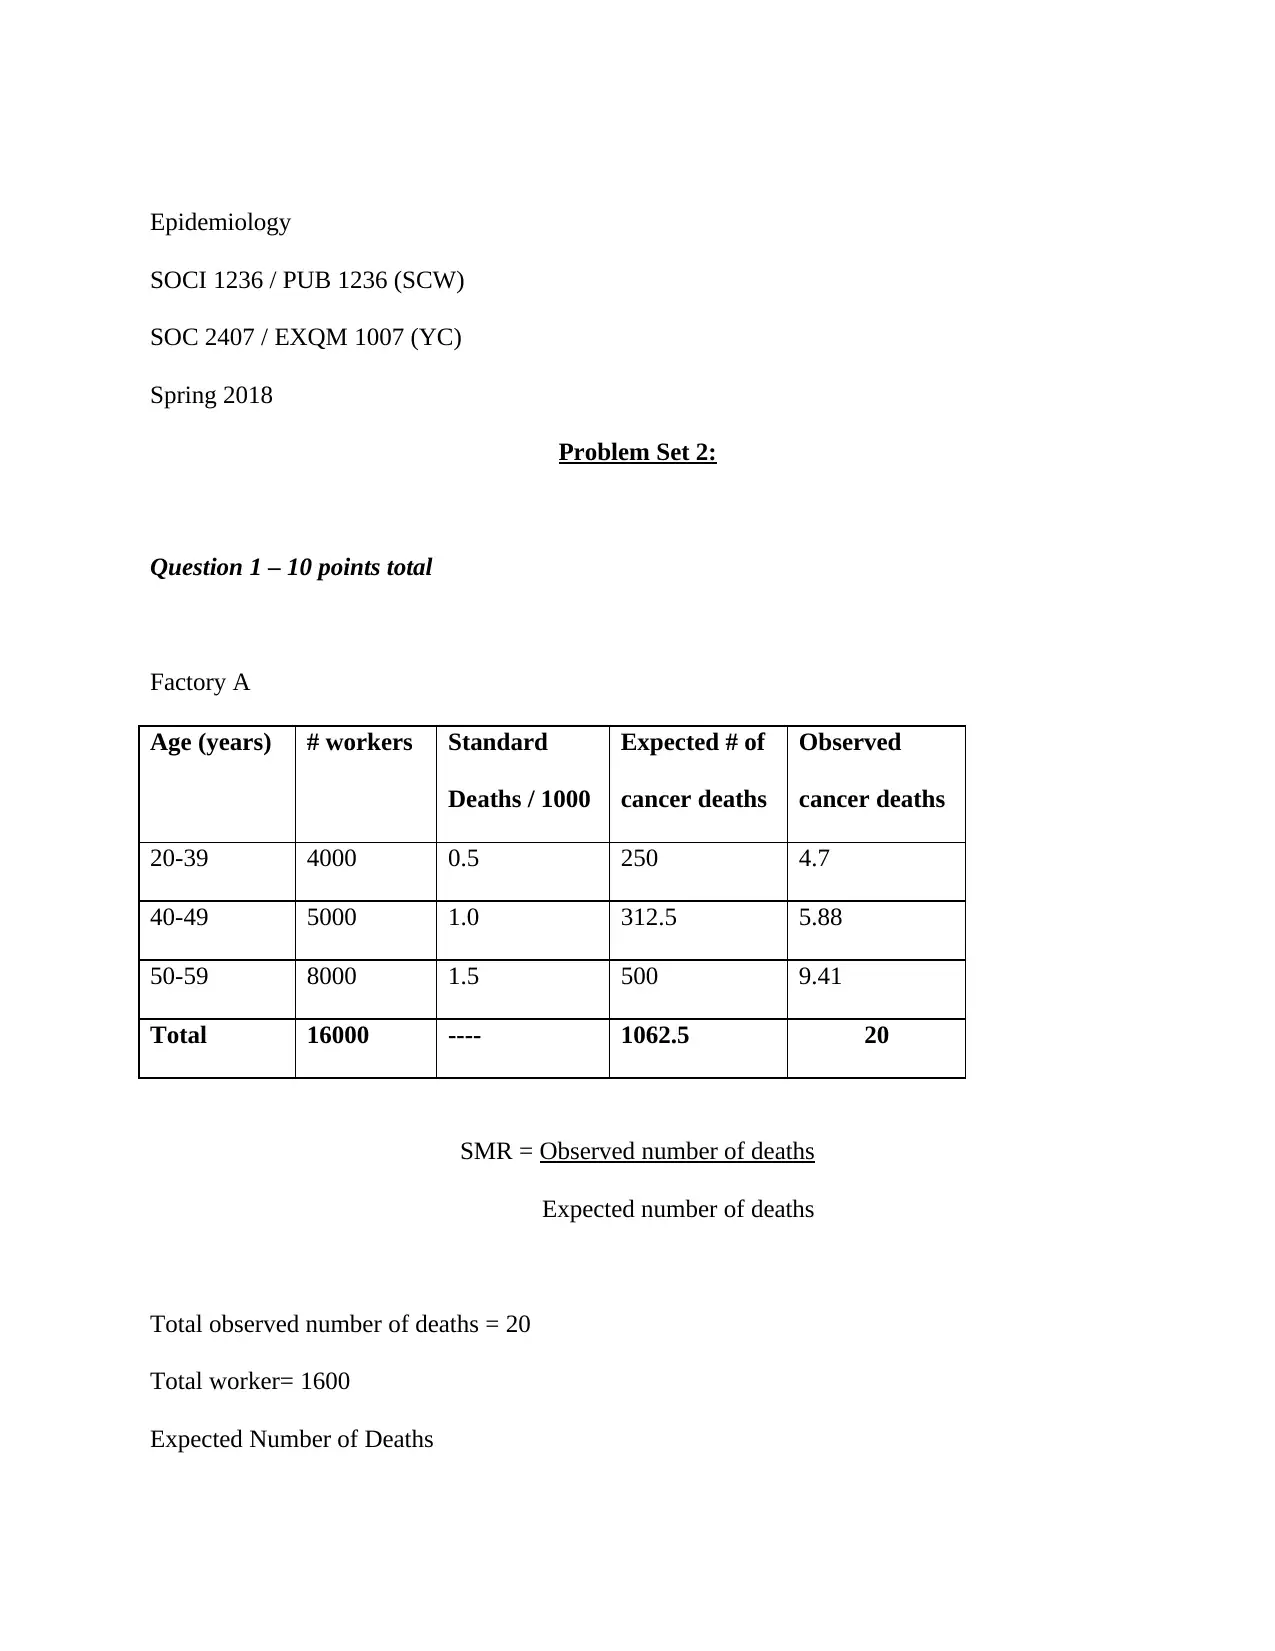
This document presents a comprehensive solution to an epidemiology problem set, covering various aspects of data analysis and interpretation. The assignment begins with the analysis of Standardized Mortality Ratios (SMR) to assess cancer death risks across different age groups in a factory setting. It then delves into a study on HIV vaccine efficacy, exploring incidence density, vaccine efficacy calculations, the importance of randomization and double-blind experiments, and ethical considerations. The solution further analyzes a rapid HIV test, calculating sensitivity, specificity, and likelihood ratios to evaluate the test's performance. Finally, it examines the power of a statistical test and its implications on test results. The document includes detailed explanations, calculations, and interpretations of the results, providing a clear understanding of epidemiological concepts and their practical applications. The reference section provides a list of supporting literature.
Contribute Materials
Your contribution can guide someone’s learning journey. Share your
documents today.

Epidemiology
SOCI 1236 / PUB 1236 (SCW)
SOC 2407 / EXQM 1007 (YC)
Spring 2018
Problem Set 2:
Question 1 – 10 points total
Factory A
Age (years) # workers Standard
Deaths / 1000
Expected # of
cancer deaths
Observed
cancer deaths
20-39 4000 0.5 250 4.7
40-49 5000 1.0 312.5 5.88
50-59 8000 1.5 500 9.41
Total 16000 ---- 1062.5 20
SMR = Observed number of deaths
Expected number of deaths
Total observed number of deaths = 20
Total worker= 1600
Expected Number of Deaths
Secure Best Marks with AI Grader
Need help grading? Try our AI Grader for instant feedback on your assignments.

(4000÷1600) X 100 = 250
(5000÷1600) X 100 = 312.5
(4000÷1600) X 100 = 500
Observed Number of Deaths
(4000÷1062.5) X 20 = 4.7
(5000÷1062.5) X 20 =5.88
(4000÷1062.5) X 20 = 9.41
From the SMR data it can be observed that there is a higher risk of death in in the age
bracket of 50-59 compared to the other age groups. Therefore simply using crude death rates
alone can lead to a misleading conclusion.
Question 2 – 40 points total
(a)
1. The experiment was conducted in Thailand since it at that time Thailand had the second
highest HIV prevalence in Asia. The Thailand nation also wanted to reduce HIV infection in the
country thus such experiments were encouraged.
2. The researchers chose to study men and women between the ages of 18 and 30 because they
are the most affected by HIV among the Thailand population. The young men and women in this
age group are sexually active and therefore are more likely to be infected to HIV compared to the
other age groups.

3. The researchers required the participants to agree to come for regular follow-up visits so as to
help them obtained all the required data throughout the experiment period.
(b)
125 people were infected during the period. 74 of which were in the placebo group and
51 from vaccine group
Incidence density for placebo group = (74 ÷3)
= 24.33 per 8198 person-year
Incident density for vaccine group = (51 ÷3)
= 17 per 8197 person-year
(c)
17 ÷ 8197 = 0.002
Efficacy of the vaccine = (1- 0.02) x 100%
= 99.8%
This efficacy implies that for every 1000 people inject with the vaccine only 2 (0.002%) are at
risk of getting infected with the disease.

(d)
The main purpose of randomization in any experiment is to eliminate any bias and
control the lurking variables in the experiment. Randomization is important in an experiment
since it eliminate any bias that might arise in the experiment. A randomization is done by
randomly selecting subjects to various variables and this helps in coming up with a more
justifiable conclusion.
(e)
The purpose of running this experiment double-blind is also to ensure that there is no
interference from the bias that may arise consciously or unconsciously from either the participant
or research. The importance of running double-blind is that it gives a wide range of findings the
researcher can come up with and the bias is eliminated or significantly reduced leading to more
precise conclusion. Double –blind experiments like this are an essential part in medicinal
research to come up with completely new findings.
(f)
Blinded experiments are usually considered to be unethical and therefore the
investigators running this experiment may have to face several ethical concerns. The word
“blind” can be taken literally in ethical context to mean clogging the perspective of the
participants. Although the experiment requires the participants to mingle freely and do their
routine activities, ethics argues that they have the right to know they are under an experiment.
The researchers argue that this might somehow affect the results therefore they ignored this right.
Secure Best Marks with AI Grader
Need help grading? Try our AI Grader for instant feedback on your assignments.

(g)
The investigators concluded with a 95 % statistical confidence that the vaccine is
effective at reducing the risk of HIV infection compared to the placebo and according to me I
think they are right in making this conclusion. This is because the efficacy of the vaccine was
even calculated to be about 99.8 percent. The vaccine therefore worked among the test
population and it can be recommended to be used in preventing HIV infection.
If I realized that during the experiment 7 subjects were determined to have been infected
with HIV at the baseline the whole statistical data becomes inaccurate. The difference between
vaccine and placebo group does not have any statistical significance in the experiment since the
seven people cannot be traced and identified properly.
(h)
The results of this experiment could have been affected by other external sources such as
loss of follow-ups and error in the baseline screening tests. If a proper follow-up data is not
provided for several subjects then the statistical significance of the experiment is lost since
proper analysis won’t be possible hence making misleading conclusions. The error in the testing
equipment during baseline test would significantly affect the data of the subjects and this could
have led to misleading conclusions and statistical figures such as the number of the subjects
affected in the vaccine and the placebo group.

Question 3 – 30 points total
Enzyme Immunoassay
HIV No HIV
Rapid
HIV test
Positive (HIV) 166 129
Negative (no HIV) 4 1218
(a)
Sensitivity of the rapid HIV test is the ability of the test to identify those with a disease.
Sensitivity = a
a + b
a = 166
b = 1218
Sensitivity = 166 ÷ (166 + 1218)
= 0.1199
= 11.99%
This implies that for every infected 100 people tested with Rapid test then 12 are most likely to
be found infected with HIV/ AIDS
(b)
Test specificity is the ability of a test to correctly test those without the disease
Specificity = d

c +b
d = true negative
c = false positive
c = 129
d = 4
Specificity = 4÷ (129+ 1218)
= 0.00297
= 0.29%
This implies that for every 100 hundred people tested for the disease and they really have
it then non will test negative. This means that means that the probability of someone who is
negative to test positive is very minute in this test.
(c)
Positive likelihood ratio = sensitivity
1- Specificity
= 0.1199
1- 0.00297
= 0.1193
= 11.93%
This implies that the percentage that those tested with the disease truly have the disease is
11.93 percent. Therefore for every 100 subjects tested positive about 12 may be negative.
Paraphrase This Document
Need a fresh take? Get an instant paraphrase of this document with our AI Paraphraser

(d)
Negative likelihood ratio = 1 - sensitivity
Specificity
= 1-0.1199
0.00297
= 296.33
The high negative predictive value implies that in this experiment it is not possible for
someone who tested negative for HIV to actually be infected.
(e)
The positive predictive value of rapid test would remain the same when used for both
pregnant women in South Africa or for Ugandan male. This is because the positive predictive
value is not dependent on the prevalence of the disease or age. The percentage of those tested
with the disease and they actually have the disease is likely to be the same in these two scenarios.
(f)
Given the values of sensitivity and specificity I calculated for rapid test we expect the
prevalence estimates for HIV in South Africa to be very high. This is because the test does not
test any positive person as a positive while at the same time it has a percentage of testing some
negative people to be positive. This implies that in any way the total number of HIV positive
people is likely going to be high than it actually is.

Question 4 – 20 points total
(a)
The power of this test is the size of the sample used in the test and the magnitude of the
observed effect. Stanley also randomly picked his subject and this eliminated any bias that might
have consciously or unconsciously develop. The size of 100 hundred sample subject randomly
divided into half means that the test population is likely a representation of the student
population. The average score of the students was 500 but Stanley method raised it to 525 which
evidently show the effects of his course.
(b)
Sample size =
Where z = z-score
e = margin error

N= Sample size
Sustituting the values above you get N= 126
(c)
Based on the results portrayed by Kaplan, I believe that his course actually increased the
scores of the students in the treatment group. This is because the experiment had a good power
since the size of the subjects and the effects of his causes were considerably large. There is a
significant difference between the average of the control group and the test group and this
illustrates the effects of his course. The control group and test group were subjected to similar
conditions at school and the only determinant between them was the course. Therefore the test
successfully showed that his test increased student scores.
Reference
Bellani, G., Laffey, J. G., Pham, T., Fan, E., Brochard, L., Esteban, A. & Ranieri, M. (2016).
Epidemiology, patterns of care, and mortality for patients with acute respiratory distress
syndrome in intensive care units in 50 countries. Jama, 315(8), 788-800.
Dobloug, G. C., Antal, E. A., Sveberg, L., Garen, T., Bitter, H., Stjärne, J., . & Molberg, Ø.
(2015). High prevalence of inclusion body myositis in Norway; a population‐based
clinical epidemiology study. European journal of neurology, 22(4), 672
1 out of 10

Your All-in-One AI-Powered Toolkit for Academic Success.
+13062052269
info@desklib.com
Available 24*7 on WhatsApp / Email
Unlock your academic potential
© 2024 | Zucol Services PVT LTD | All rights reserved.