Comprehensive Downtime Analysis Report: Industrial Facility Equipment
VerifiedAdded on  2022/10/04
|4
|1089
|116
Report
AI Summary
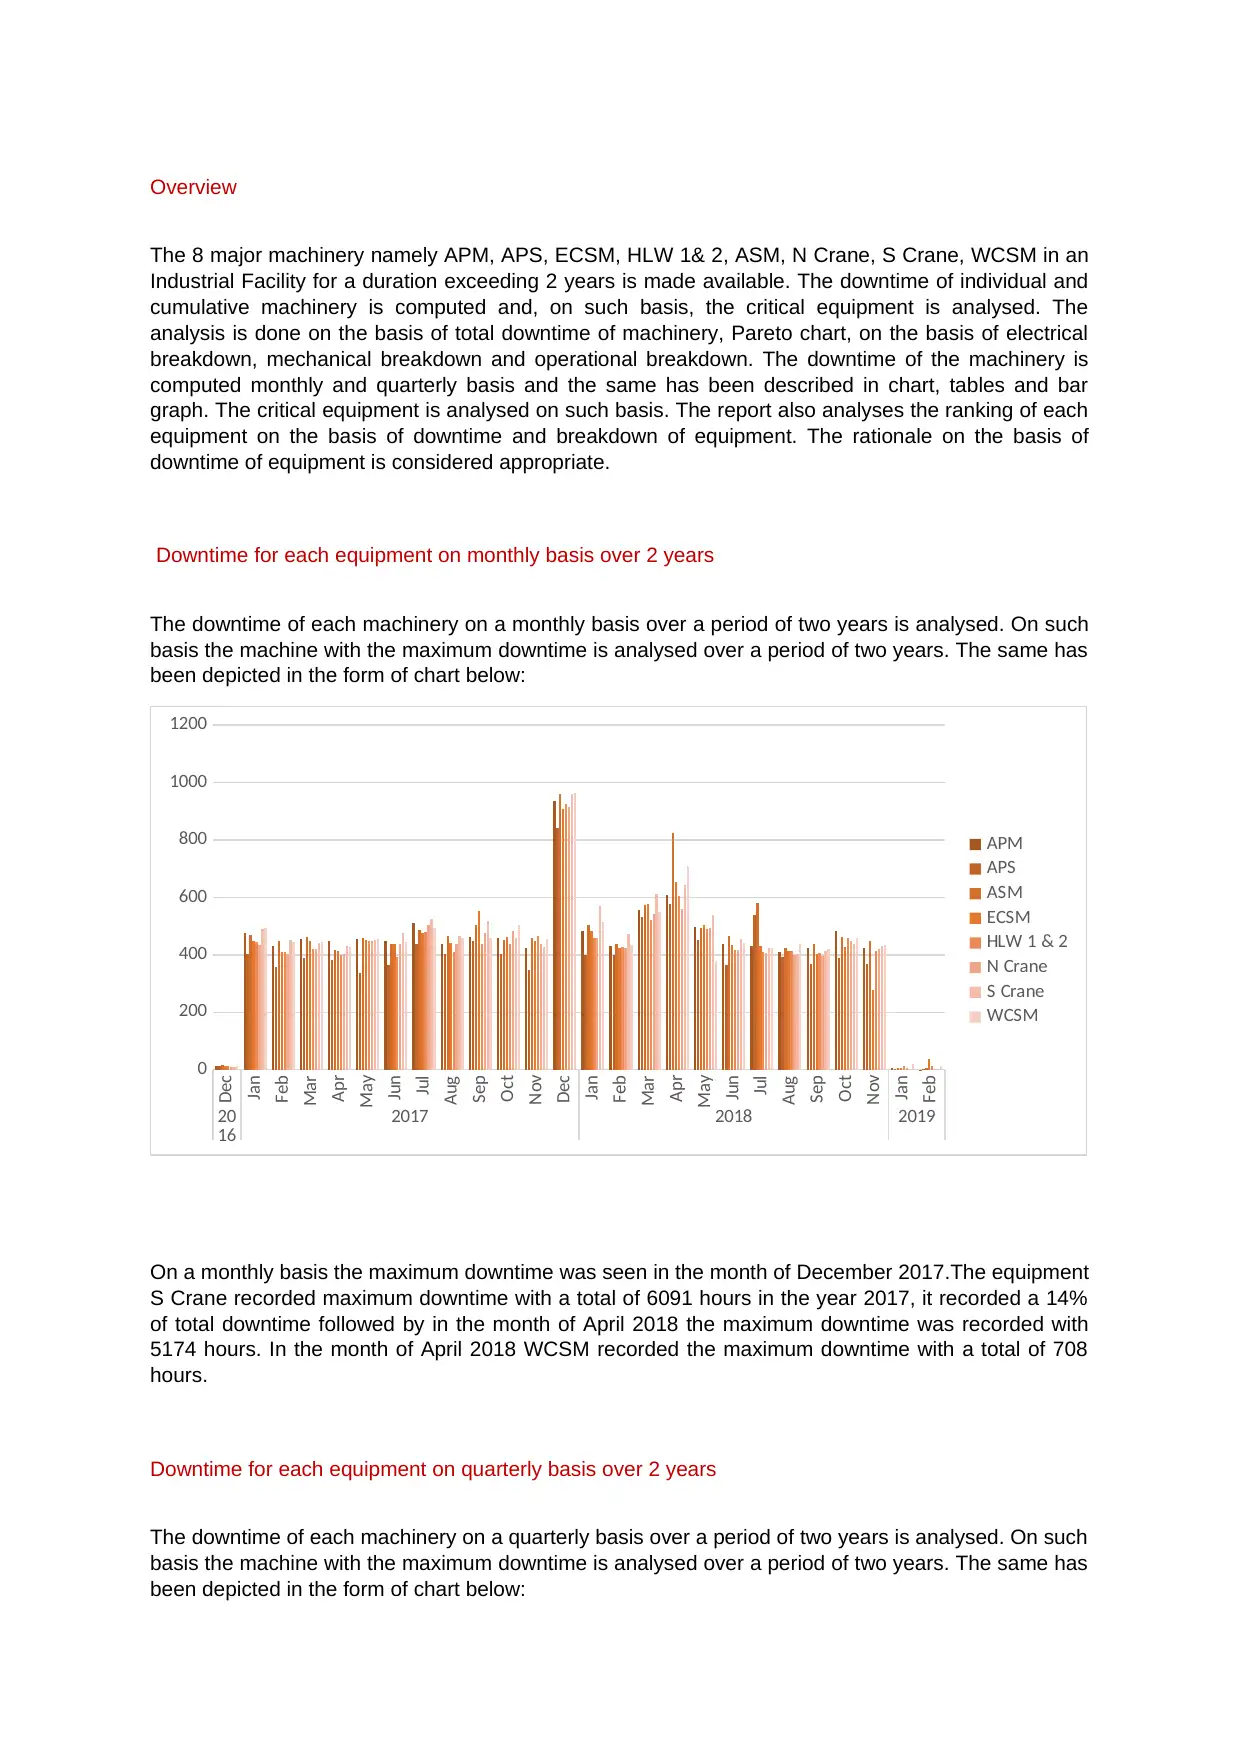
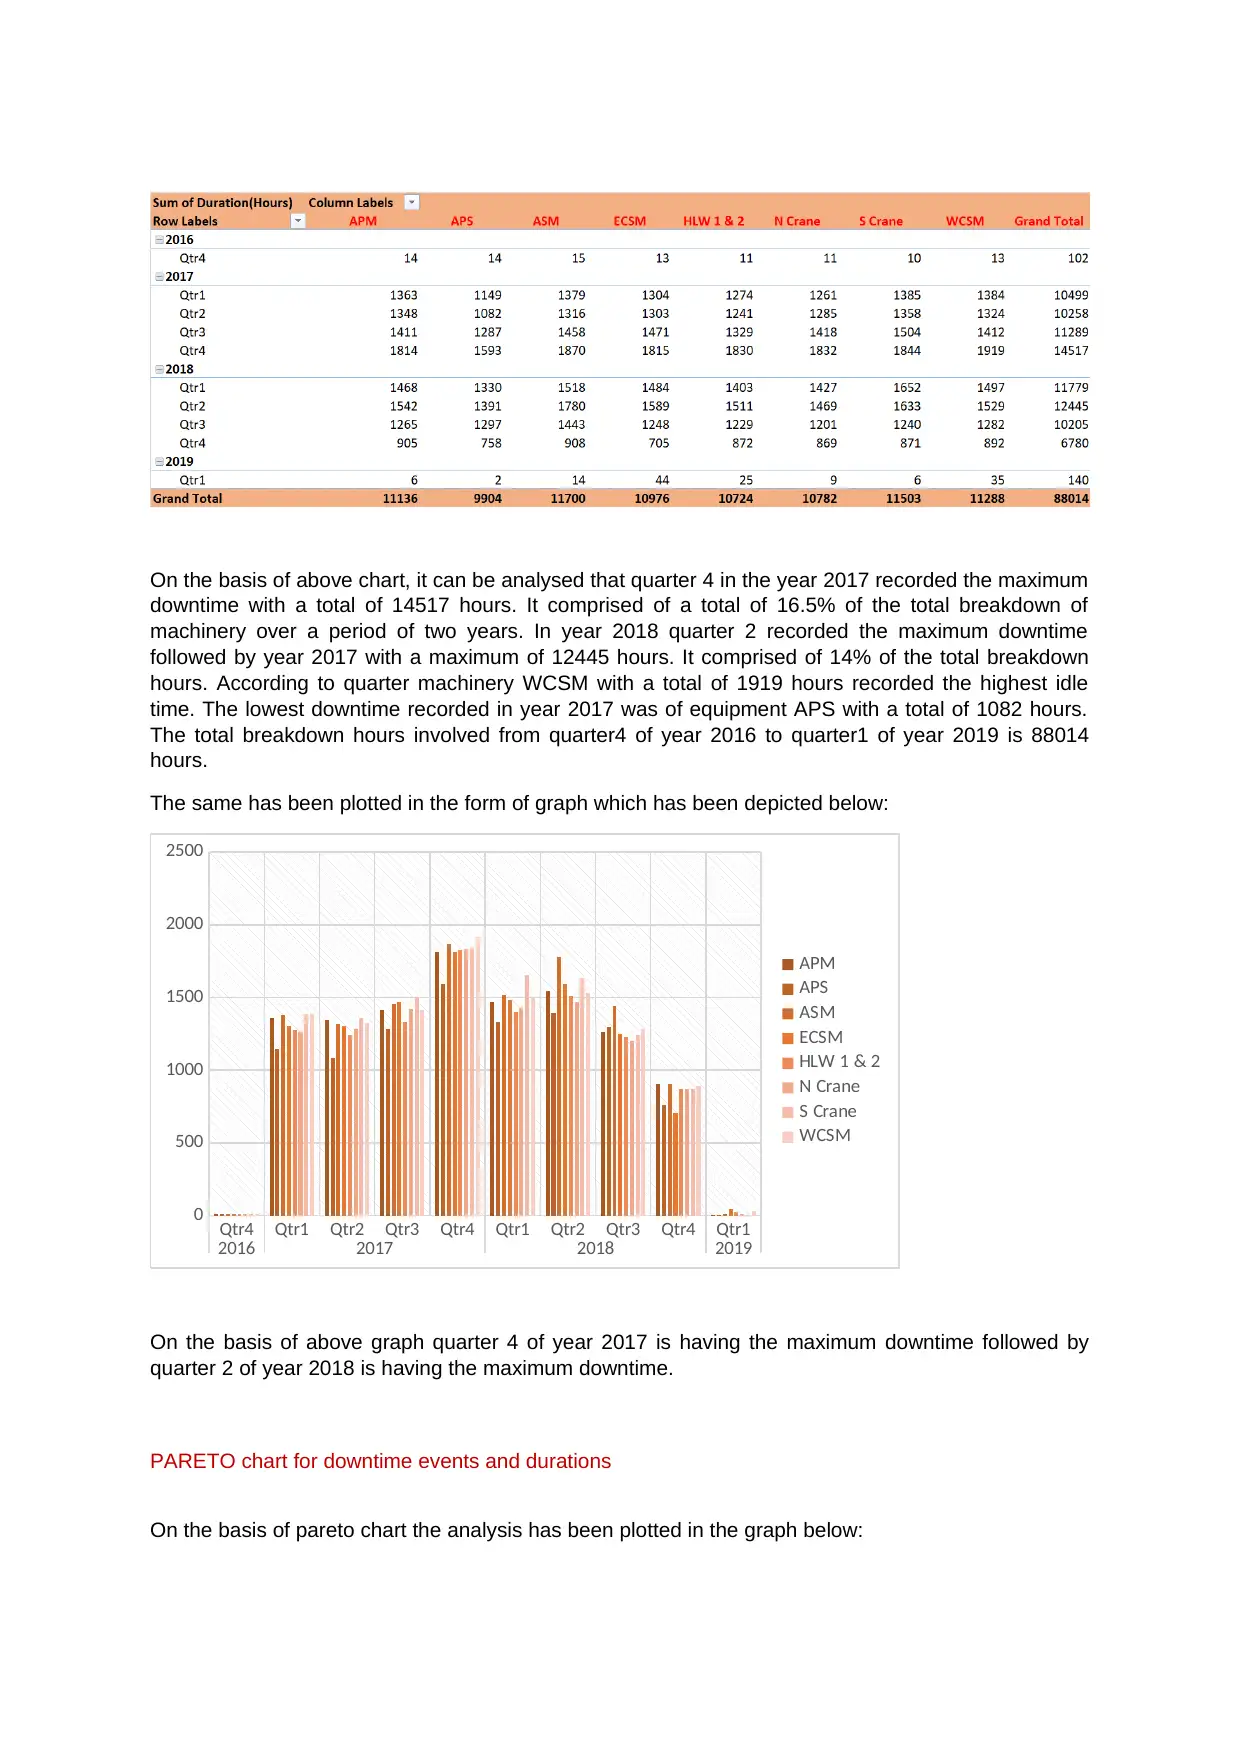
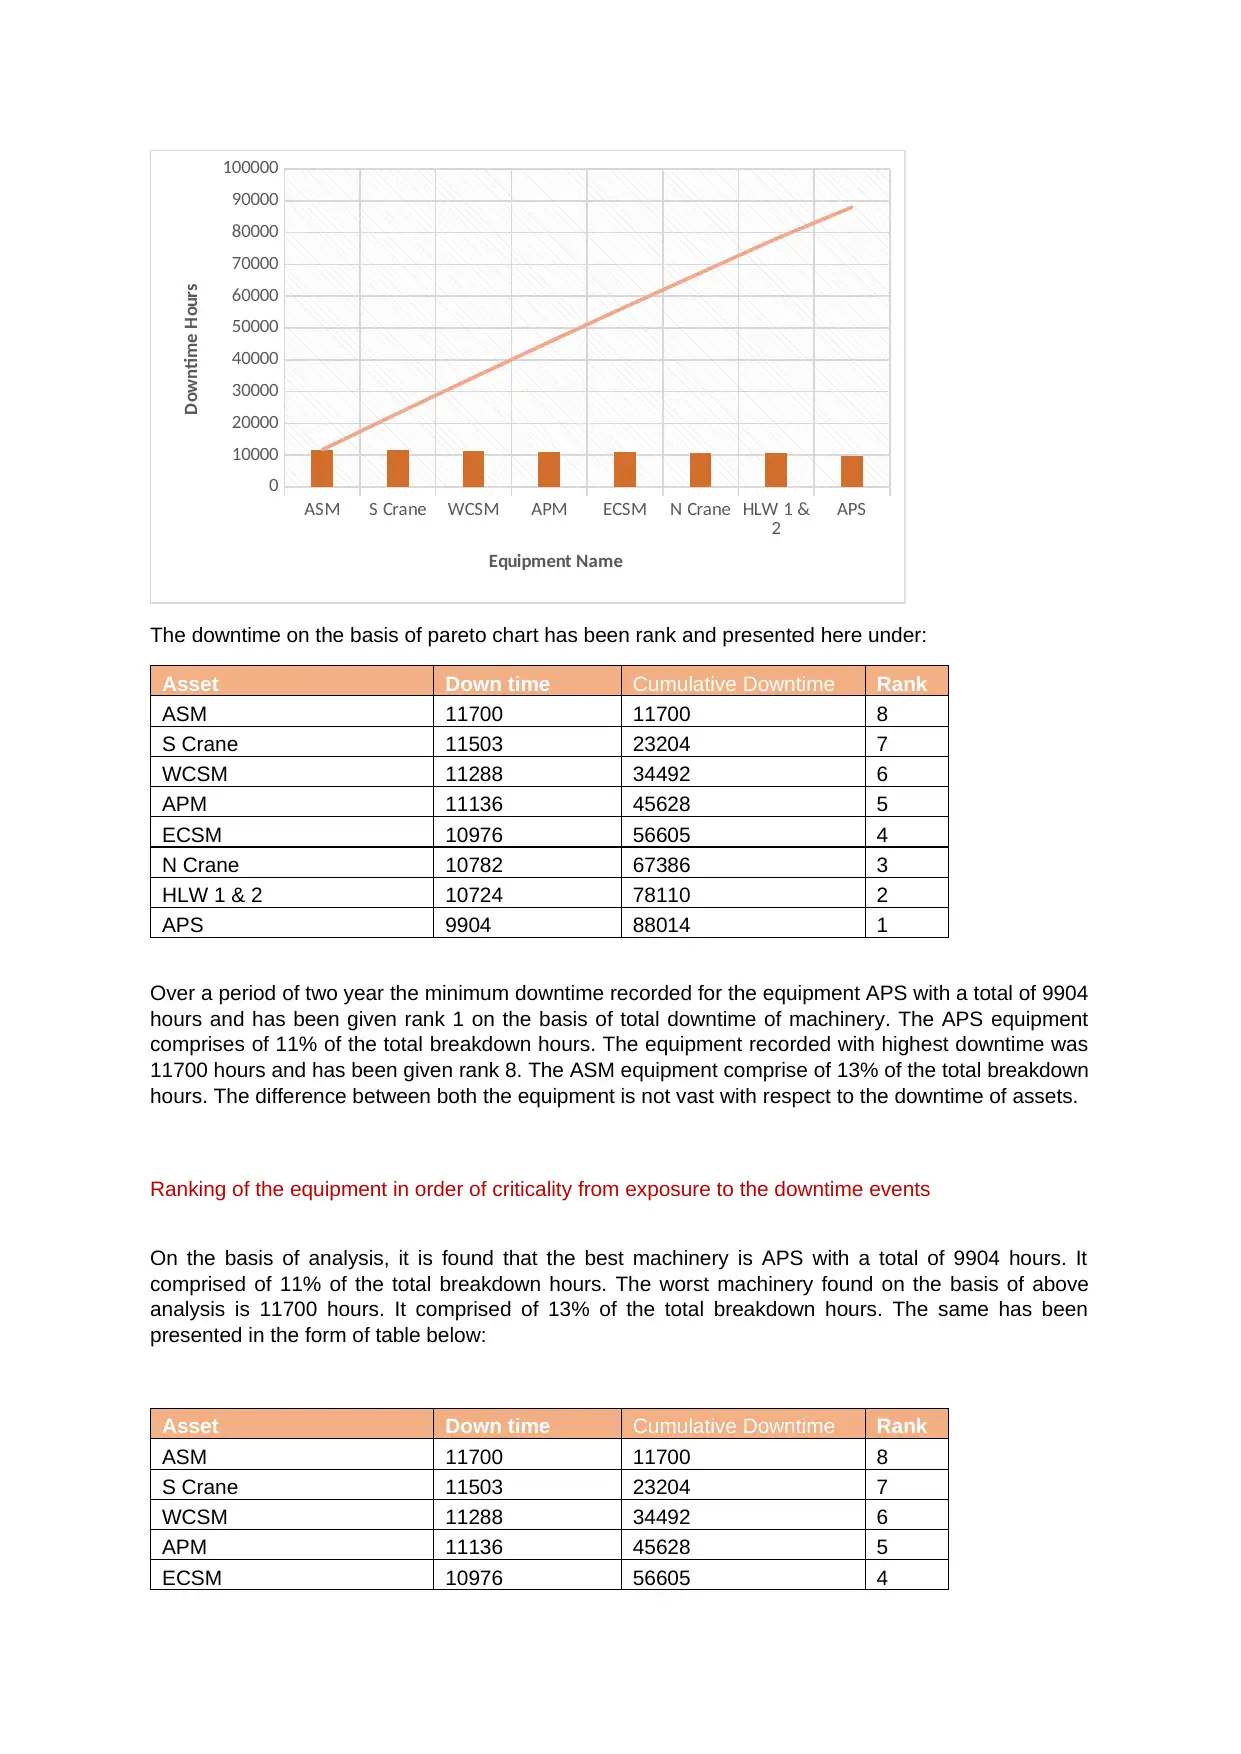
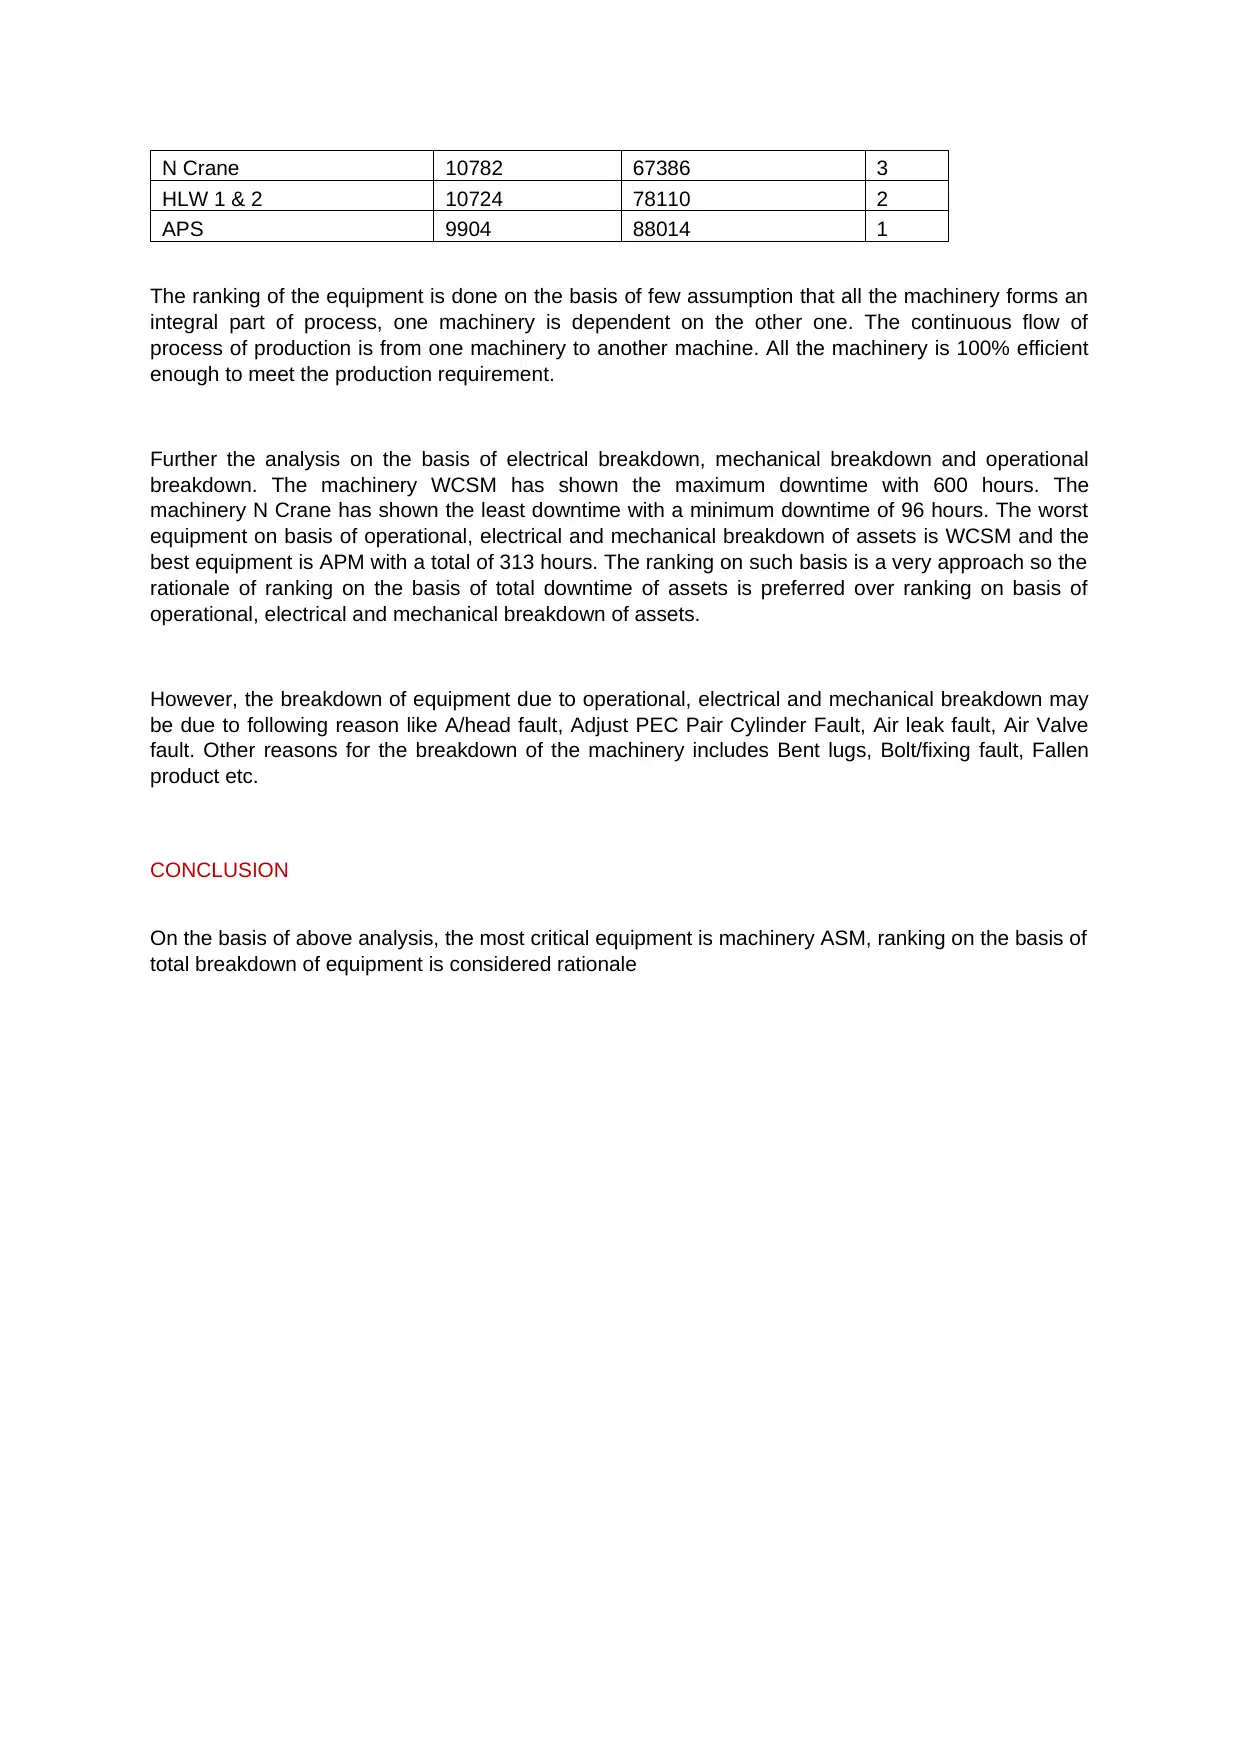
This report presents a detailed analysis of downtime for eight major pieces of machinery in an industrial facility over a two-year period. The analysis includes monthly and quarterly downtime trends, identifying peak downtime periods and the equipment with the highest downtime. A Pareto chart is used to rank downtime events and durations, revealing the most critical equipment. The report further ranks the equipment based on total downtime, justifying the ranking methodology. The most critical equipment is identified, and an in-depth analysis of the causes of downtime is performed, considering electrical, mechanical, and operational breakdowns. The findings are justified, providing a rationale for the ranking based on total downtime of assets, and potential causes for equipment breakdowns are discussed. The report concludes with a summary of the key findings and highlights the most critical equipment based on the analysis.

Overview
The 8 major machinery namely APM, APS, ECSM, HLW 1& 2, ASM, N Crane, S Crane, WCSM in an
Industrial Facility for a duration exceeding 2 years is made available. The downtime of individual and
cumulative machinery is computed and, on such basis, the critical equipment is analysed. The
analysis is done on the basis of total downtime of machinery, Pareto chart, on the basis of electrical
breakdown, mechanical breakdown and operational breakdown. The downtime of the machinery is
computed monthly and quarterly basis and the same has been described in chart, tables and bar
graph. The critical equipment is analysed on such basis. The report also analyses the ranking of each
equipment on the basis of downtime and breakdown of equipment. The rationale on the basis of
downtime of equipment is considered appropriate.
Downtime for each equipment on monthly basis over 2 years
The downtime of each machinery on a monthly basis over a period of two years is analysed. On such
basis the machine with the maximum downtime is analysed over a period of two years. The same has
been depicted in the form of chart below:
Dec
Jan
Feb
Mar
Apr
May
Jun
Jul
Aug
Sep
Oct
Nov
Dec
Jan
Feb
Mar
Apr
May
Jun
Jul
Aug
Sep
Oct
Nov
Jan
Feb
20
16 2017 2018 2019
0
200
400
600
800
1000
1200
APM
APS
ASM
ECSM
HLW 1 & 2
N Crane
S Crane
WCSM
On a monthly basis the maximum downtime was seen in the month of December 2017.The equipment
S Crane recorded maximum downtime with a total of 6091 hours in the year 2017, it recorded a 14%
of total downtime followed by in the month of April 2018 the maximum downtime was recorded with
5174 hours. In the month of April 2018 WCSM recorded the maximum downtime with a total of 708
hours.
Downtime for each equipment on quarterly basis over 2 years
The downtime of each machinery on a quarterly basis over a period of two years is analysed. On such
basis the machine with the maximum downtime is analysed over a period of two years. The same has
been depicted in the form of chart below:
Paraphrase This Document
Need a fresh take? Get an instant paraphrase of this document with our AI Paraphraser

On the basis of above chart, it can be analysed that quarter 4 in the year 2017 recorded the maximum
downtime with a total of 14517 hours. It comprised of a total of 16.5% of the total breakdown of
machinery over a period of two years. In year 2018 quarter 2 recorded the maximum downtime
followed by year 2017 with a maximum of 12445 hours. It comprised of 14% of the total breakdown
hours. According to quarter machinery WCSM with a total of 1919 hours recorded the highest idle
time. The lowest downtime recorded in year 2017 was of equipment APS with a total of 1082 hours.
The total breakdown hours involved from quarter4 of year 2016 to quarter1 of year 2019 is 88014
hours.
The same has been plotted in the form of graph which has been depicted below:
Qtr4 Qtr1 Qtr2 Qtr3 Qtr4 Qtr1 Qtr2 Qtr3 Qtr4 Qtr1
2016 2017 2018 2019
0
500
1000
1500
2000
2500
APM
APS
ASM
ECSM
HLW 1 & 2
N Crane
S Crane
WCSM
On the basis of above graph quarter 4 of year 2017 is having the maximum downtime followed by
quarter 2 of year 2018 is having the maximum downtime.
PARETO chart for downtime events and durations
On the basis of pareto chart the analysis has been plotted in the graph below:

ASM S Crane WCSM APM ECSM N Crane HLW 1 &
2 APS
0
10000
20000
30000
40000
50000
60000
70000
80000
90000
100000
Equipment Name
Downtime Hours
The downtime on the basis of pareto chart has been rank and presented here under:
Asset Down time Cumulative Downtime Rank
ASM 11700 11700 8
S Crane 11503 23204 7
WCSM 11288 34492 6
APM 11136 45628 5
ECSM 10976 56605 4
N Crane 10782 67386 3
HLW 1 & 2 10724 78110 2
APS 9904 88014 1
Over a period of two year the minimum downtime recorded for the equipment APS with a total of 9904
hours and has been given rank 1 on the basis of total downtime of machinery. The APS equipment
comprises of 11% of the total breakdown hours. The equipment recorded with highest downtime was
11700 hours and has been given rank 8. The ASM equipment comprise of 13% of the total breakdown
hours. The difference between both the equipment is not vast with respect to the downtime of assets.
Ranking of the equipment in order of criticality from exposure to the downtime events
On the basis of analysis, it is found that the best machinery is APS with a total of 9904 hours. It
comprised of 11% of the total breakdown hours. The worst machinery found on the basis of above
analysis is 11700 hours. It comprised of 13% of the total breakdown hours. The same has been
presented in the form of table below:
Asset Down time Cumulative Downtime Rank
ASM 11700 11700 8
S Crane 11503 23204 7
WCSM 11288 34492 6
APM 11136 45628 5
ECSM 10976 56605 4
⊘ This is a preview!⊘
Do you want full access?
Subscribe today to unlock all pages.

Trusted by 1+ million students worldwide

N Crane 10782 67386 3
HLW 1 & 2 10724 78110 2
APS 9904 88014 1
The ranking of the equipment is done on the basis of few assumption that all the machinery forms an
integral part of process, one machinery is dependent on the other one. The continuous flow of
process of production is from one machinery to another machine. All the machinery is 100% efficient
enough to meet the production requirement.
Further the analysis on the basis of electrical breakdown, mechanical breakdown and operational
breakdown. The machinery WCSM has shown the maximum downtime with 600 hours. The
machinery N Crane has shown the least downtime with a minimum downtime of 96 hours. The worst
equipment on basis of operational, electrical and mechanical breakdown of assets is WCSM and the
best equipment is APM with a total of 313 hours. The ranking on such basis is a very approach so the
rationale of ranking on the basis of total downtime of assets is preferred over ranking on basis of
operational, electrical and mechanical breakdown of assets.
However, the breakdown of equipment due to operational, electrical and mechanical breakdown may
be due to following reason like A/head fault, Adjust PEC Pair Cylinder Fault, Air leak fault, Air Valve
fault. Other reasons for the breakdown of the machinery includes Bent lugs, Bolt/fixing fault, Fallen
product etc.
CONCLUSION
On the basis of above analysis, the most critical equipment is machinery ASM, ranking on the basis of
total breakdown of equipment is considered rationale
1 out of 4
Related Documents
Your All-in-One AI-Powered Toolkit for Academic Success.
 +13062052269
info@desklib.com
Available 24*7 on WhatsApp / Email
Unlock your academic potential
Copyright © 2020–2025 A2Z Services. All Rights Reserved. Developed and managed by ZUCOL.


