Equity Analysis Report on Five Companies from USA IT Industry
VerifiedAdded on 2022/07/07
|20
|4358
|34
Report
AI Summary
This equity analysis report examines five companies within the US Information Technology (IT) industry, evaluating their financial performance and investment potential. The report begins with an industry overview, detailing market size, key competitors, competitive dynamics, and emerging trends such as Artificial Intelligence and Machine Learning. It then provides background information on each of the five selected companies: Microsoft, Oracle, Symantec, Electronic Arts, and Intel. The core of the analysis involves a detailed ratio analysis spanning several years (2014-2018), covering liquidity, leverage, and profitability metrics. The report also incorporates a security analysis, assessing factors affecting security prices and estimating expected returns and standard deviations. The study highlights specific findings and offers investment recommendations based on the comprehensive analysis of the financial data and industry trends. The report also acknowledges limitations such as the reliance on past data and the potential for overlooked factors influencing company performance.
1.Introduction
Equity analysis refers the process of analyzing sectors and companies, to give advice to professional fund
managers and private clients on which shares to buy. This report is an equity analysis report where five
companies form a same industry has been selected for the analysis. At the initial part we have been
showed the details of the industry providing industry’s size, major competitor, extent of competition, key
trends in the industry. On this report we made a portfolio of this five-company providing different weight
to each company. Here we made ratio analysis of the companies and then made security analysis of these
companies of the last 10 years, where we determined expected return, standard deviation and factor that
will affect the security price. After analysis the all the securities special findings have been made
providing special recommendation.
1.1Background of the study:
We have selected five companies of USA from Information Technology (IT) industry. On this part we
will know about company background we have selected for the report:-
Microsoft Corporation: Microsoft Corporation (MSFT) is an American multinational technology
company with headquarters in Redmond, Washington. Microsoft was founded by Bill Gates and Paul
Allen on April 4, 1975 It develops, manufactures, licenses, supports and sells computer software,
consumer electronics, personal computers, and related services. Its best-known software products are the
Microsoft Windows line of operating systems, the Microsoft Office suite, and the Internet Explorer and
Edge web browsers. The word "Microsoft" is a portmanteau of "microcomputer" and "software"
Oracle Corporation: Oracle Corporation (ORCL) is an American multinational computer technology
corporation headquartered in Redwood Shores, California. The company specializes primarily in
developing and marketing database software and technology, cloud engineered systems, and enterprise
software products particularly its own brands of database management systems. In 2018, Oracle was the
third-largest software maker by revenue, after Microsoft and Alphabet. The company also develops and
builds tools for database development and systems of middle-tier software, enterprise resource planning
(ERP) software, customer relationship management (CRM) software, and supply chain management
(SCM) software.
Symantec Corporation: Symantec Corporation (SYMC) is an American software company
headquartered in Mountain View, California, United States. The company provides cybersecurity
software and services. Enterprises across the world rely on Symantec for integrated cyber defense against
sophisticated attacks across endpoints, infrastructure, and cloud. More than 50 million people and
families rely on Symantec’s Norton and LifeLock Digital Safety Platform to help protect their personal
information, devices, home networks, and identities at home and across their devices.
Electronic Arts Inc. (EA): Electronic Arts Inc. (EA) is an American video game company headquartered
in Redwood City, California. Founded and incorporated on May 28, 1982 by Trip Hawkins, the company
was a pioneer of the early home computer games industry and was notable for promoting the designers
and programmers responsible for its games. Electronic Arts is the second-largest gaming company in the
Americas and Europe by revenue and market capitalization after Activision Blizzard and ahead of Take-
Two Interactive, and Ubisoft.
Intel Corporation: Intel Corporation (INTC) is an American multinational corporation and technology
company headquartered in Santa Clara, California, in the Silicon Valley and on 6 Campus Drive,
Parsippany-Troy Hills, New Jersey. It is the world's second largest and second highest valued
1
Paraphrase This Document
Need a fresh take? Get an instant paraphrase of this document with our AI Paraphraser
semiconductor chip maker based on revenue and is the inventor of the x86 series of microprocessors, the
processors found in most personal computers (PCs). Intel supplies processors for computer system
manufacturers such as Apple, Lenovo, HP, and Dell. Intel also manufactures motherboard chipsets,
network interface controllers and integrated circuits, flash memory, graphics chips, embedded processors
and other devices related to communications and computing.
1.2 Objective of the study:
In the fulfillment of any work there have to have a goal/objective, this is expected to attain at the end of
any work. This study also has some objectives for the competition of this report. Objectives are given
below:
To know the process of equity analysis
To know calculation process of equity analysis
To know about the various tools used to do equity analysis
To know about the factors which affect price of securities.
To know about how to take investing decisions based on security analysis
To know about the IT industry of USA
1.3 Scope of the study: The study focuses on the equity analysis of five companies from IT
industry of USA. All the analysis have been made focusing USA economic condition. Several economic
information such as risk free rate, SMB rate, HML rate have been collected based on USA economy.
1.4 Limitations of the Study
Limitations that may take place during the preparation of this report are given below:.
As the report has been made depending on the past data, so that may not know show actual
performance of the companies and also the industry.
Though there we selected different factors that could the companies security price,but there may be
some other factor which we missed while doing analysis.
2
2.Analysis
2.1 Description of the industry:
We have selected to study the “Information and Technology” industry in the USA. The United States is
the largest tech market in the world, representing 31% of the global IT industry or approximately 1.5
trillion by 2017, according to the research consultancy IDC.
In USA the IT industry accounts for:
Market Capitalization 5.99 trillion
Total contribution of the industry in GDP (%) 5.87%
Source: www.nasdaq.com, www.selectusa.gov
Major operating firms: Major firms operating in the IT industry are:
Microsoft
Alphabet Inc
Facebook
Verizon communication
Intel
AT & T
Cisco System
Oracle Corporation
NVIDIA
Source: www.fortune.com
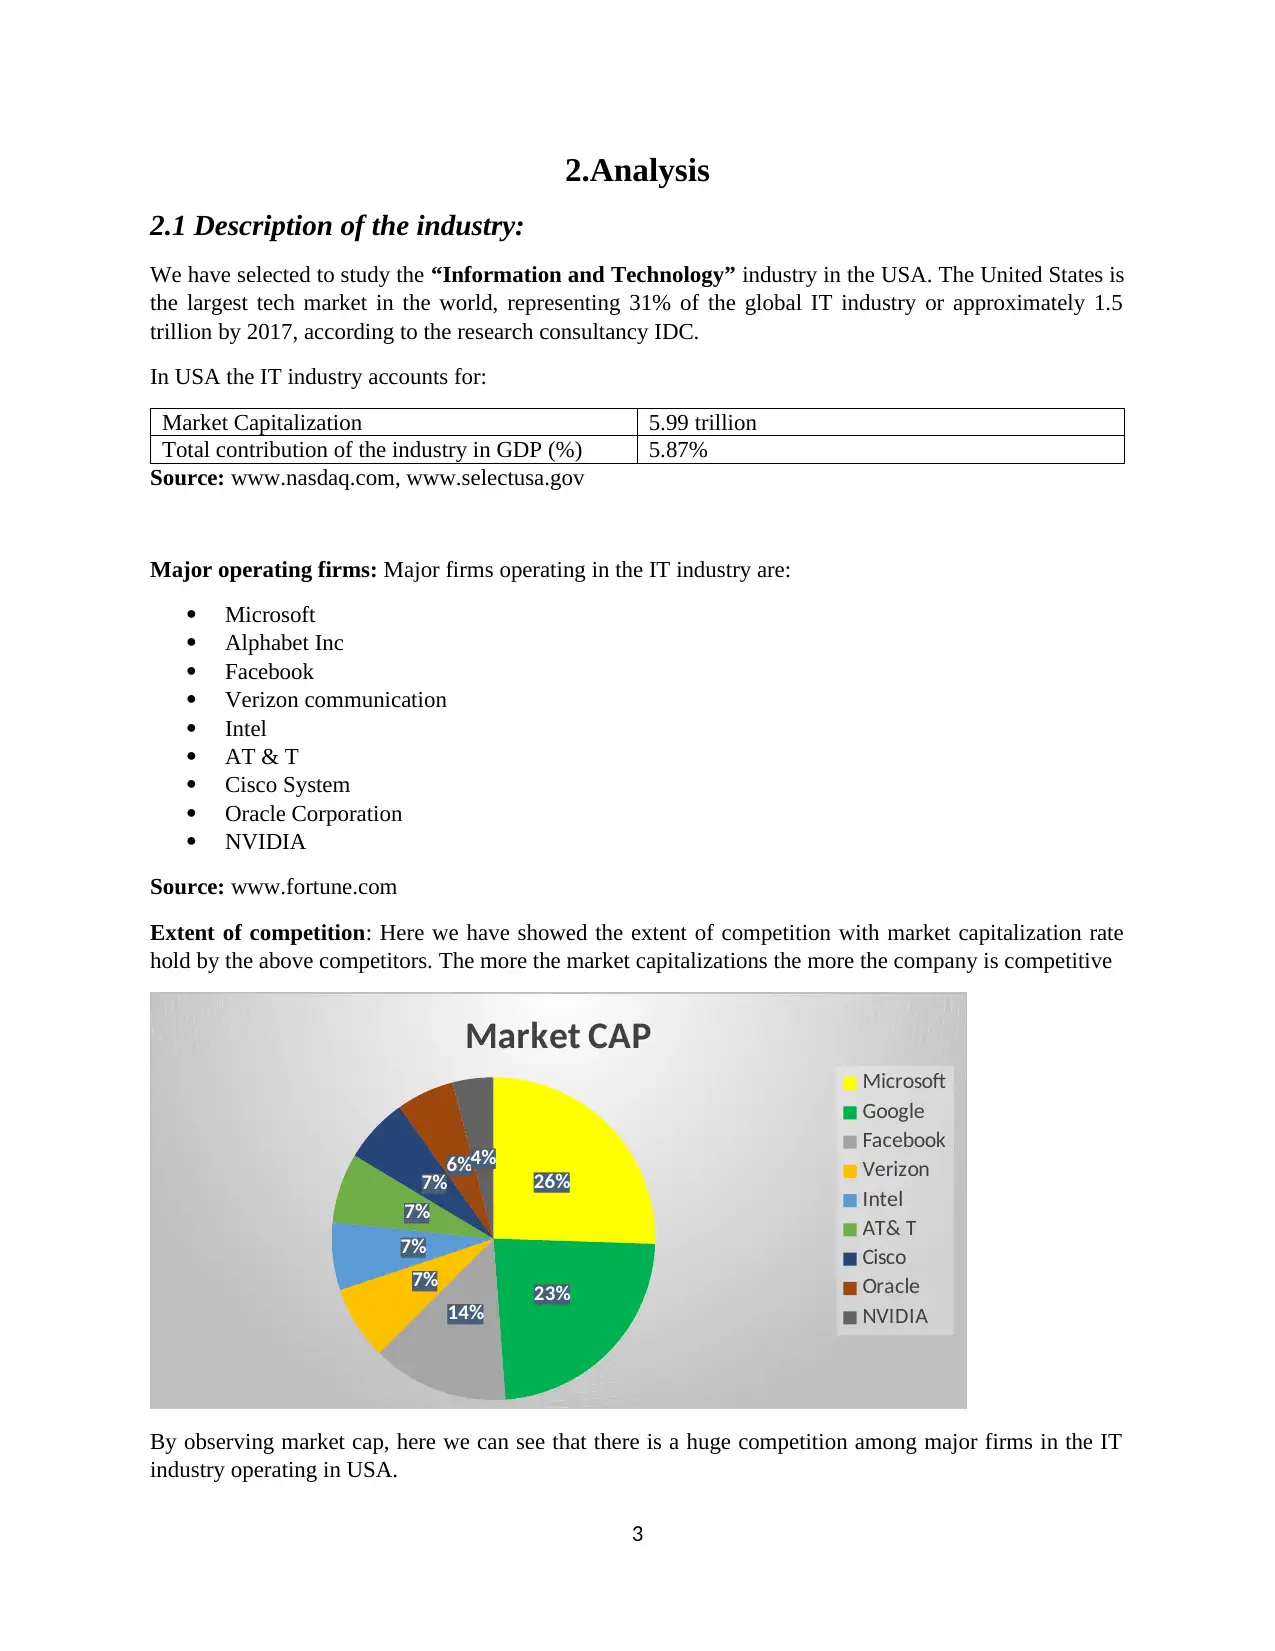
Extent of competition: Here we have showed the extent of competition with market capitalization rate
hold by the above competitors. The more the market capitalizations the more the company is competitive
26%
23%
14%
7%
7%
7%
7%6%4%
Market CAP
Microsoft
Google
Facebook
Verizon
Intel
AT& T
Cisco
Oracle
NVIDIA
By observing market cap, here we can see that there is a huge competition among major firms in the IT
industry operating in USA.
3
2.1 Description of the industry:
We have selected to study the “Information and Technology” industry in the USA. The United States is
the largest tech market in the world, representing 31% of the global IT industry or approximately 1.5
trillion by 2017, according to the research consultancy IDC.
In USA the IT industry accounts for:
Market Capitalization 5.99 trillion
Total contribution of the industry in GDP (%) 5.87%
Source: www.nasdaq.com, www.selectusa.gov
Major operating firms: Major firms operating in the IT industry are:
Microsoft
Alphabet Inc
Verizon communication
Intel
AT & T
Cisco System
Oracle Corporation
NVIDIA
Source: www.fortune.com
Extent of competition: Here we have showed the extent of competition with market capitalization rate
hold by the above competitors. The more the market capitalizations the more the company is competitive
26%
23%
14%
7%
7%
7%
7%6%4%
Market CAP
Microsoft
Verizon
Intel
AT& T
Cisco
Oracle
NVIDIA
By observing market cap, here we can see that there is a huge competition among major firms in the IT
industry operating in USA.
3
⊘ This is a preview!⊘
Do you want full access?
Subscribe today to unlock all pages.
Trusted by 1+ million students worldwide
Current Trend in the industry: The current trends in the IT industry are:
1. Artificial Intelligence and Advanced Machine Learning
2. Intelligent Apps
3. Intelligent Things
4. Virtual Reality and Augmented Reality
5. Digital Twins
Source: www.quora.com
Relevant macroeconomics and political variables that can affect the IT industry are:
1. Political Factors:
Political stability in the majority of markets
Increasing tariffs on selected Chinese goods
Overhauling of work visa by Trump administration
Increasing international trade agreements
2. Macroeconomics Factors:
High growth of developing countries
Economic stability of development countries
Currency volatility
Maturity of the industry: 1945-present (Source: www.forbes.com)
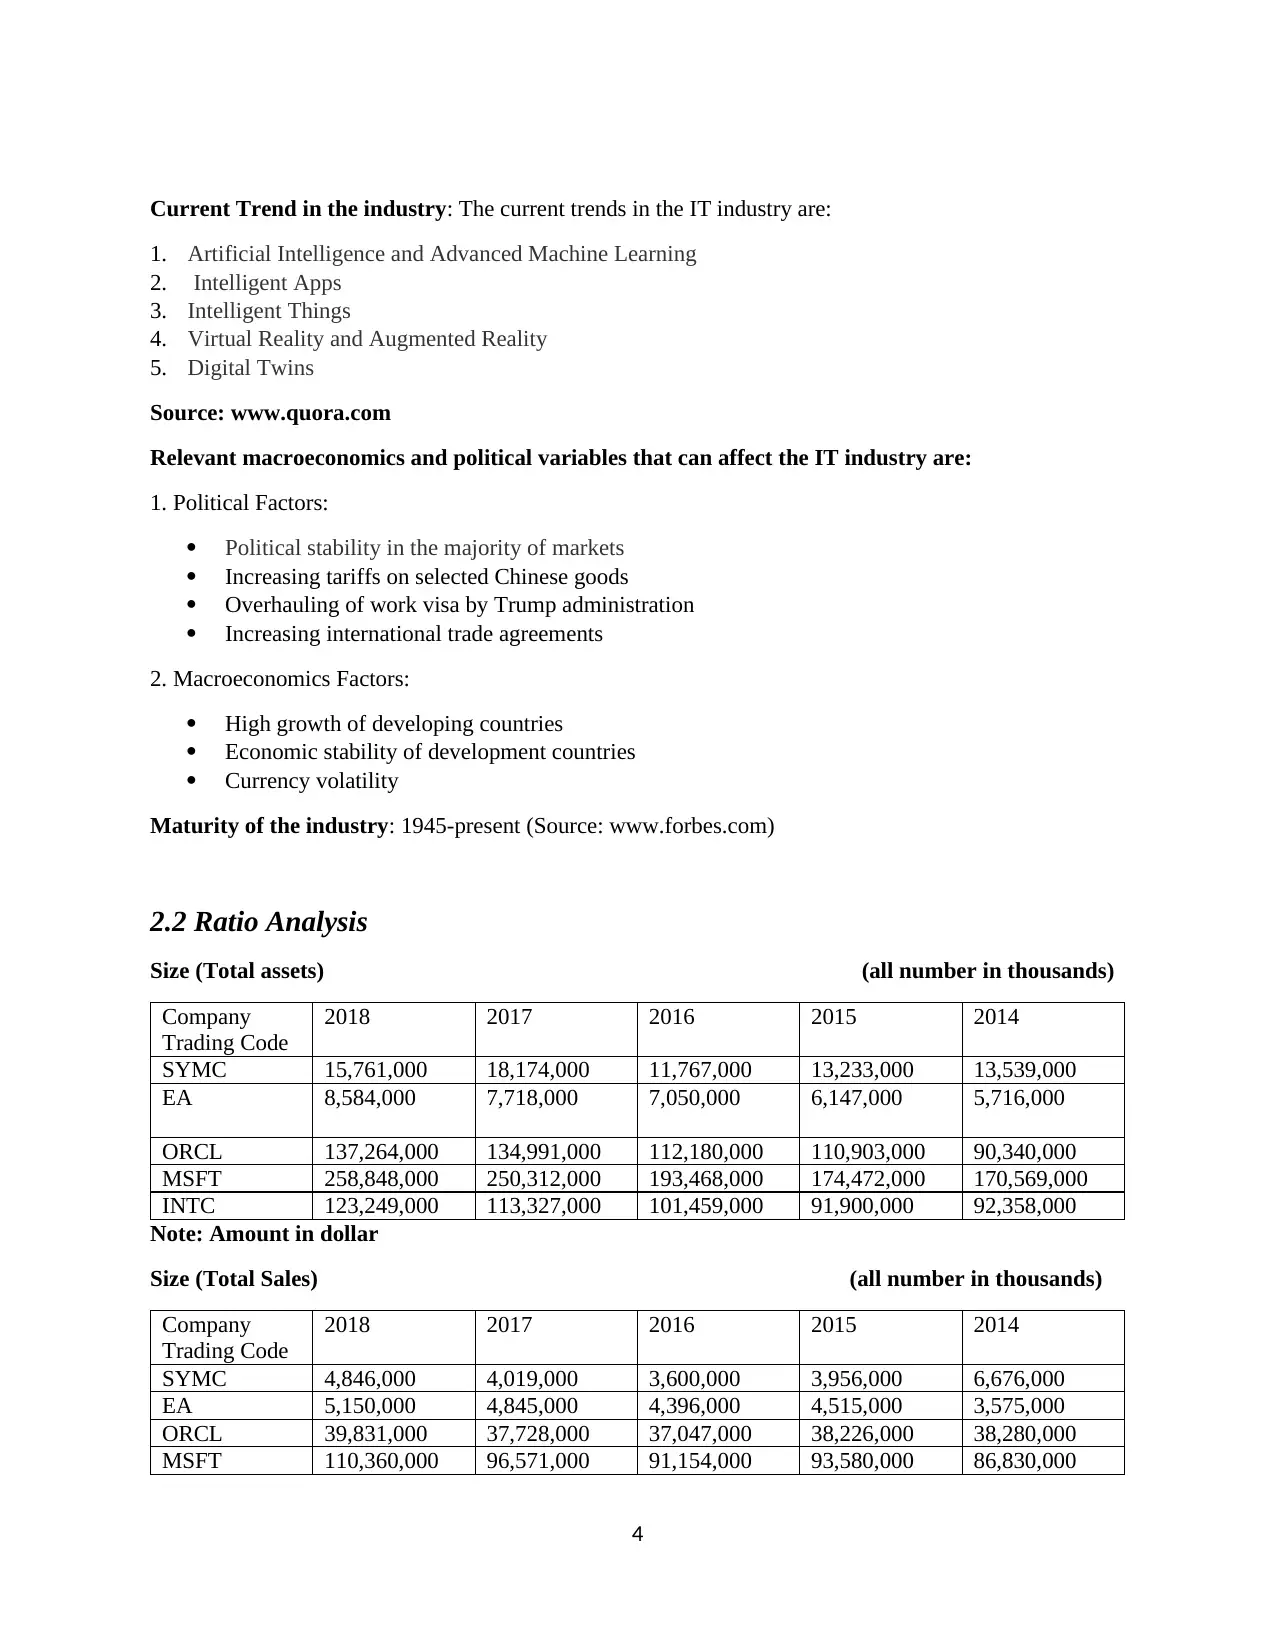
2.2 Ratio Analysis
Size (Total assets) (all number in thousands)
Company
Trading Code
2018 2017 2016 2015 2014
SYMC 15,761,000 18,174,000 11,767,000 13,233,000 13,539,000
EA 8,584,000 7,718,000 7,050,000 6,147,000 5,716,000
ORCL 137,264,000 134,991,000 112,180,000 110,903,000 90,340,000
MSFT 258,848,000 250,312,000 193,468,000 174,472,000 170,569,000
INTC 123,249,000 113,327,000 101,459,000 91,900,000 92,358,000
Note: Amount in dollar
Size (Total Sales) (all number in thousands)
Company
Trading Code
2018 2017 2016 2015 2014
SYMC 4,846,000 4,019,000 3,600,000 3,956,000 6,676,000
EA 5,150,000 4,845,000 4,396,000 4,515,000 3,575,000
ORCL 39,831,000 37,728,000 37,047,000 38,226,000 38,280,000
MSFT 110,360,000 96,571,000 91,154,000 93,580,000 86,830,000
4
1. Artificial Intelligence and Advanced Machine Learning
2. Intelligent Apps
3. Intelligent Things
4. Virtual Reality and Augmented Reality
5. Digital Twins
Source: www.quora.com
Relevant macroeconomics and political variables that can affect the IT industry are:
1. Political Factors:
Political stability in the majority of markets
Increasing tariffs on selected Chinese goods
Overhauling of work visa by Trump administration
Increasing international trade agreements
2. Macroeconomics Factors:
High growth of developing countries
Economic stability of development countries
Currency volatility
Maturity of the industry: 1945-present (Source: www.forbes.com)
2.2 Ratio Analysis
Size (Total assets) (all number in thousands)
Company
Trading Code
2018 2017 2016 2015 2014
SYMC 15,761,000 18,174,000 11,767,000 13,233,000 13,539,000
EA 8,584,000 7,718,000 7,050,000 6,147,000 5,716,000
ORCL 137,264,000 134,991,000 112,180,000 110,903,000 90,340,000
MSFT 258,848,000 250,312,000 193,468,000 174,472,000 170,569,000
INTC 123,249,000 113,327,000 101,459,000 91,900,000 92,358,000
Note: Amount in dollar
Size (Total Sales) (all number in thousands)
Company
Trading Code
2018 2017 2016 2015 2014
SYMC 4,846,000 4,019,000 3,600,000 3,956,000 6,676,000
EA 5,150,000 4,845,000 4,396,000 4,515,000 3,575,000
ORCL 39,831,000 37,728,000 37,047,000 38,226,000 38,280,000
MSFT 110,360,000 96,571,000 91,154,000 93,580,000 86,830,000
4
Paraphrase This Document
Need a fresh take? Get an instant paraphrase of this document with our AI Paraphraser
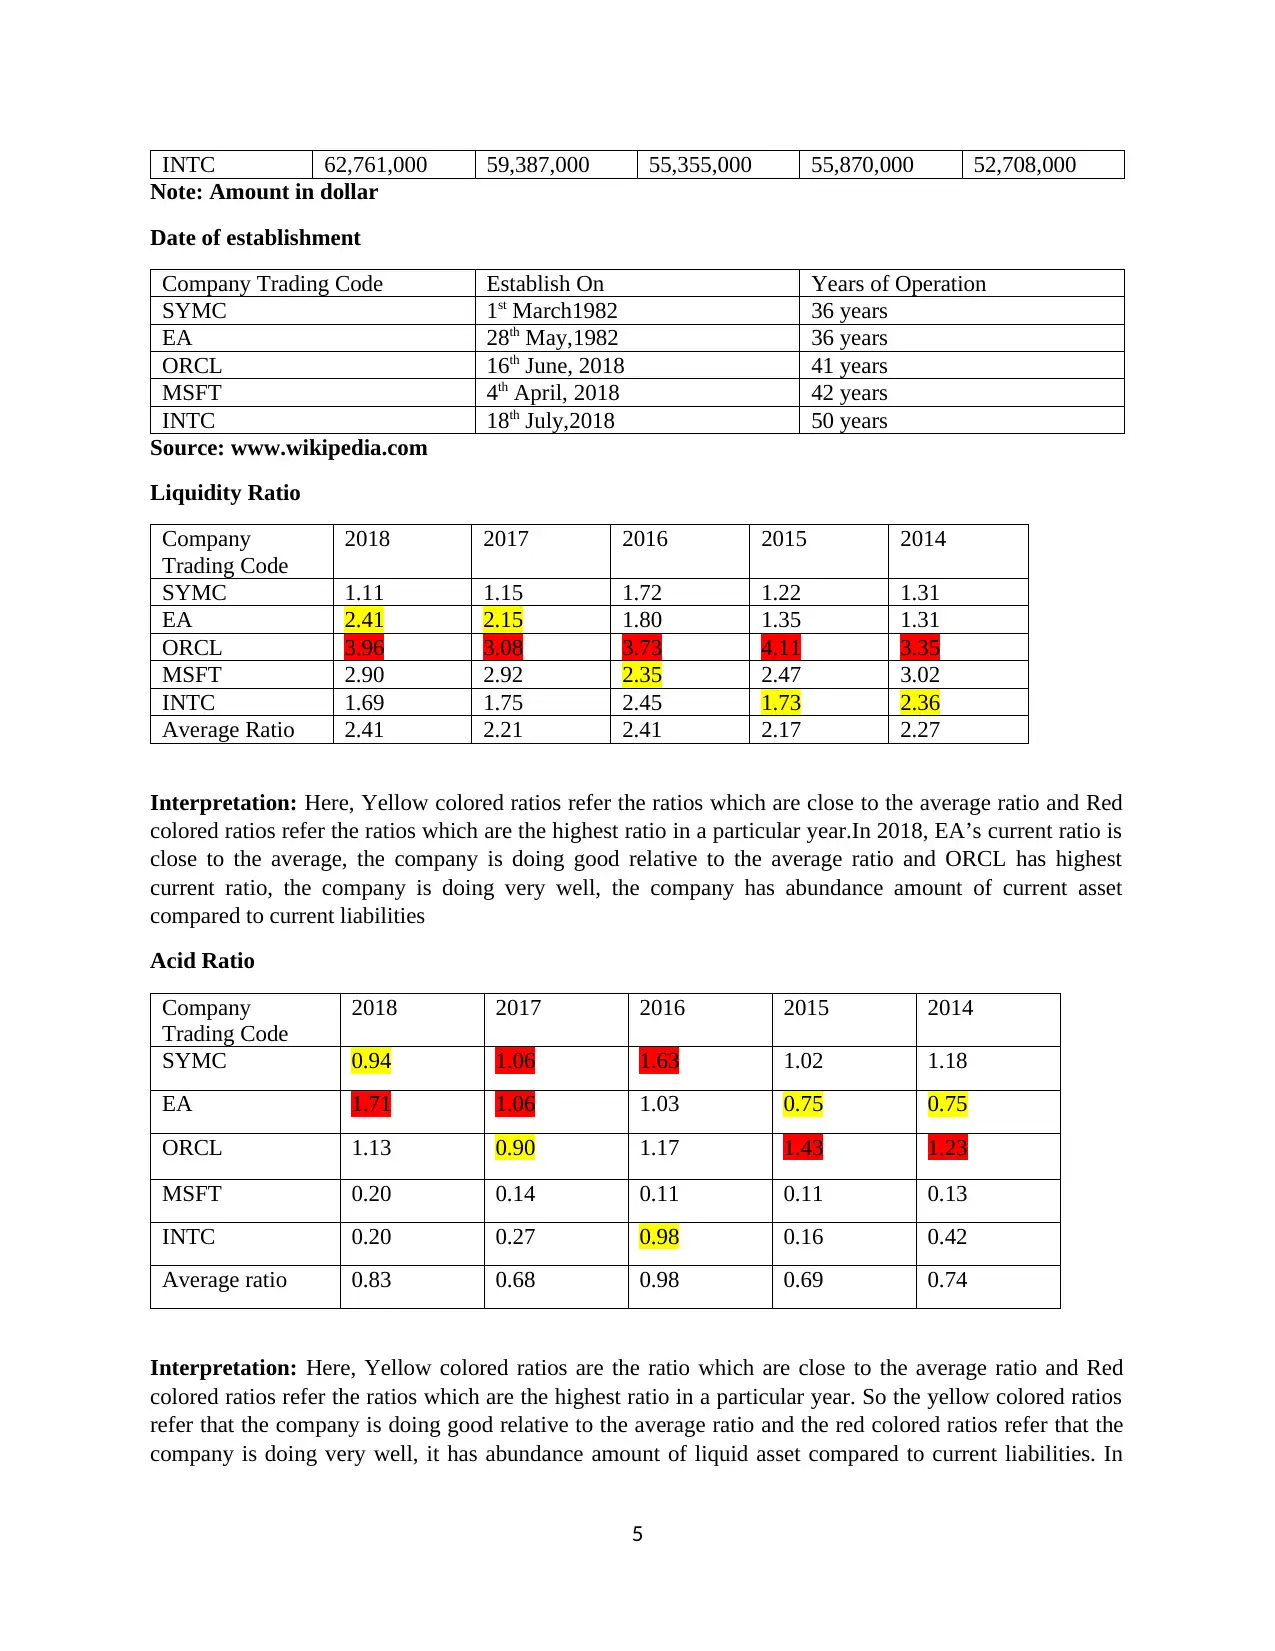
INTC 62,761,000 59,387,000 55,355,000 55,870,000 52,708,000
Note: Amount in dollar
Date of establishment
Company Trading Code Establish On Years of Operation
SYMC 1st March1982 36 years
EA 28th May,1982 36 years
ORCL 16th June, 2018 41 years
MSFT 4th April, 2018 42 years
INTC 18th July,2018 50 years
Source: www.wikipedia.com
Liquidity Ratio
Company
Trading Code
2018 2017 2016 2015 2014
SYMC 1.11 1.15 1.72 1.22 1.31
EA 2.41 2.15 1.80 1.35 1.31
ORCL 3.96 3.08 3.73 4.11 3.35
MSFT 2.90 2.92 2.35 2.47 3.02
INTC 1.69 1.75 2.45 1.73 2.36
Average Ratio 2.41 2.21 2.41 2.17 2.27
Interpretation: Here, Yellow colored ratios refer the ratios which are close to the average ratio and Red
colored ratios refer the ratios which are the highest ratio in a particular year.In 2018, EA’s current ratio is
close to the average, the company is doing good relative to the average ratio and ORCL has highest
current ratio, the company is doing very well, the company has abundance amount of current asset
compared to current liabilities
Acid Ratio
Company
Trading Code
2018 2017 2016 2015 2014
SYMC 0.94 1.06 1.63 1.02 1.18
EA 1.71 1.06 1.03 0.75 0.75
ORCL 1.13 0.90 1.17 1.43 1.23
MSFT 0.20 0.14 0.11 0.11 0.13
INTC 0.20 0.27 0.98 0.16 0.42
Average ratio 0.83 0.68 0.98 0.69 0.74
Interpretation: Here, Yellow colored ratios are the ratio which are close to the average ratio and Red
colored ratios refer the ratios which are the highest ratio in a particular year. So the yellow colored ratios
refer that the company is doing good relative to the average ratio and the red colored ratios refer that the
company is doing very well, it has abundance amount of liquid asset compared to current liabilities. In
5
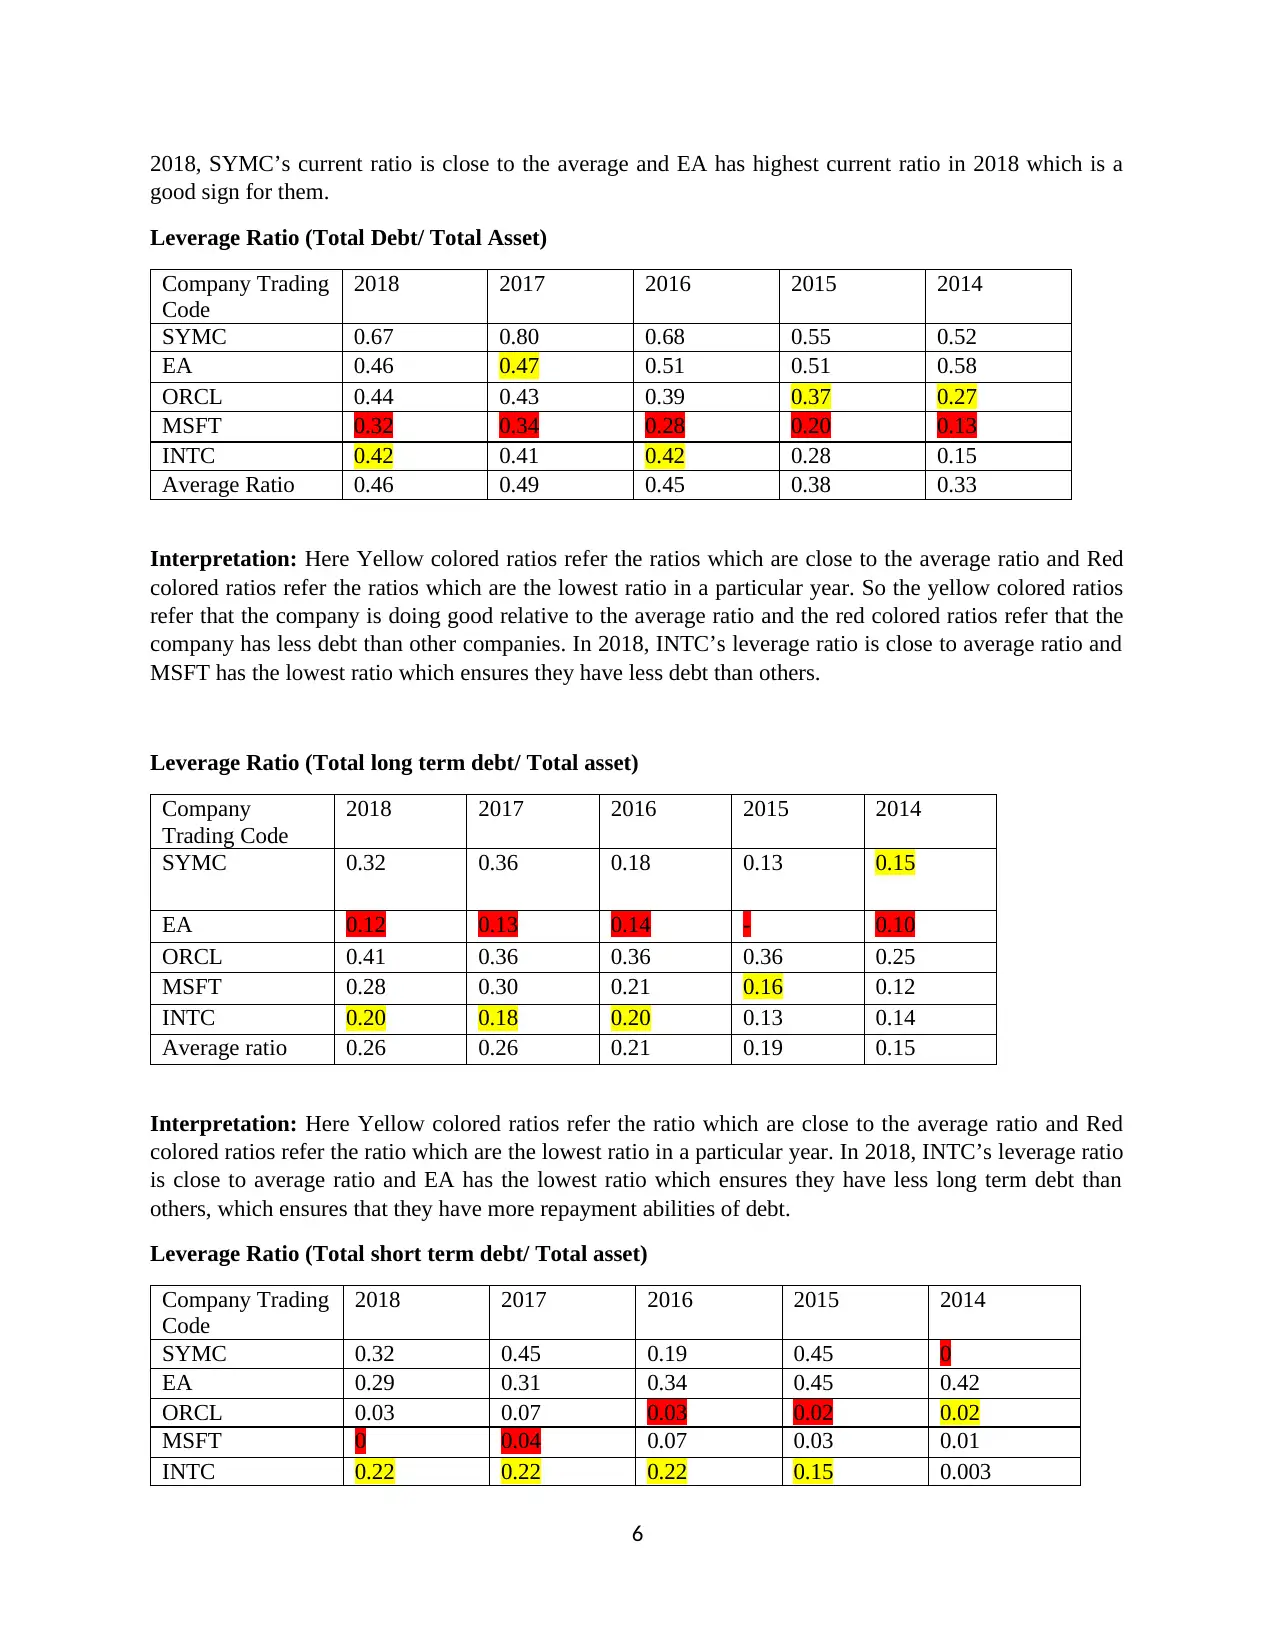
2018, SYMC’s current ratio is close to the average and EA has highest current ratio in 2018 which is a
good sign for them.
Leverage Ratio (Total Debt/ Total Asset)
Company Trading
Code
2018 2017 2016 2015 2014
SYMC 0.67 0.80 0.68 0.55 0.52
EA 0.46 0.47 0.51 0.51 0.58
ORCL 0.44 0.43 0.39 0.37 0.27
MSFT 0.32 0.34 0.28 0.20 0.13
INTC 0.42 0.41 0.42 0.28 0.15
Average Ratio 0.46 0.49 0.45 0.38 0.33
Interpretation: Here Yellow colored ratios refer the ratios which are close to the average ratio and Red
colored ratios refer the ratios which are the lowest ratio in a particular year. So the yellow colored ratios
refer that the company is doing good relative to the average ratio and the red colored ratios refer that the
company has less debt than other companies. In 2018, INTC’s leverage ratio is close to average ratio and
MSFT has the lowest ratio which ensures they have less debt than others.
Leverage Ratio (Total long term debt/ Total asset)
Company
Trading Code
2018 2017 2016 2015 2014
SYMC 0.32 0.36 0.18 0.13 0.15
EA 0.12 0.13 0.14 - 0.10
ORCL 0.41 0.36 0.36 0.36 0.25
MSFT 0.28 0.30 0.21 0.16 0.12
INTC 0.20 0.18 0.20 0.13 0.14
Average ratio 0.26 0.26 0.21 0.19 0.15
Interpretation: Here Yellow colored ratios refer the ratio which are close to the average ratio and Red
colored ratios refer the ratio which are the lowest ratio in a particular year. In 2018, INTC’s leverage ratio
is close to average ratio and EA has the lowest ratio which ensures they have less long term debt than
others, which ensures that they have more repayment abilities of debt.
Leverage Ratio (Total short term debt/ Total asset)
Company Trading
Code
2018 2017 2016 2015 2014
SYMC 0.32 0.45 0.19 0.45 0
EA 0.29 0.31 0.34 0.45 0.42
ORCL 0.03 0.07 0.03 0.02 0.02
MSFT 0 0.04 0.07 0.03 0.01
INTC 0.22 0.22 0.22 0.15 0.003
6
⊘ This is a preview!⊘
Do you want full access?
Subscribe today to unlock all pages.
Trusted by 1+ million students worldwide
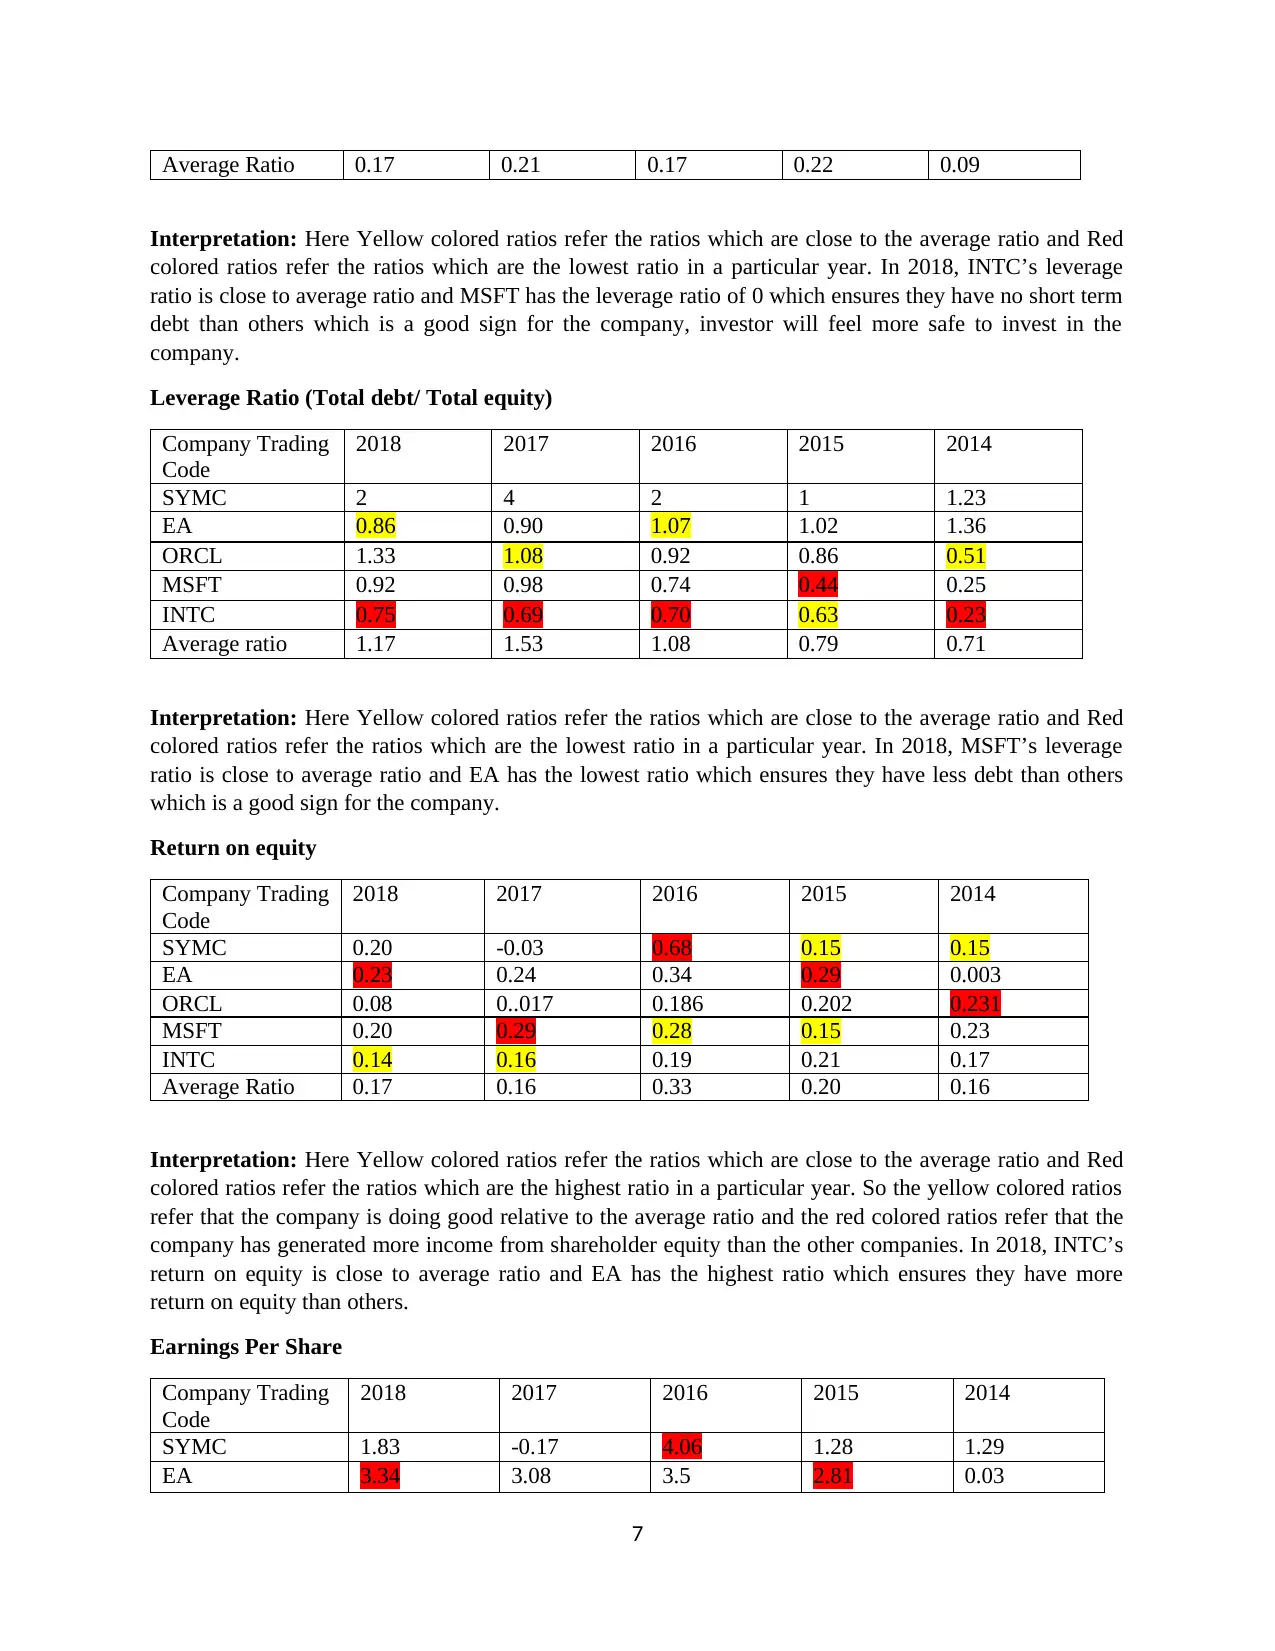
Average Ratio 0.17 0.21 0.17 0.22 0.09
Interpretation: Here Yellow colored ratios refer the ratios which are close to the average ratio and Red
colored ratios refer the ratios which are the lowest ratio in a particular year. In 2018, INTC’s leverage
ratio is close to average ratio and MSFT has the leverage ratio of 0 which ensures they have no short term
debt than others which is a good sign for the company, investor will feel more safe to invest in the
company.
Leverage Ratio (Total debt/ Total equity)
Company Trading
Code
2018 2017 2016 2015 2014
SYMC 2 4 2 1 1.23
EA 0.86 0.90 1.07 1.02 1.36
ORCL 1.33 1.08 0.92 0.86 0.51
MSFT 0.92 0.98 0.74 0.44 0.25
INTC 0.75 0.69 0.70 0.63 0.23
Average ratio 1.17 1.53 1.08 0.79 0.71
Interpretation: Here Yellow colored ratios refer the ratios which are close to the average ratio and Red
colored ratios refer the ratios which are the lowest ratio in a particular year. In 2018, MSFT’s leverage
ratio is close to average ratio and EA has the lowest ratio which ensures they have less debt than others
which is a good sign for the company.
Return on equity
Company Trading
Code
2018 2017 2016 2015 2014
SYMC 0.20 -0.03 0.68 0.15 0.15
EA 0.23 0.24 0.34 0.29 0.003
ORCL 0.08 0..017 0.186 0.202 0.231
MSFT 0.20 0.29 0.28 0.15 0.23
INTC 0.14 0.16 0.19 0.21 0.17
Average Ratio 0.17 0.16 0.33 0.20 0.16
Interpretation: Here Yellow colored ratios refer the ratios which are close to the average ratio and Red
colored ratios refer the ratios which are the highest ratio in a particular year. So the yellow colored ratios
refer that the company is doing good relative to the average ratio and the red colored ratios refer that the
company has generated more income from shareholder equity than the other companies. In 2018, INTC’s
return on equity is close to average ratio and EA has the highest ratio which ensures they have more
return on equity than others.
Earnings Per Share
Company Trading
Code
2018 2017 2016 2015 2014
SYMC 1.83 -0.17 4.06 1.28 1.29
EA 3.34 3.08 3.5 2.81 0.03
7
Interpretation: Here Yellow colored ratios refer the ratios which are close to the average ratio and Red
colored ratios refer the ratios which are the lowest ratio in a particular year. In 2018, INTC’s leverage
ratio is close to average ratio and MSFT has the leverage ratio of 0 which ensures they have no short term
debt than others which is a good sign for the company, investor will feel more safe to invest in the
company.
Leverage Ratio (Total debt/ Total equity)
Company Trading
Code
2018 2017 2016 2015 2014
SYMC 2 4 2 1 1.23
EA 0.86 0.90 1.07 1.02 1.36
ORCL 1.33 1.08 0.92 0.86 0.51
MSFT 0.92 0.98 0.74 0.44 0.25
INTC 0.75 0.69 0.70 0.63 0.23
Average ratio 1.17 1.53 1.08 0.79 0.71
Interpretation: Here Yellow colored ratios refer the ratios which are close to the average ratio and Red
colored ratios refer the ratios which are the lowest ratio in a particular year. In 2018, MSFT’s leverage
ratio is close to average ratio and EA has the lowest ratio which ensures they have less debt than others
which is a good sign for the company.
Return on equity
Company Trading
Code
2018 2017 2016 2015 2014
SYMC 0.20 -0.03 0.68 0.15 0.15
EA 0.23 0.24 0.34 0.29 0.003
ORCL 0.08 0..017 0.186 0.202 0.231
MSFT 0.20 0.29 0.28 0.15 0.23
INTC 0.14 0.16 0.19 0.21 0.17
Average Ratio 0.17 0.16 0.33 0.20 0.16
Interpretation: Here Yellow colored ratios refer the ratios which are close to the average ratio and Red
colored ratios refer the ratios which are the highest ratio in a particular year. So the yellow colored ratios
refer that the company is doing good relative to the average ratio and the red colored ratios refer that the
company has generated more income from shareholder equity than the other companies. In 2018, INTC’s
return on equity is close to average ratio and EA has the highest ratio which ensures they have more
return on equity than others.
Earnings Per Share
Company Trading
Code
2018 2017 2016 2015 2014
SYMC 1.83 -0.17 4.06 1.28 1.29
EA 3.34 3.08 3.5 2.81 0.03
7
Paraphrase This Document
Need a fresh take? Get an instant paraphrase of this document with our AI Paraphraser
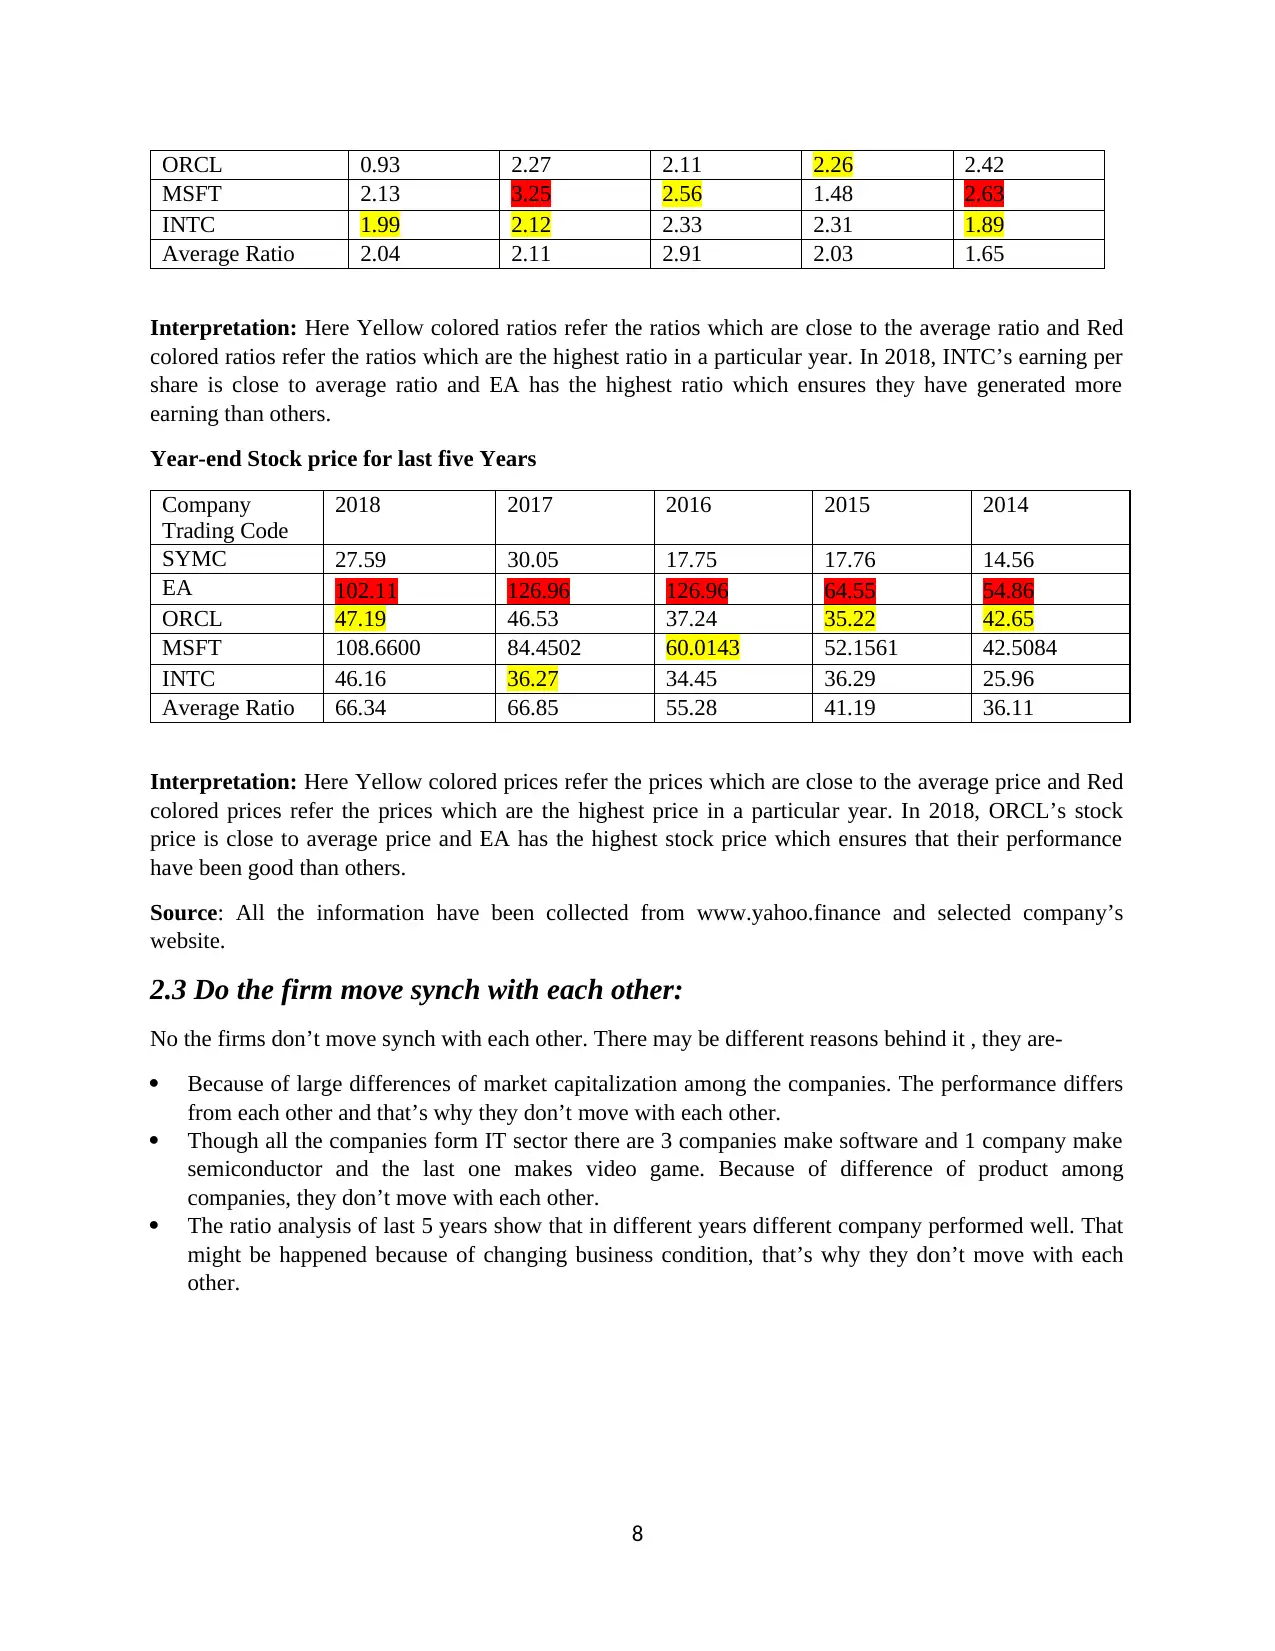
ORCL 0.93 2.27 2.11 2.26 2.42
MSFT 2.13 3.25 2.56 1.48 2.63
INTC 1.99 2.12 2.33 2.31 1.89
Average Ratio 2.04 2.11 2.91 2.03 1.65
Interpretation: Here Yellow colored ratios refer the ratios which are close to the average ratio and Red
colored ratios refer the ratios which are the highest ratio in a particular year. In 2018, INTC’s earning per
share is close to average ratio and EA has the highest ratio which ensures they have generated more
earning than others.
Year-end Stock price for last five Years
Company
Trading Code
2018 2017 2016 2015 2014
SYMC 27.59 30.05 17.75 17.76 14.56
EA 102.11 126.96 126.96 64.55 54.86
ORCL 47.19 46.53 37.24 35.22 42.65
MSFT 108.6600 84.4502 60.0143 52.1561 42.5084
INTC 46.16 36.27 34.45 36.29 25.96
Average Ratio 66.34 66.85 55.28 41.19 36.11
Interpretation: Here Yellow colored prices refer the prices which are close to the average price and Red
colored prices refer the prices which are the highest price in a particular year. In 2018, ORCL’s stock
price is close to average price and EA has the highest stock price which ensures that their performance
have been good than others.
Source: All the information have been collected from www.yahoo.finance and selected company’s
website.
2.3 Do the firm move synch with each other:
No the firms don’t move synch with each other. There may be different reasons behind it , they are-
Because of large differences of market capitalization among the companies. The performance differs
from each other and that’s why they don’t move with each other.
Though all the companies form IT sector there are 3 companies make software and 1 company make
semiconductor and the last one makes video game. Because of difference of product among
companies, they don’t move with each other.
The ratio analysis of last 5 years show that in different years different company performed well. That
might be happened because of changing business condition, that’s why they don’t move with each
other.
8
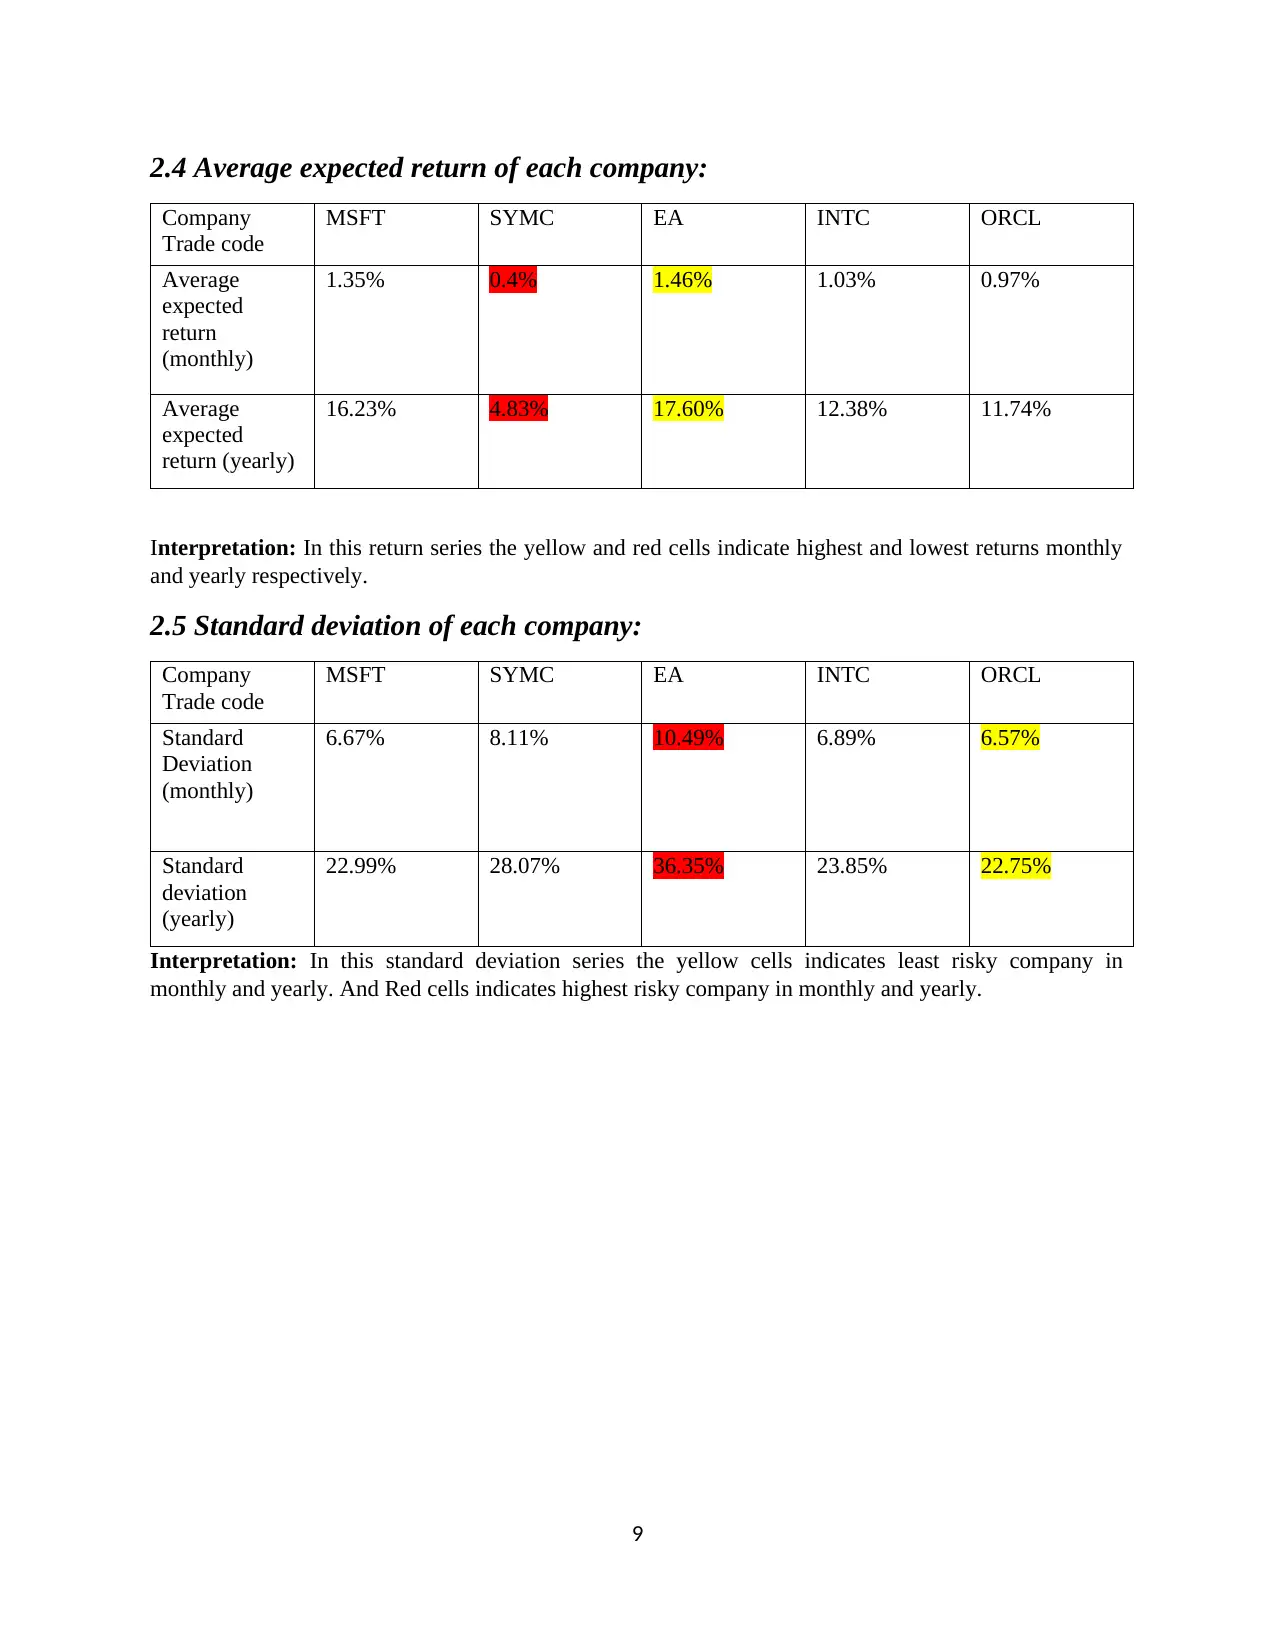
2.4 Average expected return of each company:
Company
Trade code
MSFT SYMC EA INTC ORCL
Average
expected
return
(monthly)
1.35% 0.4% 1.46% 1.03% 0.97%
Average
expected
return (yearly)
16.23% 4.83% 17.60% 12.38% 11.74%
Interpretation: In this return series the yellow and red cells indicate highest and lowest returns monthly
and yearly respectively.
2.5 Standard deviation of each company:
Company
Trade code
MSFT SYMC EA INTC ORCL
Standard
Deviation
(monthly)
6.67% 8.11% 10.49% 6.89% 6.57%
Standard
deviation
(yearly)
22.99% 28.07% 36.35% 23.85% 22.75%
Interpretation: In this standard deviation series the yellow cells indicates least risky company in
monthly and yearly. And Red cells indicates highest risky company in monthly and yearly.
9
Company
Trade code
MSFT SYMC EA INTC ORCL
Average
expected
return
(monthly)
1.35% 0.4% 1.46% 1.03% 0.97%
Average
expected
return (yearly)
16.23% 4.83% 17.60% 12.38% 11.74%
Interpretation: In this return series the yellow and red cells indicate highest and lowest returns monthly
and yearly respectively.
2.5 Standard deviation of each company:
Company
Trade code
MSFT SYMC EA INTC ORCL
Standard
Deviation
(monthly)
6.67% 8.11% 10.49% 6.89% 6.57%
Standard
deviation
(yearly)
22.99% 28.07% 36.35% 23.85% 22.75%
Interpretation: In this standard deviation series the yellow cells indicates least risky company in
monthly and yearly. And Red cells indicates highest risky company in monthly and yearly.
9
⊘ This is a preview!⊘
Do you want full access?
Subscribe today to unlock all pages.
Trusted by 1+ million students worldwide
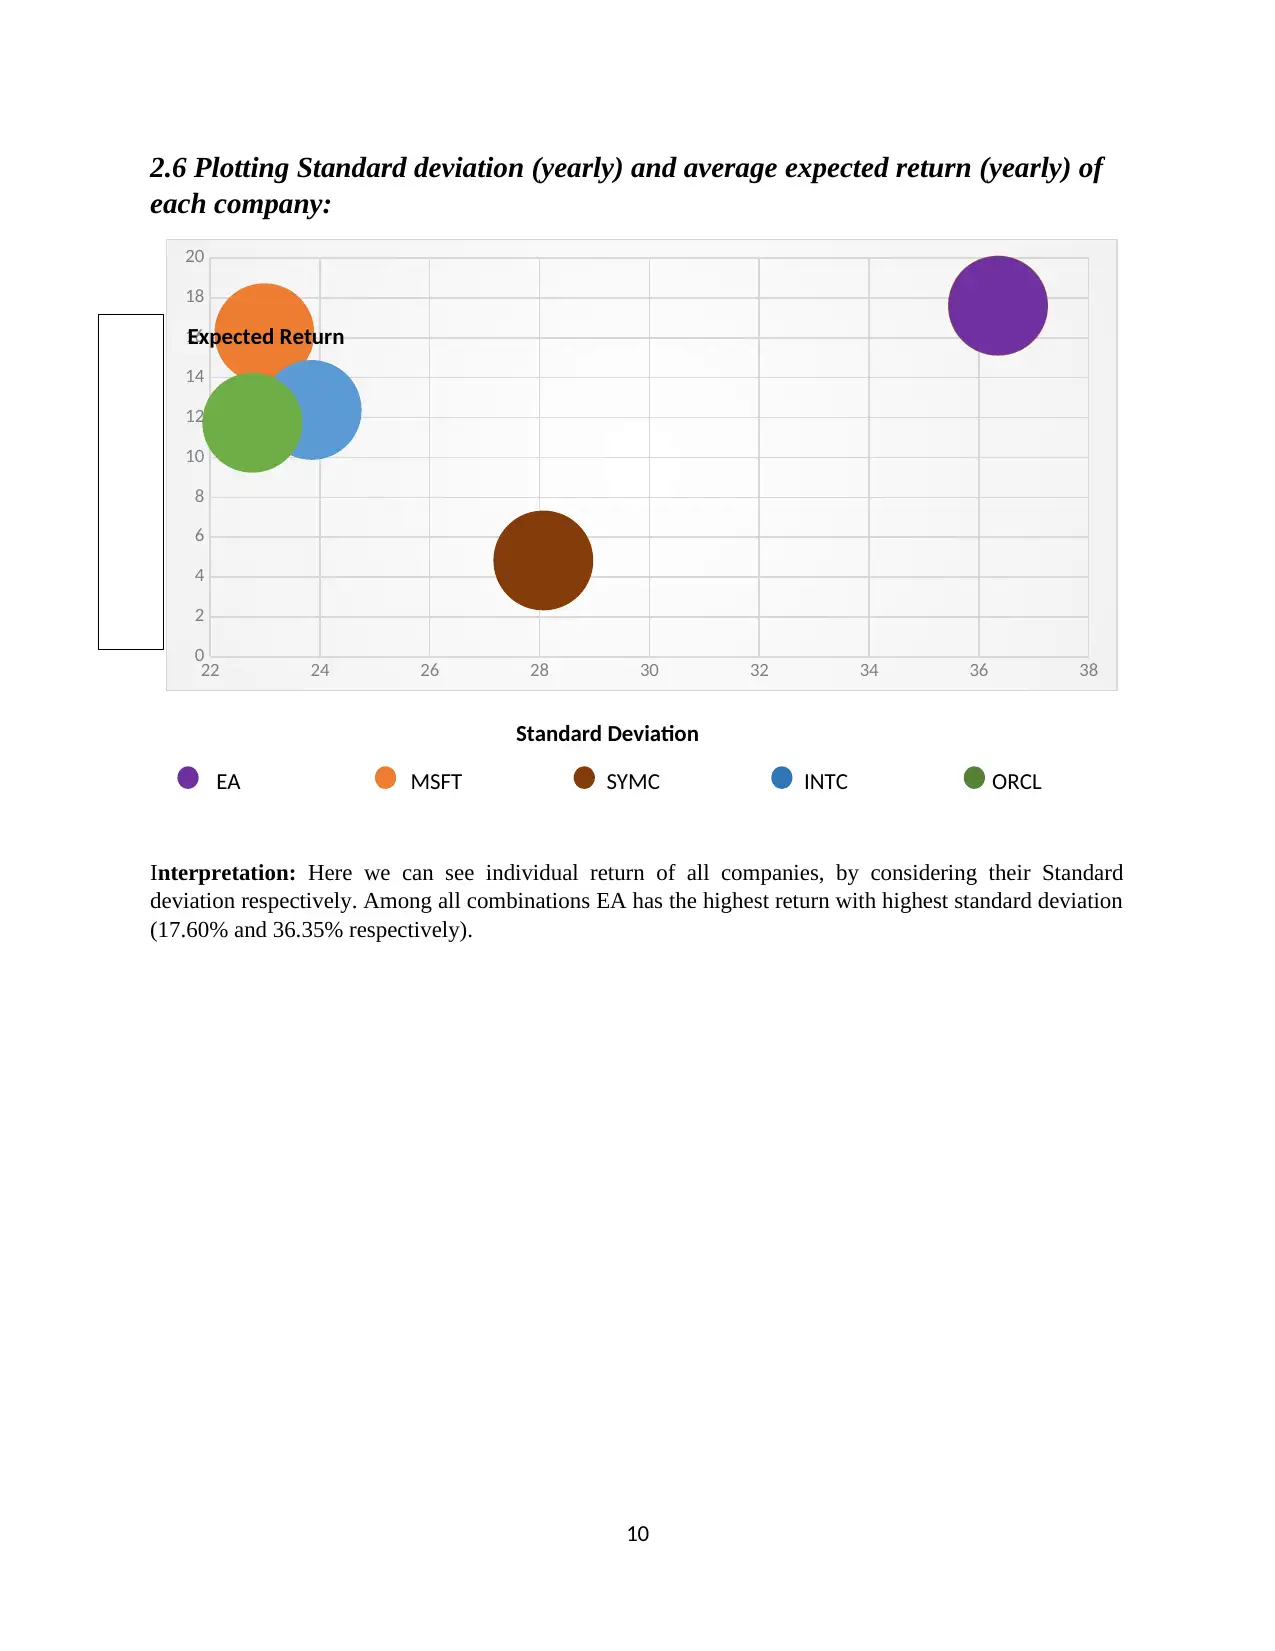
2.6 Plotting Standard deviation (yearly) and average expected return (yearly) of
each company:
22 24 26 28 30 32 34 36 38
0
2
4
6
8
10
12
14
16
18
20
Interpretation: Here we can see individual return of all companies, by considering their Standard
deviation respectively. Among all combinations EA has the highest return with highest standard deviation
(17.60% and 36.35% respectively).
10
Standard Deviation
Expected Return
EA MSFT SYMC INTC ORCL
Paraphrase This Document
Need a fresh take? Get an instant paraphrase of this document with our AI Paraphraser
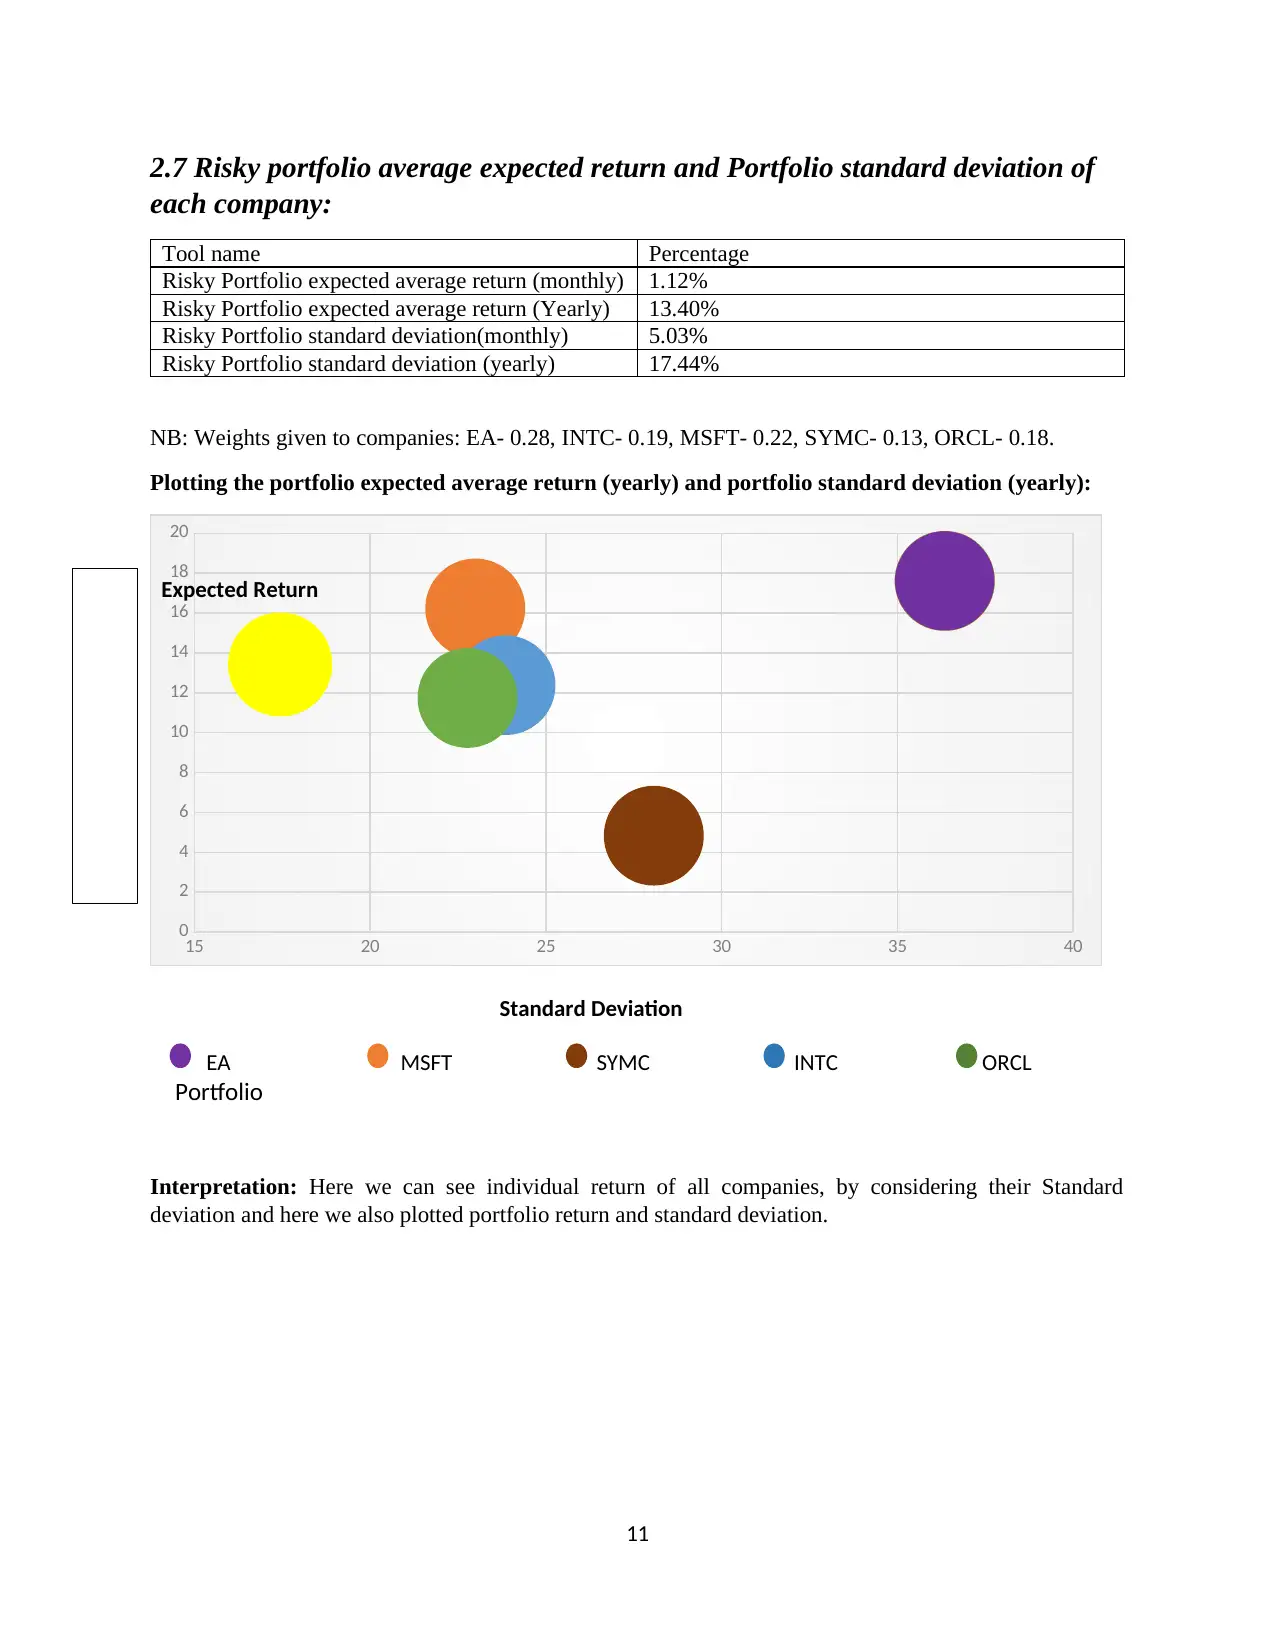
2.7 Risky portfolio average expected return and Portfolio standard deviation of
each company:
Tool name Percentage
Risky Portfolio expected average return (monthly) 1.12%
Risky Portfolio expected average return (Yearly) 13.40%
Risky Portfolio standard deviation(monthly) 5.03%
Risky Portfolio standard deviation (yearly) 17.44%
NB: Weights given to companies: EA- 0.28, INTC- 0.19, MSFT- 0.22, SYMC- 0.13, ORCL- 0.18.
Plotting the portfolio expected average return (yearly) and portfolio standard deviation (yearly):
15 20 25 30 35 40
0
2
4
6
8
10
12
14
16
18
20
Interpretation: Here we can see individual return of all companies, by considering their Standard
deviation and here we also plotted portfolio return and standard deviation.
11
EA MSFT SYMC INTC ORCL
Portfolio
Expected Return
Standard Deviation
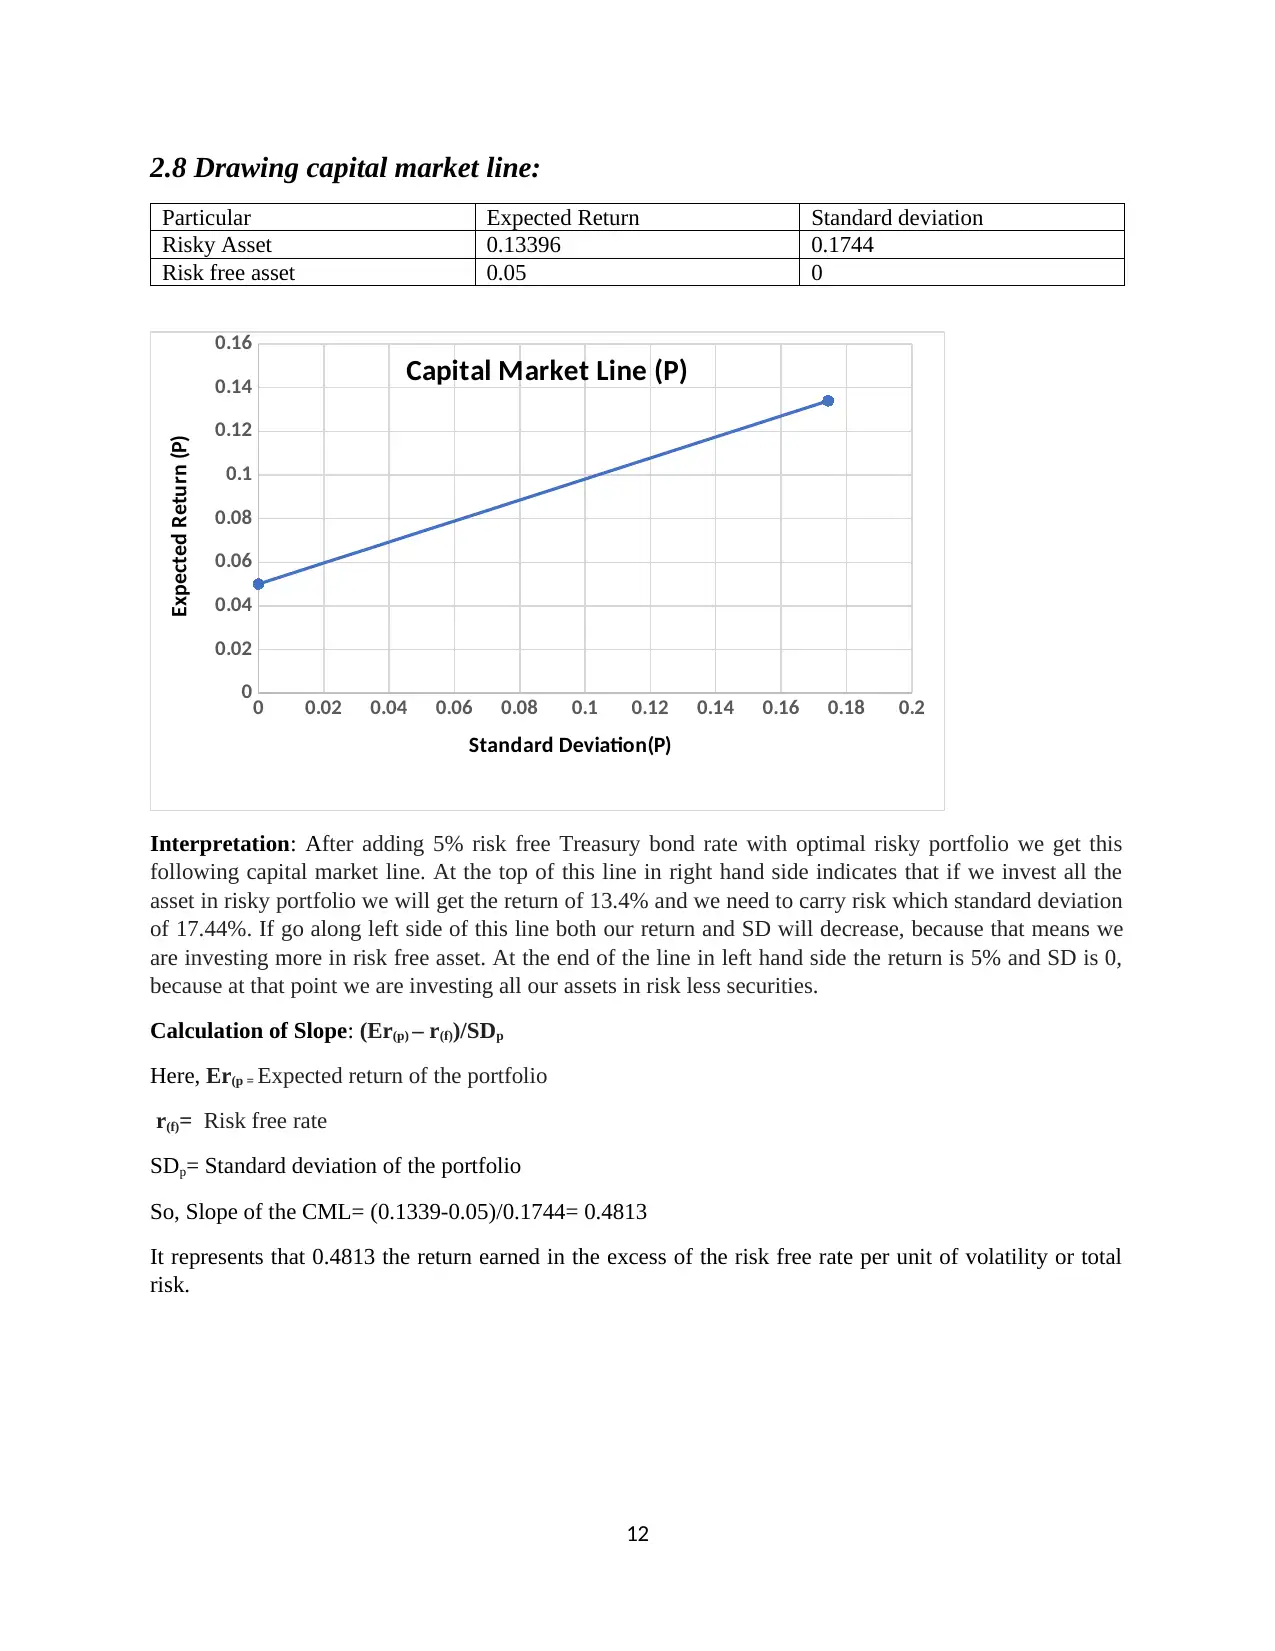
2.8 Drawing capital market line:
Particular Expected Return Standard deviation
Risky Asset 0.13396 0.1744
Risk free asset 0.05 0
0 0.02 0.04 0.06 0.08 0.1 0.12 0.14 0.16 0.18 0.2
0
0.02
0.04
0.06
0.08
0.1
0.12
0.14
0.16
Capital Market Line (P)
Standard Deviation(P)
Expected Return (P)
Interpretation: After adding 5% risk free Treasury bond rate with optimal risky portfolio we get this
following capital market line. At the top of this line in right hand side indicates that if we invest all the
asset in risky portfolio we will get the return of 13.4% and we need to carry risk which standard deviation
of 17.44%. If go along left side of this line both our return and SD will decrease, because that means we
are investing more in risk free asset. At the end of the line in left hand side the return is 5% and SD is 0,
because at that point we are investing all our assets in risk less securities.
Calculation of Slope: (Er(p) – r(f))/SDp
Here, Er(p = Expected return of the portfolio
r(f)= Risk free rate
SDp= Standard deviation of the portfolio
So, Slope of the CML= (0.1339-0.05)/0.1744= 0.4813
It represents that 0.4813 the return earned in the excess of the risk free rate per unit of volatility or total
risk.
12
⊘ This is a preview!⊘
Do you want full access?
Subscribe today to unlock all pages.
Trusted by 1+ million students worldwide
1 out of 20
Related Documents


Your All-in-One AI-Powered Toolkit for Academic Success.
+13062052269
info@desklib.com
Available 24*7 on WhatsApp / Email
![[object Object]](/_next/static/media/star-bottom.7253800d.svg)
Unlock your academic potential
Copyright © 2020–2026 A2Z Services. All Rights Reserved. Developed and managed by ZUCOL.