Equity Research Report: FIN5EQS - Ansell Limited and NAN Ltd
VerifiedAdded on 2023/01/12
|15
|3657
|84
Report
AI Summary
This equity research report presents a comprehensive analysis of Ansell Limited, a company in the healthcare sector, and compares its performance with NAN Ltd. The report begins with an introduction to the equity market and the selection of Ansell Limited as the primary company for analysis, followed by an industry overview and competitive positioning using Porter's Five Forces, PEST and SWOT analyses. The report delves into the financial performance of both companies over a five-year period, including profitability, liquidity, investment, and leverage ratios. Valuation techniques, including P/E ratio, Price-to-Book value, and Price-to-Free-Cash-Flow ratio, are applied to assess the stock's value. Based on the analysis, the report offers an investment recommendation, suggesting a potential sell or hold strategy for shareholders, concluding with a summary of findings and a call to action for investors. The report is based on the assignment brief provided, which requires an equity research report covering two companies from the healthcare sector in the Australian market, comparing their performance, performing a valuation, and providing a buy-side or sell-side recommendation.

Equity Research Report
1
1
Paraphrase This Document
Need a fresh take? Get an instant paraphrase of this document with our AI Paraphraser
INTRODUCTION...........................................................................................................................3
MAIN BODY..................................................................................................................................3
Industry overview and competitive positioning..............................................................................3
Financial analysis.........................................................................................................................7
Valuation......................................................................................................................................8
Recommendation.........................................................................................................................9
CONCLUSION................................................................................................................................9
REFERENCES..............................................................................................................................10
APPENDIX....................................................................................................................................11
2
INTRODUCTION
The equity market is a system in which, by stocks or off the counter transactions, securities
are sold and exchanged (Warusawitharana and Whited, 2016). Often known as the stock
exchange, this is one of a capitalist economy's many critical areas as it offers enterprises access
to credit and creditors a slice of equity in an organization with the ability to reap profits
depending on their future results. In order to determine the results of equity market Ansell
Limited have been selected in this report as the main company and NAN ltd is chosen as Peer
Company.
In this report, Business, industry and ex-post analysis Ex-ante analysis and proper
recommendation are made as per the analysis for the main company.
MAIN BODY
Industry overview and competitive positioning
Australia has an integrated health-care system but resources are still not uniformly dispersed
due to their large scale. In Australia, medical care is provided by both government and the
private sector firms which are also paid for by the government. Healthcare in Australia is
primarily financed by government at national, state, and local government levels, as well as by
private medical insurance but health care expenses are also incurred by non-profit organisations,
with significant costs borne by patients or charities. Some resources, particularly remote and
mental health services, are provided by volunteers.
The Community Services includes a variety of health care and services. Public hospitals are
the main profit producer for the region, accounting for over half of Australia's revenue from
health care. Subdivision general practitioners, nursing professionals and doctors also serve major
revenue sources. As well as widening private insurance coverage, Australia's rising and aging
population is expected to create high demand for healthcare services over the five years to 2018-
19. Increasing demand has largely guided revenue growth, as inflation in some sectors has
outpaced rises in Medicare benefits per program and schedule fees.
There are some key players which capture the Australian health care market and all are as
follow; Ministry of health market, Department of Health and Human Services, Queensland
Health and Department of Health of Western Australia.
Porter’s competitive strategy:
3
⊘ This is a preview!⊘
Do you want full access?
Subscribe today to unlock all pages.
Trusted by 1+ million students worldwide
Threats of entrants: New competitors in Health Care Equipment & Services are need to
introduce creativity, innovative ways of working and bringing pressure on Ansell Limited
through a lower pricing approach, reducing prices and supplying consumers with new value
proposals. Ansell Limited must overcome all these obstacles and build successful barriers to
preserve its competitive advantage (Bekaert and Harvey, 2017). Through making new goods and
services innovated. New services not only carry new clients to the market but also offer old
consumers a reason to purchase goods from Ansell Limited. By creating economy of scale so the
fixed expense per unit can be reduced. New competitors are less likely to enter a competitive
market, where existing players like Ansell Limited tend to regularly define the standards.
Bargaining power of suppliers: The margins that Ansell Limited can gain from the
market can be reduced by distributors in leading position. Strong Health Care Equipment &
Services suppliers use their bargaining leverage to obtain higher rates from companies in the
Health Care Equipment & Services market. By getting multiple suppliers create efficient supply
chain. By playing with consumer designs utilizing various materials in such a way that if costs
increase from one raw resources then the business will switch to another. Developing dedicating
suppliers those are dependent on the client. Some of the things Ansell Limited should learn from
Wal-Mart and Nike are how third party distributors were founded by those firms.
Bargaining power of suppliers: Buyers are also very aggressive. They choose to buy the
best possible items by charging as small price as feasible. This put long-term stress on
profitability for Ansell Limited. The larger and smaller the customer base is from Ansell limited
the stronger the consumers 'negotiating power and the greater their willingness to pursue through
discounts and deals. That will be useful in multiple ways. This would that the buyers 'bargaining
power and provide the company with an opportunity to simplify its selling and manufacturing
cycle.
Threats of substitutes: When a different product or service addresses the needs of a
specific customer in different ways, productivity in the industry suffers. Services such as
Dropbox and Google Drive replace hardware drives for example. A replacement product or
service is highly threatened if it provides a business model which is fundamentally different from
the sector's present offerings. By becoming more service focused than simply product focused.
By understanding the consumer's core desires, instead of what the consumer purchases and by
raising the price to the consumers to turn (McLean, Pontiff and Zhao, 2017).
4
Paraphrase This Document
Need a fresh take? Get an instant paraphrase of this document with our AI Paraphraser
Rivalry: When the competition in an industry's established players is strong then it will
push down prices and undermine the company's overall profitability. Ansell Limited serves in a
very dynamic field of Health Care Equipment & Services. This rivalry takes toll on the
organisation's overall long-term productivity.
PEST and SOWT analysis
Ansell Limited works in over different countries in Healthcare Facilities & Services and
exposes to various forms of political, environmental etc. threats to the financial structure. The
following pest analysis is as follows:
Political
Bureaucracy and intervention by government in the health care products and facilities
market and the regulatory basis for implementation of contracts (Hattori, Shim and
Sugihara, 2019).
Favoured trade agreements and competition rules on goods and facilities for health care.
Economic
Policy interference in the private sector and efficiency of the system of equipment and
facilities for healthcare.
Ability standard of employees and Host State and Health Care Equipment & Services
industry competitive advantages in the nation in question.
Social
Distribution of gender, patriarchy, and distribution of control within society.
Pay quality as well as employment norm in the business of Ansell Limited
Technological
Recent technical advances by competition of Ansell Limited which affect innovation on
service offering (Jeanneret, 2017).
Influence on cost analysis and composition of the supply chain in the health care products
& service sectors
SWOT analysis
SWOT matrix's primary aim is to define the techniques a company may use to leverage
potential resources, combat risks, draw on and defend Ansell Existing strengths and eliminate its
weaknesses.
Strength:
5
Action automation added price stability to Ansell Small goods which made it possible for
the business to scale up which scale down, depending on customer demand conditions.
Reputable suppliers – It has a deep base of reputable raw material manufacturer thereby
allowing the business to solve any inefficiencies in the distribution chain.
Weaknesses:
There have been discrepancies in the firm's variety of products sold. That lack of options
can give the sector a strategic advantage to a new entrant.
High turnover rate in the labour force compared too many business organisations Ansell
Limited seems to have a higher retention rate and needs to invest even more in
recruitment and employee growth relative to its rivals (Lleo and Ziemba, 2019).
Opportunities
Lower inflation rate: The lower inflation rate brings further price stability, allowing
Ansell Small consumers to invest at lower interest rates.
Current regulations on the economy: The latest incentives would establish a fair playing
field for all business participants. It represents a tremendous chance for Ansell Limited to
bring home its latest technological superiority and capture market penetration in the
emerging category of goods.
Threats:
Changing customer purchasing behaviour from the online platform may pose a challenge
to the traditional supply chain paradigm powered by network infrastructure.
Compensation rules are common in various nations, so Ansell Limited can be liable to
specific liability lawsuits owing to regulatory adjustments in all those countries.
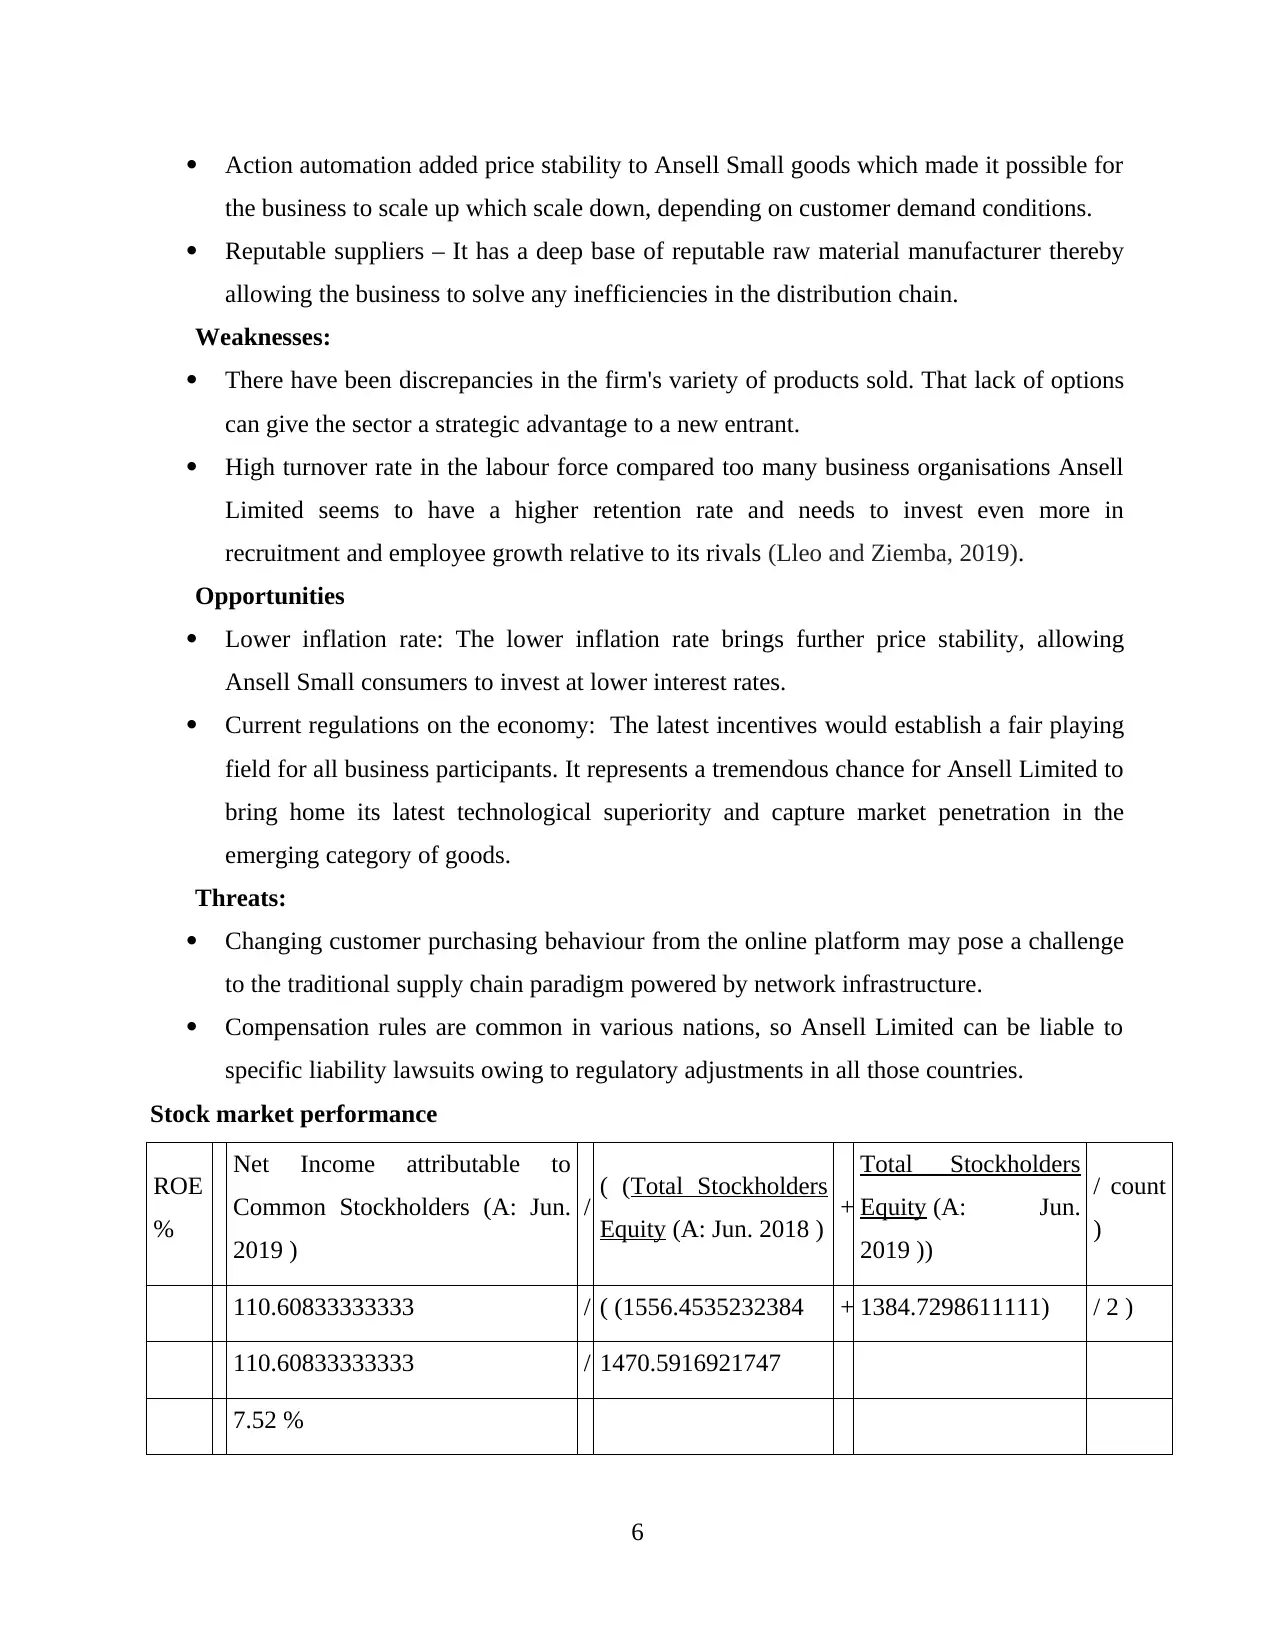
Stock market performance
ROE
%
Net Income attributable to
Common Stockholders (A: Jun.
2019 )
/ ( (Total Stockholders
Equity (A: Jun. 2018 ) +
Total Stockholders
Equity (A: Jun.
2019 ))
/ count
)
110.60833333333 / ( (1556.4535232384 + 1384.7298611111) / 2 )
110.60833333333 / 1470.5916921747
7.52 %
6
the business to scale up which scale down, depending on customer demand conditions.
Reputable suppliers – It has a deep base of reputable raw material manufacturer thereby
allowing the business to solve any inefficiencies in the distribution chain.
Weaknesses:
There have been discrepancies in the firm's variety of products sold. That lack of options
can give the sector a strategic advantage to a new entrant.
High turnover rate in the labour force compared too many business organisations Ansell
Limited seems to have a higher retention rate and needs to invest even more in
recruitment and employee growth relative to its rivals (Lleo and Ziemba, 2019).
Opportunities
Lower inflation rate: The lower inflation rate brings further price stability, allowing
Ansell Small consumers to invest at lower interest rates.
Current regulations on the economy: The latest incentives would establish a fair playing
field for all business participants. It represents a tremendous chance for Ansell Limited to
bring home its latest technological superiority and capture market penetration in the
emerging category of goods.
Threats:
Changing customer purchasing behaviour from the online platform may pose a challenge
to the traditional supply chain paradigm powered by network infrastructure.
Compensation rules are common in various nations, so Ansell Limited can be liable to
specific liability lawsuits owing to regulatory adjustments in all those countries.
Stock market performance
ROE
%
Net Income attributable to
Common Stockholders (A: Jun.
2019 )
/ ( (Total Stockholders
Equity (A: Jun. 2018 ) +
Total Stockholders
Equity (A: Jun.
2019 ))
/ count
)
110.60833333333 / ( (1556.4535232384 + 1384.7298611111) / 2 )
110.60833333333 / 1470.5916921747
7.52 %
6
⊘ This is a preview!⊘
Do you want full access?
Subscribe today to unlock all pages.
Trusted by 1+ million students worldwide
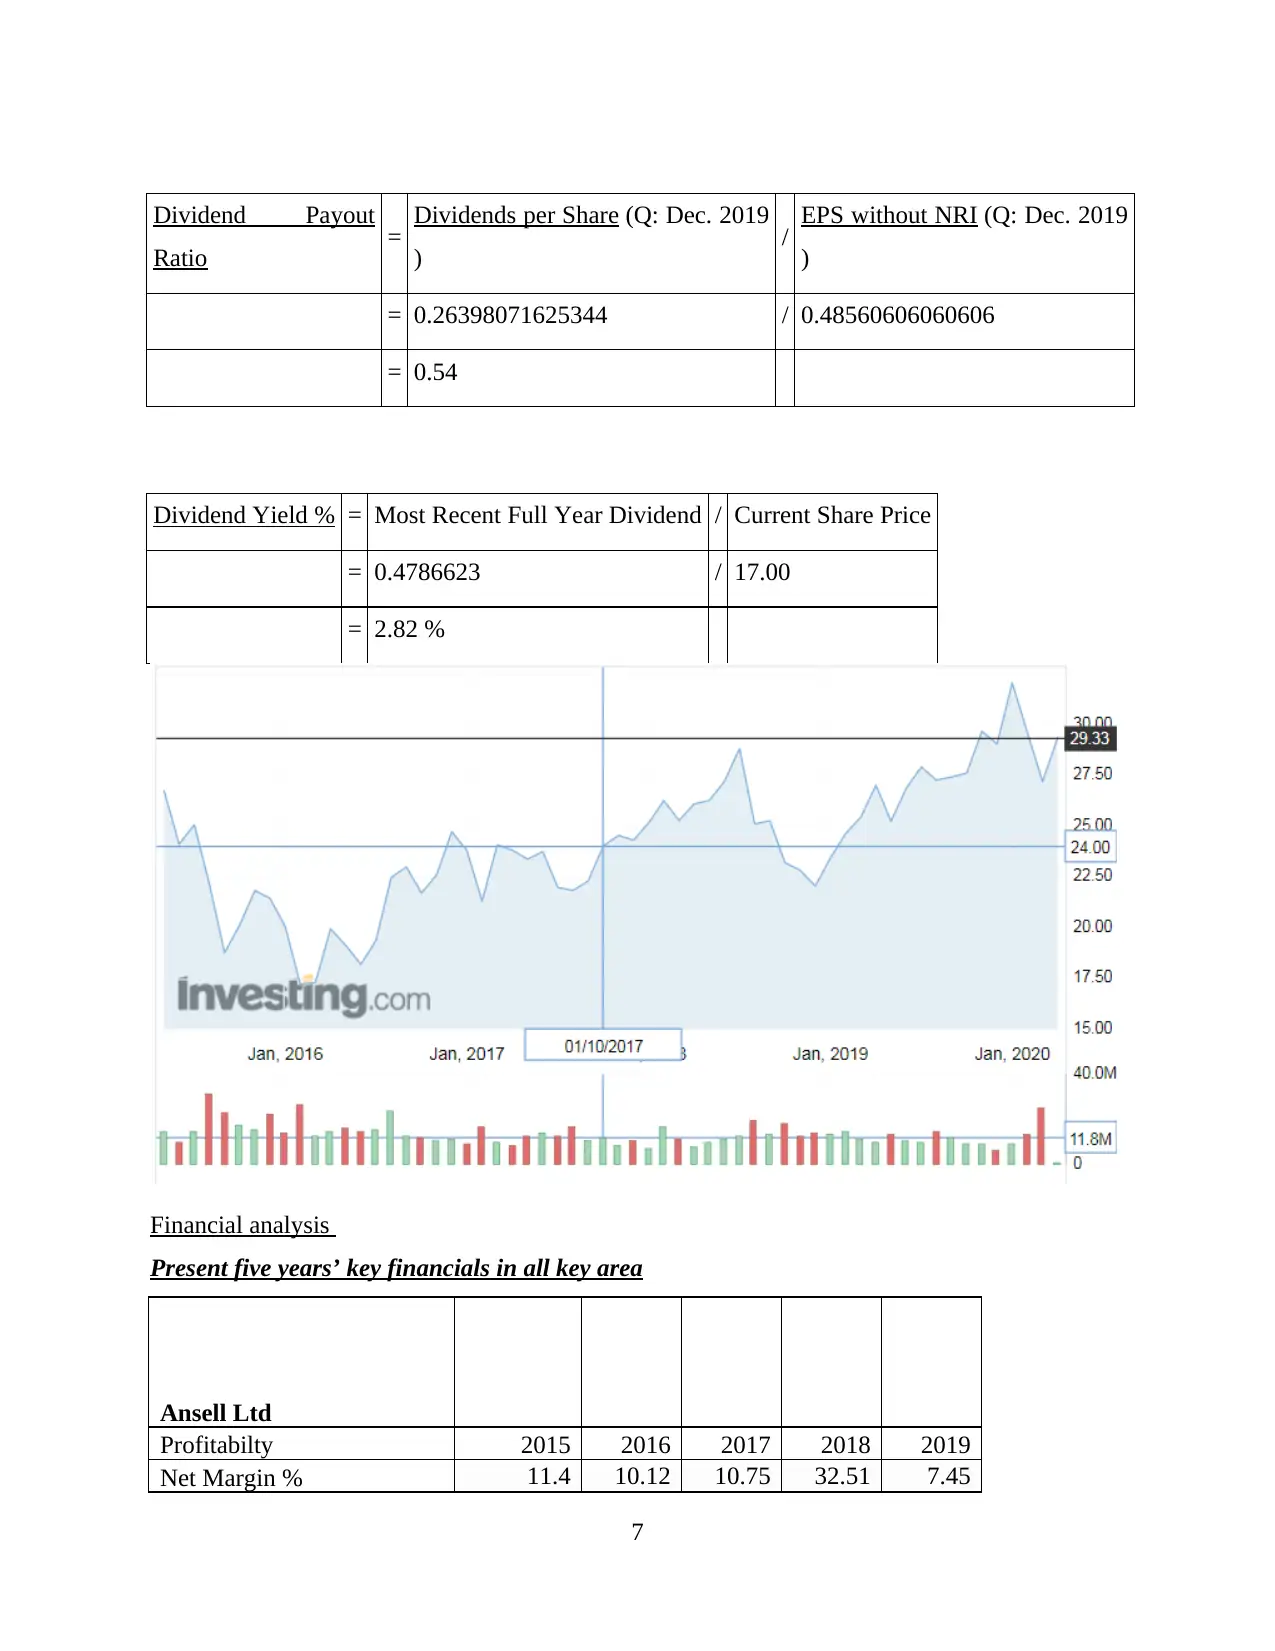
Dividend Payout
Ratio = Dividends per Share (Q: Dec. 2019
) / EPS without NRI (Q: Dec. 2019
)
= 0.26398071625344 / 0.48560606060606
= 0.54
Dividend Yield % = Most Recent Full Year Dividend / Current Share Price
= 0.4786623 / 17.00
= 2.82 %
Financial analysis
Present five years’ key financials in all key area
Ansell Ltd
Profitabilty 2015 2016 2017 2018 2019
Net Margin % 11.4 10.12 10.75 32.51 7.45
7
Paraphrase This Document
Need a fresh take? Get an instant paraphrase of this document with our AI Paraphraser
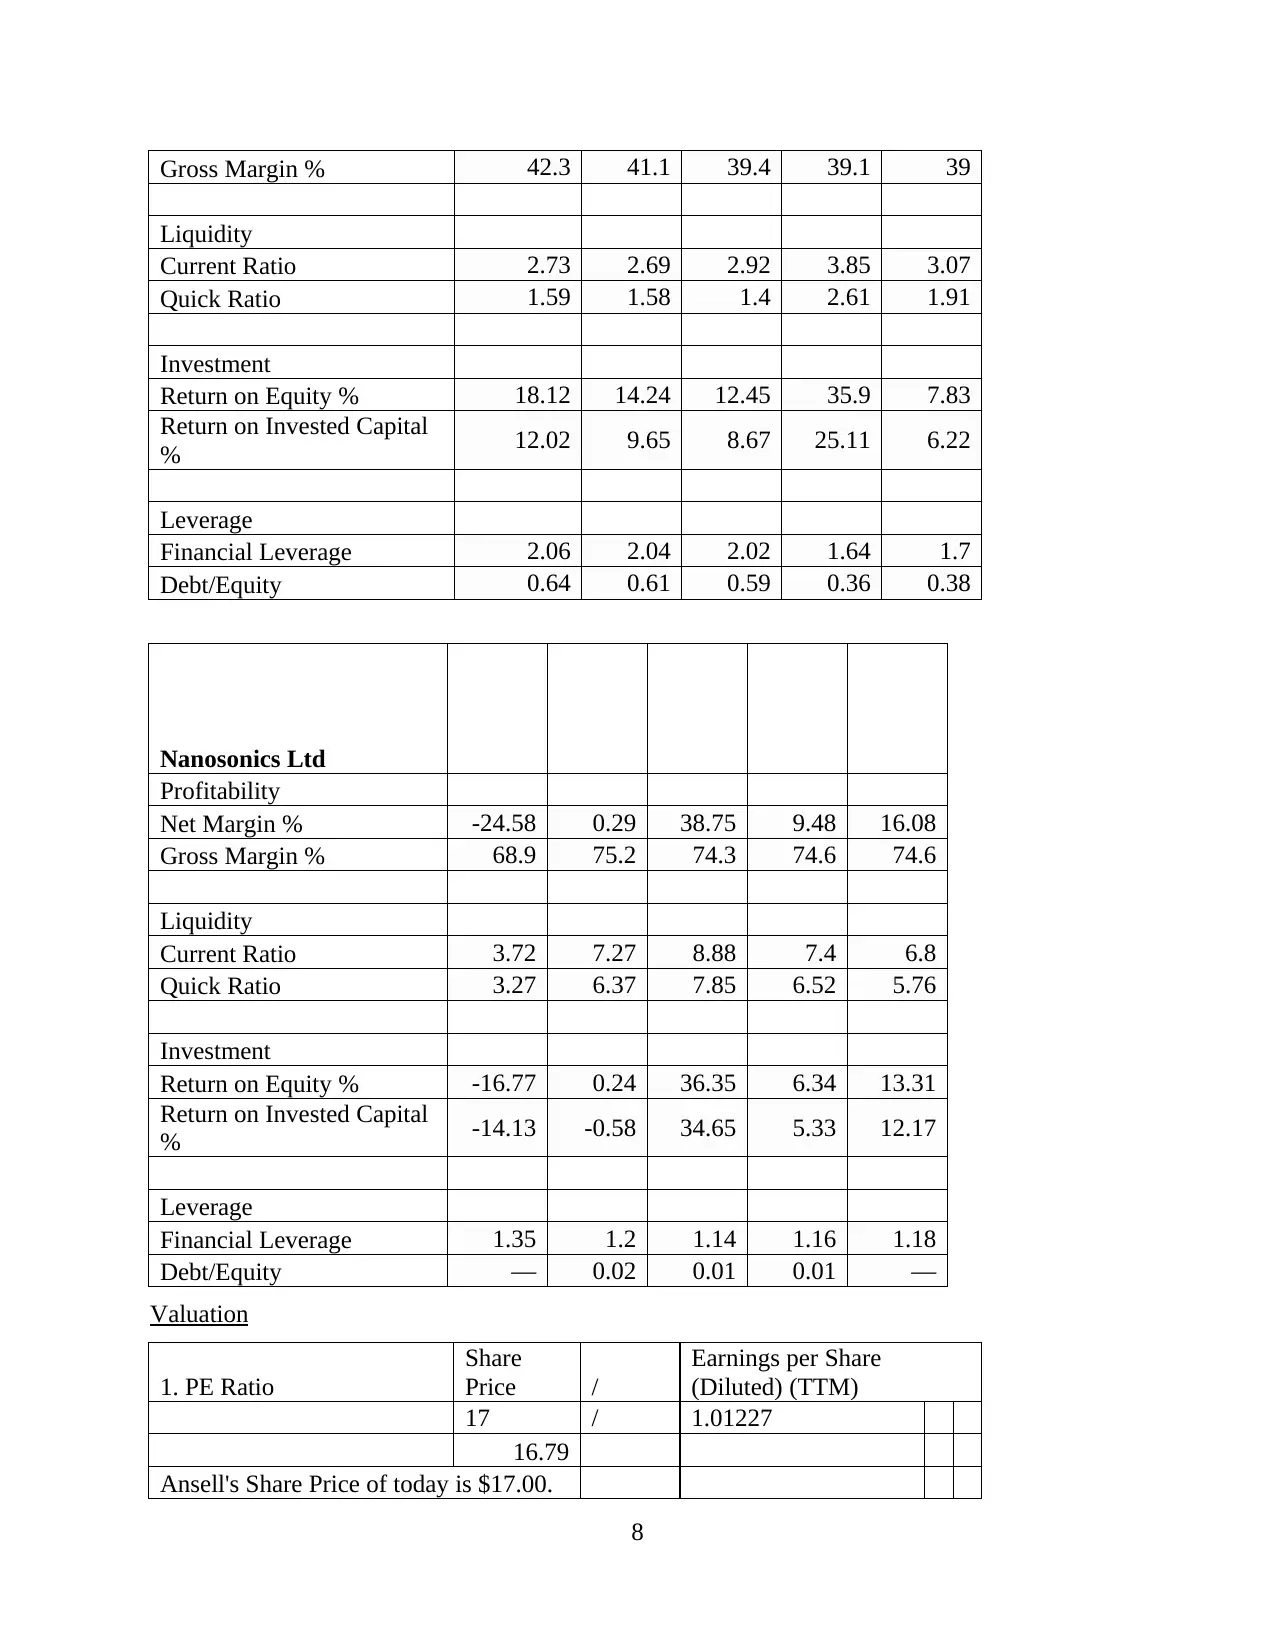
Gross Margin % 42.3 41.1 39.4 39.1 39
Liquidity
Current Ratio 2.73 2.69 2.92 3.85 3.07
Quick Ratio 1.59 1.58 1.4 2.61 1.91
Investment
Return on Equity % 18.12 14.24 12.45 35.9 7.83
Return on Invested Capital
% 12.02 9.65 8.67 25.11 6.22
Leverage
Financial Leverage 2.06 2.04 2.02 1.64 1.7
Debt/Equity 0.64 0.61 0.59 0.36 0.38
Nanosonics Ltd
Profitability
Net Margin % -24.58 0.29 38.75 9.48 16.08
Gross Margin % 68.9 75.2 74.3 74.6 74.6
Liquidity
Current Ratio 3.72 7.27 8.88 7.4 6.8
Quick Ratio 3.27 6.37 7.85 6.52 5.76
Investment
Return on Equity % -16.77 0.24 36.35 6.34 13.31
Return on Invested Capital
% -14.13 -0.58 34.65 5.33 12.17
Leverage
Financial Leverage 1.35 1.2 1.14 1.16 1.18
Debt/Equity — 0.02 0.01 0.01 —
Valuation
1. PE Ratio
Share
Price /
Earnings per Share
(Diluted) (TTM)
17 / 1.01227
16.79
Ansell's Share Price of today is $17.00.
8
Liquidity
Current Ratio 2.73 2.69 2.92 3.85 3.07
Quick Ratio 1.59 1.58 1.4 2.61 1.91
Investment
Return on Equity % 18.12 14.24 12.45 35.9 7.83
Return on Invested Capital
% 12.02 9.65 8.67 25.11 6.22
Leverage
Financial Leverage 2.06 2.04 2.02 1.64 1.7
Debt/Equity 0.64 0.61 0.59 0.36 0.38
Nanosonics Ltd
Profitability
Net Margin % -24.58 0.29 38.75 9.48 16.08
Gross Margin % 68.9 75.2 74.3 74.6 74.6
Liquidity
Current Ratio 3.72 7.27 8.88 7.4 6.8
Quick Ratio 3.27 6.37 7.85 6.52 5.76
Investment
Return on Equity % -16.77 0.24 36.35 6.34 13.31
Return on Invested Capital
% -14.13 -0.58 34.65 5.33 12.17
Leverage
Financial Leverage 1.35 1.2 1.14 1.16 1.18
Debt/Equity — 0.02 0.01 0.01 —
Valuation
1. PE Ratio
Share
Price /
Earnings per Share
(Diluted) (TTM)
17 / 1.01227
16.79
Ansell's Share Price of today is $17.00.
8
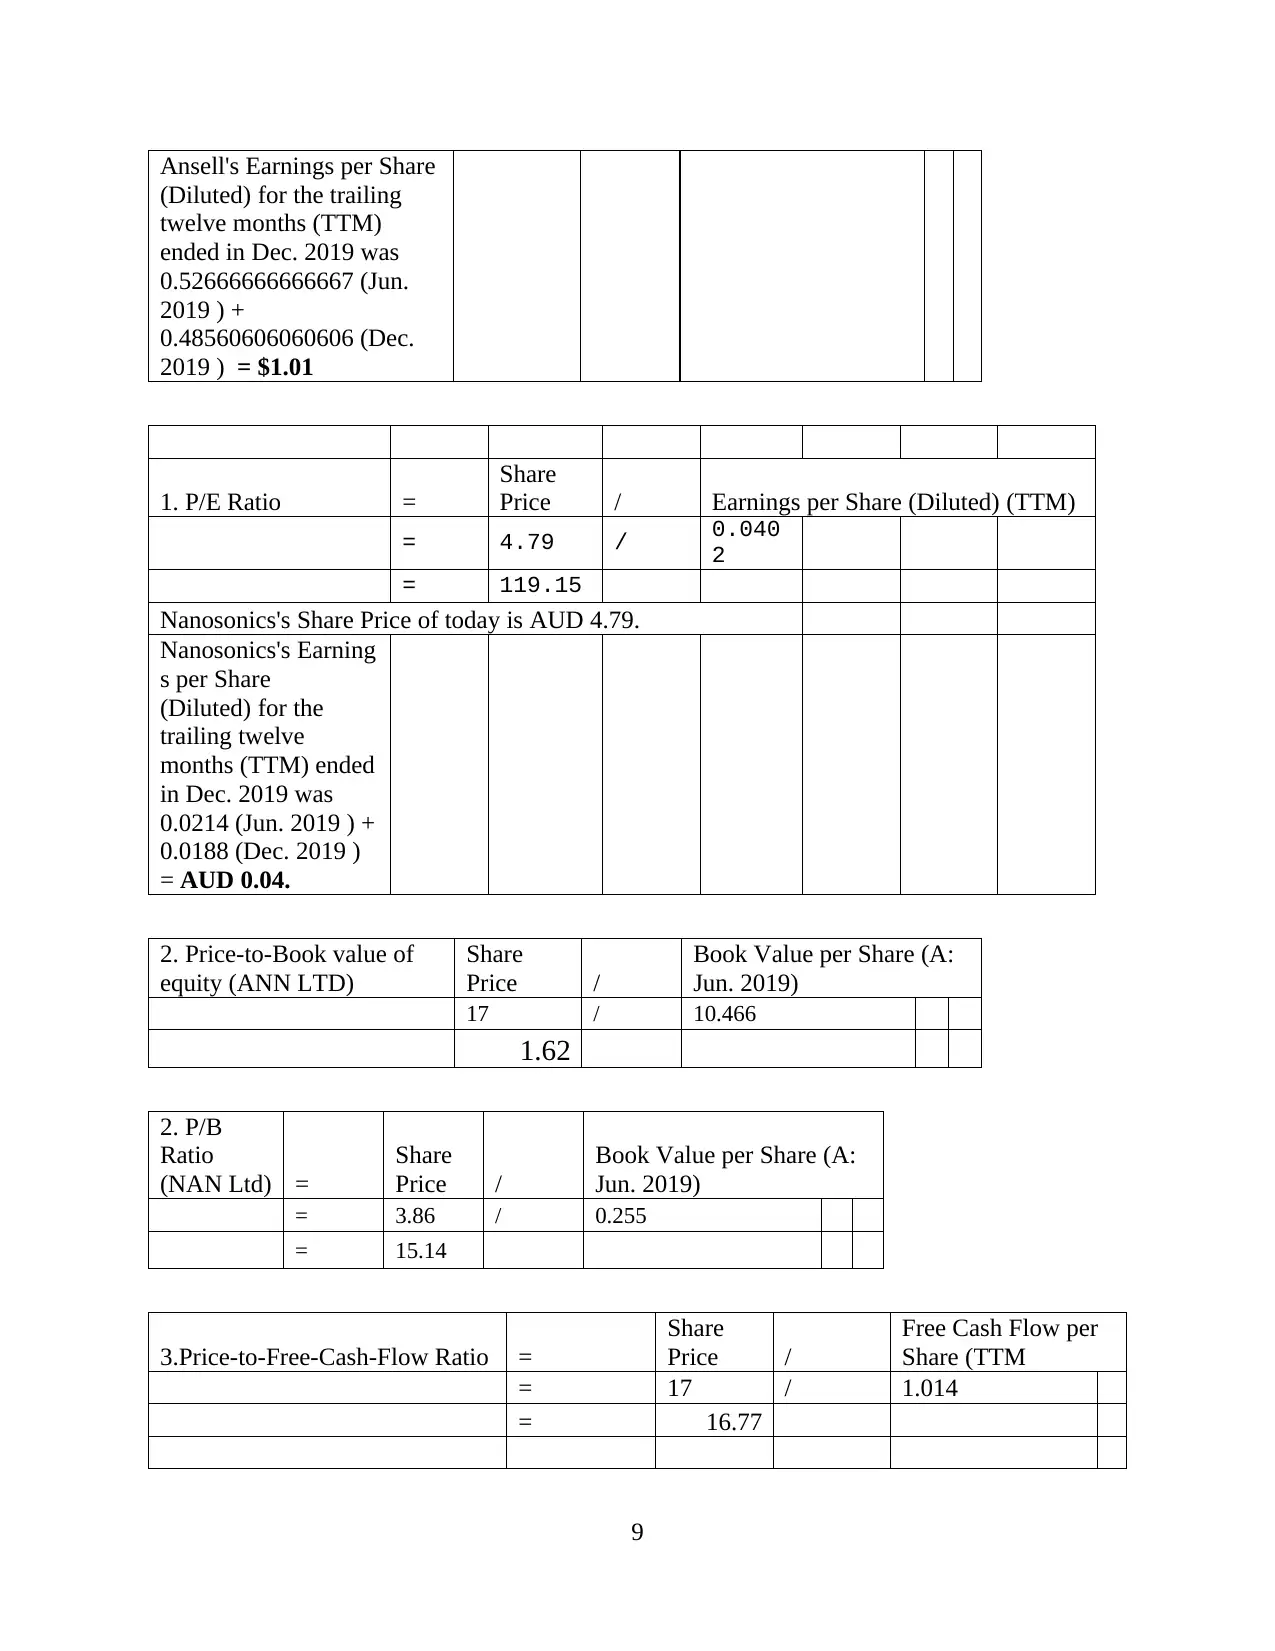
Ansell's Earnings per Share
(Diluted) for the trailing
twelve months (TTM)
ended in Dec. 2019 was
0.52666666666667 (Jun.
2019 ) +
0.48560606060606 (Dec.
2019 ) = $1.01
1. P/E Ratio =
Share
Price / Earnings per Share (Diluted) (TTM)
= 4.79 / 0.040
2
= 119.15
Nanosonics's Share Price of today is AUD 4.79.
Nanosonics's Earning
s per Share
(Diluted) for the
trailing twelve
months (TTM) ended
in Dec. 2019 was
0.0214 (Jun. 2019 ) +
0.0188 (Dec. 2019 )
= AUD 0.04.
2. Price-to-Book value of
equity (ANN LTD)
Share
Price /
Book Value per Share (A:
Jun. 2019)
17 / 10.466
1.62
2. P/B
Ratio
(NAN Ltd) =
Share
Price /
Book Value per Share (A:
Jun. 2019)
= 3.86 / 0.255
= 15.14
3.Price-to-Free-Cash-Flow Ratio =
Share
Price /
Free Cash Flow per
Share (TTM
= 17 / 1.014
= 16.77
9
⊘ This is a preview!⊘
Do you want full access?
Subscribe today to unlock all pages.
Trusted by 1+ million students worldwide
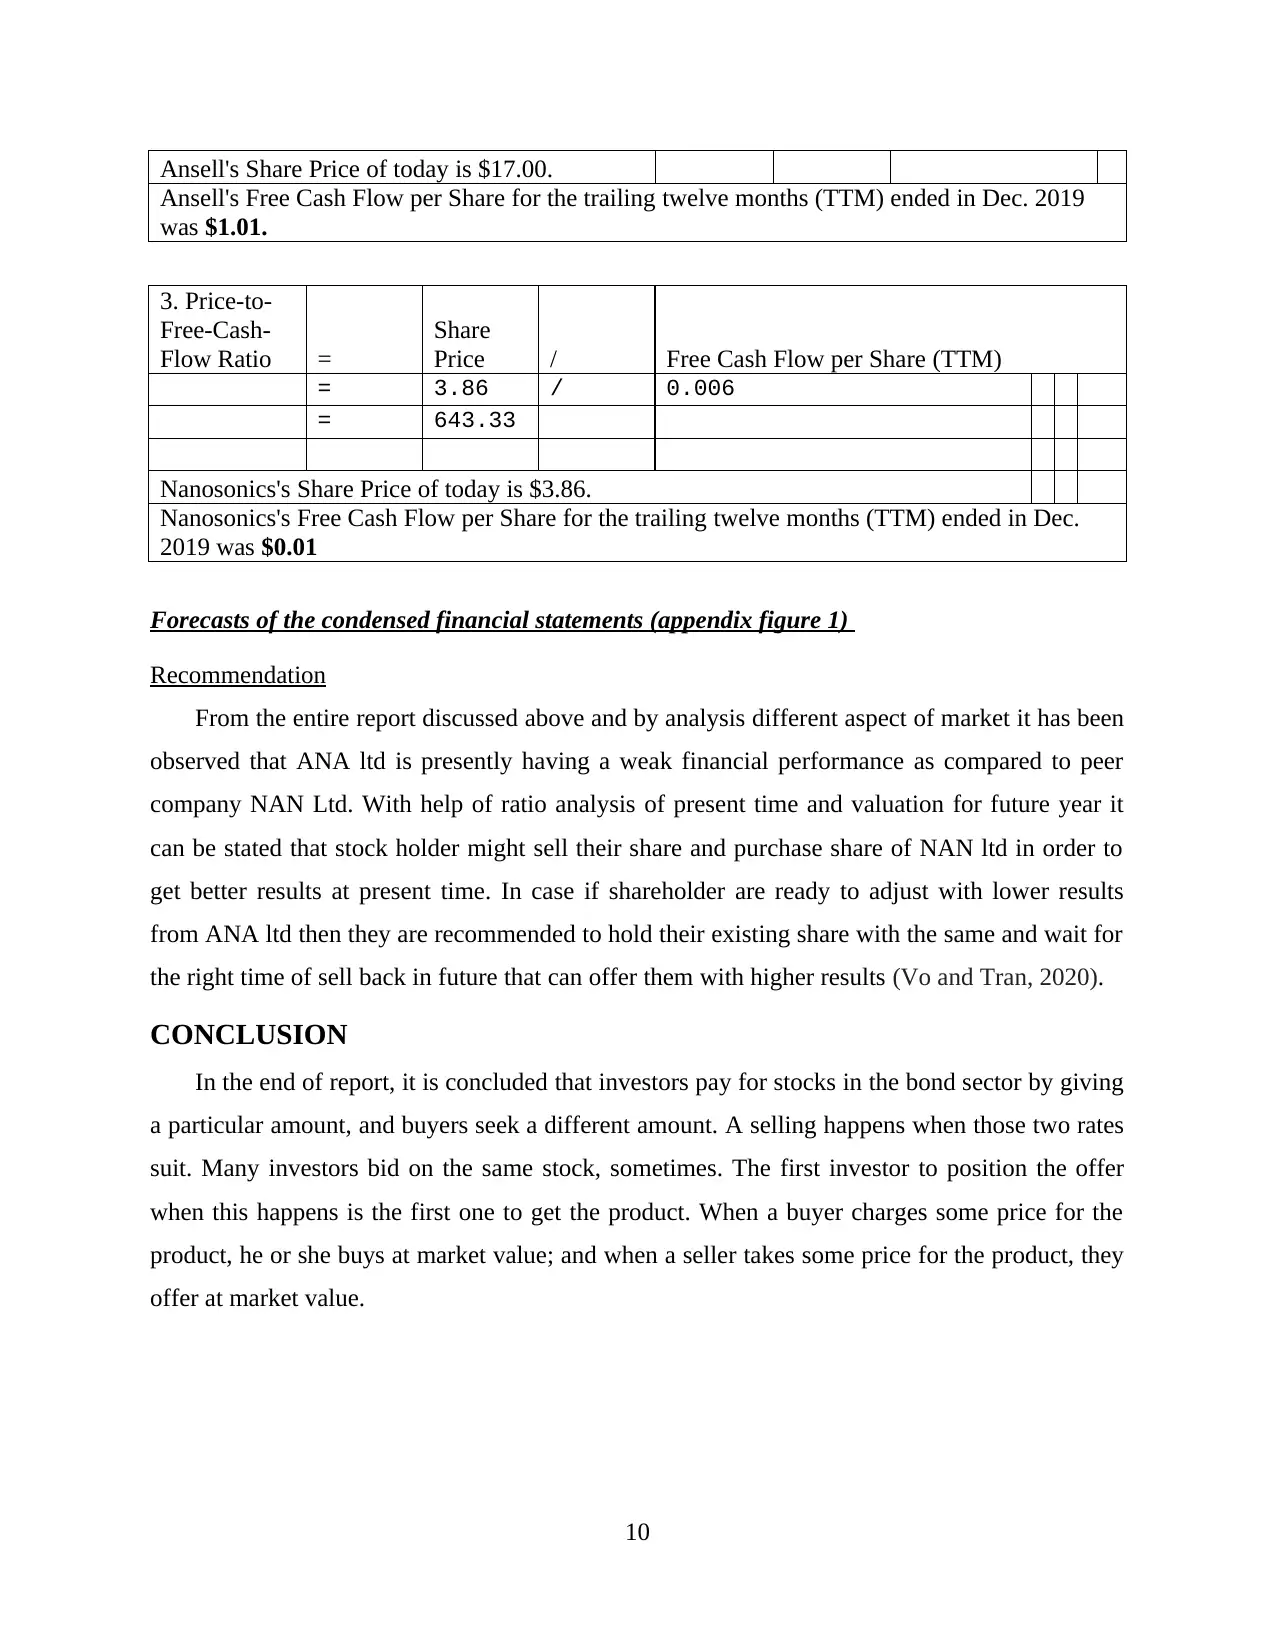
Ansell's Share Price of today is $17.00.
Ansell's Free Cash Flow per Share for the trailing twelve months (TTM) ended in Dec. 2019
was $1.01.
3. Price-to-
Free-Cash-
Flow Ratio =
Share
Price / Free Cash Flow per Share (TTM)
= 3.86 / 0.006
= 643.33
Nanosonics's Share Price of today is $3.86.
Nanosonics's Free Cash Flow per Share for the trailing twelve months (TTM) ended in Dec.
2019 was $0.01
Forecasts of the condensed financial statements (appendix figure 1)
Recommendation
From the entire report discussed above and by analysis different aspect of market it has been
observed that ANA ltd is presently having a weak financial performance as compared to peer
company NAN Ltd. With help of ratio analysis of present time and valuation for future year it
can be stated that stock holder might sell their share and purchase share of NAN ltd in order to
get better results at present time. In case if shareholder are ready to adjust with lower results
from ANA ltd then they are recommended to hold their existing share with the same and wait for
the right time of sell back in future that can offer them with higher results (Vo and Tran, 2020).
CONCLUSION
In the end of report, it is concluded that investors pay for stocks in the bond sector by giving
a particular amount, and buyers seek a different amount. A selling happens when those two rates
suit. Many investors bid on the same stock, sometimes. The first investor to position the offer
when this happens is the first one to get the product. When a buyer charges some price for the
product, he or she buys at market value; and when a seller takes some price for the product, they
offer at market value.
10
Paraphrase This Document
Need a fresh take? Get an instant paraphrase of this document with our AI Paraphraser
REFERENCES
Books & Journals
Warusawitharana, M. and Whited, T. M., 2016. Equity market misvaluation, financing, and
investment. The Review of Financial Studies, 29(3), pp.603-654.
Bekaert, G. and Harvey, C. R., 2017. Emerging equity markets in a globalizing world. Available
at SSRN 2344817.
McLean, R. D., Pontiff, J. and Zhao, M., 2017. A Closer Look at the Effects of Equity Market
Liberalization in Emerging Markets. Available at SSRN 2285470.
Jeanneret, A., 2017. Sovereign default risk and the us equity market. Journal of Financial and
Quantitative Analysis, 52(1), pp.305-339.
Lleo, S. and Ziemba, W. T., 2019. Can Warren Buffett forecast equity market corrections?. The
European Journal of Finance, 25(4), pp.369-393.
Vo, X.V. and Tran, T. T. A., 2020. Modelling volatility spillovers from the US equity market to
ASEAN stock markets. Pacific-Basin Finance Journal, 59, p.101246.
Hattori, M., Shim, I. and Sugihara, Y., 2019. Volatility contagion across the equity markets of
developed and emerging market economies. Macroeconomic Shocks and Unconventional
Monetary Policy: Impacts on Emerging Markets, p.99.
11
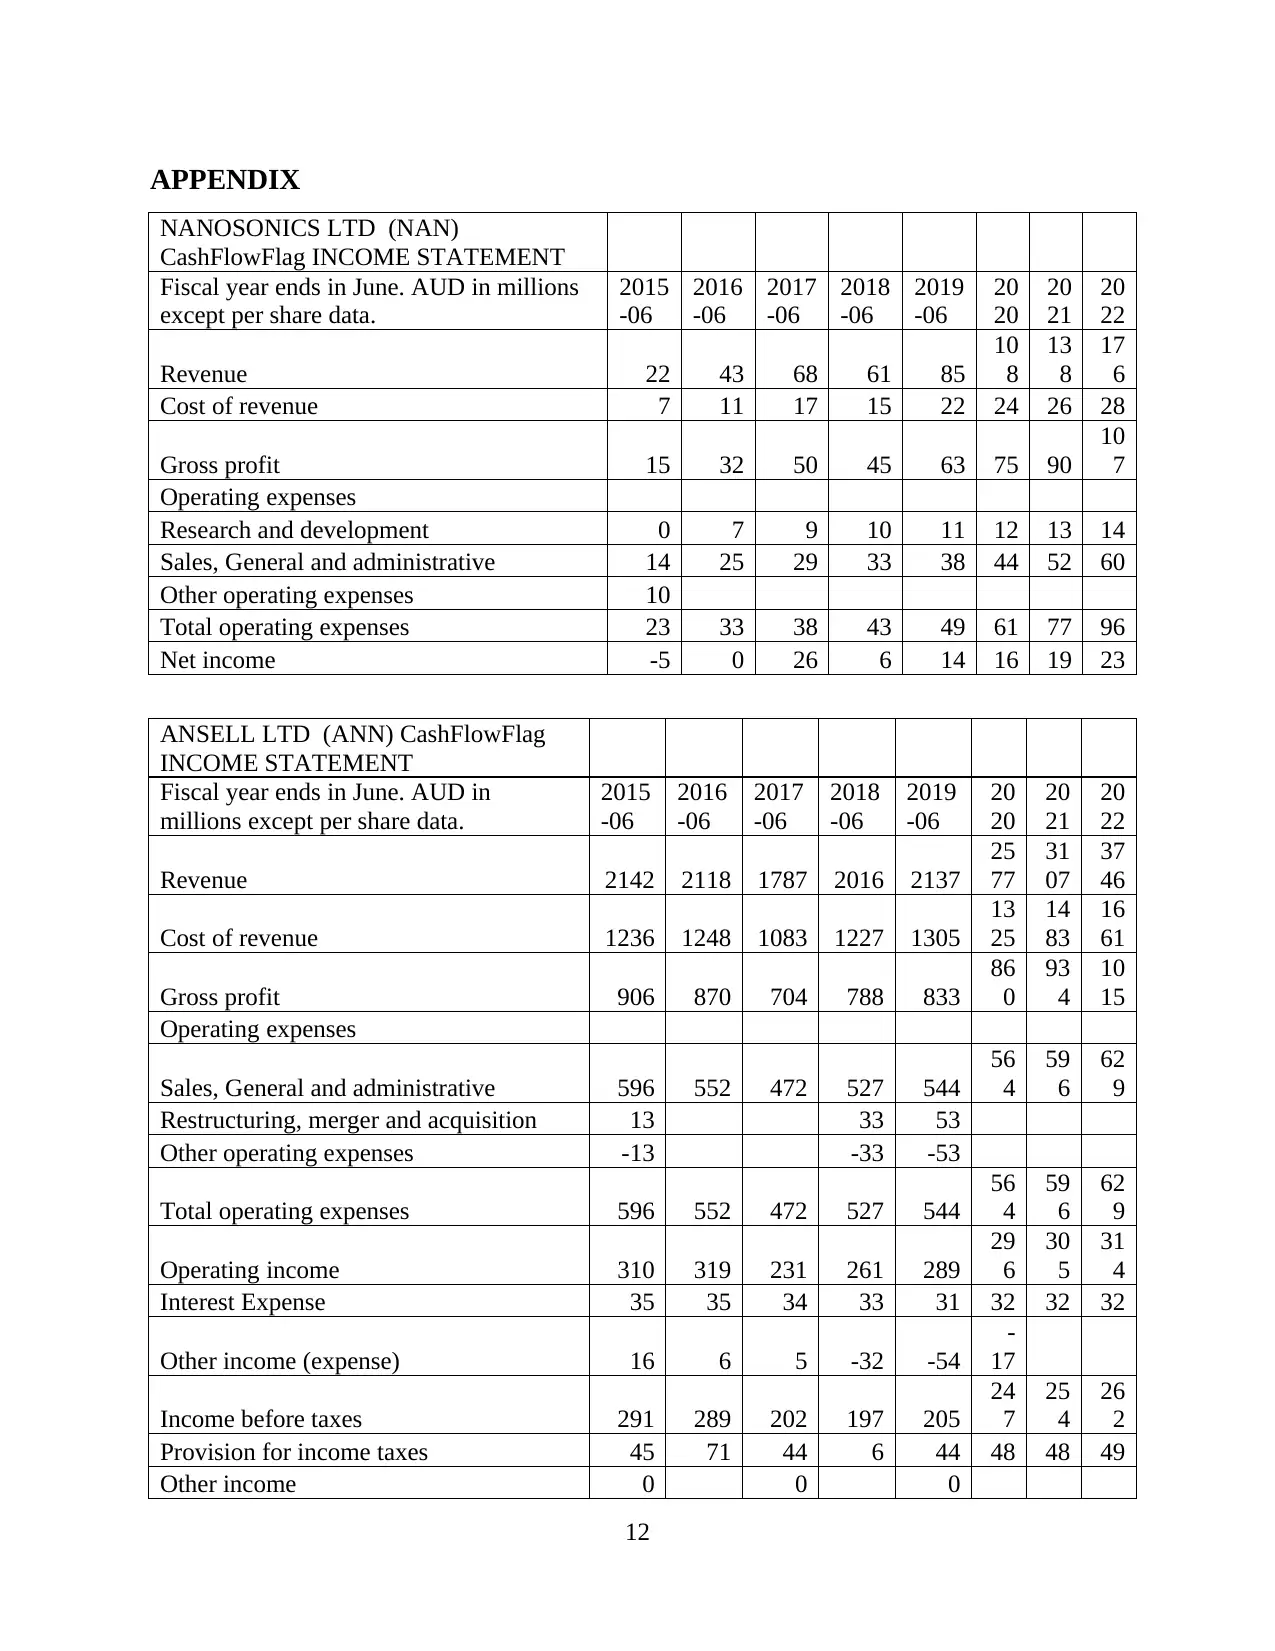
APPENDIX
NANOSONICS LTD (NAN)
CashFlowFlag INCOME STATEMENT
Fiscal year ends in June. AUD in millions
except per share data.
2015
-06
2016
-06
2017
-06
2018
-06
2019
-06
20
20
20
21
20
22
Revenue 22 43 68 61 85
10
8
13
8
17
6
Cost of revenue 7 11 17 15 22 24 26 28
Gross profit 15 32 50 45 63 75 90
10
7
Operating expenses
Research and development 0 7 9 10 11 12 13 14
Sales, General and administrative 14 25 29 33 38 44 52 60
Other operating expenses 10
Total operating expenses 23 33 38 43 49 61 77 96
Net income -5 0 26 6 14 16 19 23
ANSELL LTD (ANN) CashFlowFlag
INCOME STATEMENT
Fiscal year ends in June. AUD in
millions except per share data.
2015
-06
2016
-06
2017
-06
2018
-06
2019
-06
20
20
20
21
20
22
Revenue 2142 2118 1787 2016 2137
25
77
31
07
37
46
Cost of revenue 1236 1248 1083 1227 1305
13
25
14
83
16
61
Gross profit 906 870 704 788 833
86
0
93
4
10
15
Operating expenses
Sales, General and administrative 596 552 472 527 544
56
4
59
6
62
9
Restructuring, merger and acquisition 13 33 53
Other operating expenses -13 -33 -53
Total operating expenses 596 552 472 527 544
56
4
59
6
62
9
Operating income 310 319 231 261 289
29
6
30
5
31
4
Interest Expense 35 35 34 33 31 32 32 32
Other income (expense) 16 6 5 -32 -54
-
17
Income before taxes 291 289 202 197 205
24
7
25
4
26
2
Provision for income taxes 45 71 44 6 44 48 48 49
Other income 0 0 0
12
⊘ This is a preview!⊘
Do you want full access?
Subscribe today to unlock all pages.
Trusted by 1+ million students worldwide
1 out of 15
Related Documents


Your All-in-One AI-Powered Toolkit for Academic Success.
+13062052269
info@desklib.com
Available 24*7 on WhatsApp / Email
![[object Object]](/_next/static/media/star-bottom.7253800d.svg)
Unlock your academic potential
Copyright © 2020–2026 A2Z Services. All Rights Reserved. Developed and managed by ZUCOL.