Equity Techniques, Efficient Market Hypothesis and Virtual Trading
VerifiedAdded on 2023/06/08
|19
|4104
|267
Report
AI Summary
This report explores various equity techniques and strategies within the context of financial management. It details a virtual trade involving a SGD 100,000 investment split across two portfolios, each containing 10 stocks. Portfolio 1 utilized technical analysis, focusing on chart patterns and price movements, while Portfolio 2 was constructed based on fundamental analysis, growth prospects, and anticipated corporate actions. The report highlights Portfolio 1's outperformance against the FTSE ST-All Share Index benchmark. Furthermore, it provides a theoretical and empirical overview of the Efficient Market Hypothesis (EMH) and Behavioral Finance, examining their relevance to investment strategies and market behavior. The analysis includes specific stock selections and the rationale behind them, offering a comprehensive view of the trading methodologies employed.
Running head: ADVANCED FINANCIAL MANAGEMENT
Advanced Financial Management
Name of the Student:
Name of the University:
Author’s Note:
Advanced Financial Management
Name of the Student:
Name of the University:
Author’s Note:
Paraphrase This Document
Need a fresh take? Get an instant paraphrase of this document with our AI Paraphraser
ADVANCED FINANCIAL MANAGEMENT 1
Executive Summary:
The aim of this report is to understand the different equity techniques and strategies. A virtual
trade was executed where a notional amount SGD 100,000 was invested in two portfolio, which
had 10 stocks in the respective portfolio. Portfolio 1 composed of stocks, which had good
technical charts and pattern to support the price movement. Portfolio 2 comprised of stocks
based on the fundamentals and growth of the company and certain news, corporate action, which
were to bring about turnaround in the companies. Portfolio 1 had outperformed the benchmark
index of FTSE ST-All share Index. A brief about the theoretical and empirical evidence of
efficient market hypothesis and behavioral finance was also justified in the report.
ADVANCED FINANCIAL MANAGEMENT 2
Table of Contents
Introduction......................................................................................................................................3
Literature Review............................................................................................................................4
Theoretical and empirical evidence of Efficient Market Hypothesis..........................................4
Theoretical and Empirical evidence of Behavioral Finance........................................................5
Rational and Methodology..............................................................................................................6
Results and Analysis........................................................................................................................8
Portfolio 1....................................................................................................................................8
Portfolio 2....................................................................................................................................9
Conclusion.....................................................................................................................................11
Reference.......................................................................................................................................12
Appendix........................................................................................................................................13
⊘ This is a preview!⊘
Do you want full access?
Subscribe today to unlock all pages.
Trusted by 1+ million students worldwide
ADVANCED FINANCIAL MANAGEMENT 3
Introduction
There are different strategies and ways from which one can trade on stocks. It is the
different Investment strategies, which brings together fundamental and technical analysis in the
common ground. Some of the common strategy used while constituting the portfolio are Day
Trading where the trading strategy gives emphasis on the technical factors of a stock and the
quick responses to the stock at a given point of time. For successful day trading of equity stocks,
one must buy and sell stocks in the same day. This type of trading is common amongst the
professional trader who usually trade in the stock whenever there is a news, report or any
technical pattern involved with the stock. Momentum Trading where the equity trading strategy
involves buying or short selling stock for a certain period. The trading strategy combines both
fundamental and technical factors (Hoffmann & Shefrin 2014).
Volume Breakout strategy shows the dispersion of volumes in the stock, as soon there is
a larger number of volumes abnormality observed a trade can be executed depending on the
movement of the stock. Four*Four Strategy is the strategy which shows that after four
continuous falling trend in share price of the company after there is a upside in the script. After
every such pattern, a trade gets identified and executed (Wei, Cheng & Wu, 2014).
There were other strategies even which were used to identify the trade and execute the
trade like the price momentum, volume breakout strategy, fundamentals, growth and outlook of
the company were some of the several factors taken into consideration. Portfolio 1 was able to
beat and outperform the market, which was on the technical support and analysis of the stock
(Kevin, 2015).
Paraphrase This Document
Need a fresh take? Get an instant paraphrase of this document with our AI Paraphraser
ADVANCED FINANCIAL MANAGEMENT 4
Literature Review
Theoretical and Empirical evidence of Efficient Market Hypothesis.
The term refers to the incorporation of all information about investment and financial
securities, which includes stocks and bonds. The current price of the gets incorporated with all
the latest information and news. If the theory stays true then no analysis or information can help
an investor earn more with respect to others. The theory shows rational behavior of the market as
a whole and not the investors where the market acts proactively and incorporates each and every
relevant news and information. There are different forms of efficient market hypothesis, which
includes weak form of market hypothesis, semi-string and strong form of hypothesis (Suliman,
2017).
Weak Form Hypothesis: The hypothesis states that all the past reports, informations and
news are reflected in the securities. In this type of market, fundamental analysis can help
an investor earn above market rate of return. Technical Analysis plays no or little role in
this type of market (Erdem, 2017).
Semi-Strong Market Hypothesis: In this form of market, neither fundamental nor the
technical analysis can provide above market return to an investors. Every information,
report and details are already reflected in the security. All publically available
information is reflected in the securities (Suliman, 2017).
Strong Form Market Hypothesis: Securities are priced with all the public and private
information and none of the investors can influence the price of the securities. Abnormal
returns are not possible in this type of markets.
ADVANCED FINANCIAL MANAGEMENT 5
Empirical Evidence: Since 1970s, evidence of efficient market hypothesis has been the
key portion of finance and is studied in all prospects. There has been a major development and
improvements in the field of data analytics and advances in the statistical analysis in the models
but these all factors gives less consensus in the validation and existence of the hypothesis. An
efficient market hypothesis always reflect information in the security and it depend on the risk
preference of the investor. Therefore, empirical evidence suggests that the test for the same
should be on both the investors risk profile and preferences and the information reflected in the
security. Information comes with a cost and if the market fully reflects the correct price of the
securities then the information may be not viable. If an investor buys an asset with the
expectation that, the price of the assets will rise tomorrow. Empirical evidence shows that the
price and distribution of the stock price is sub martingale in nature (Hamid, et.al 2017).
Theoretical and Empirical evidence of Behavioral Finance.
Behavioral finance is all about the combination of money and economics. The concept
behind the term is about the preferences one make about the money, which is irrational in nature.
It combines psychology theories with those of personal finance and economics. It is the study of
understanding preferences regarding money in the human psychology, which can influence the
economy directly and indirectly. It also shows the movements in the price of the securities
irrespective of the corporate announcement and actions. It shows how people can influence the
price of the securities in respect to anticipation on an information and knowledge (Grauwe &
Grimaldi, 2018).
The study is crucial as it tells about the human behavior in certain situations. In certain
instances of the tobacco, company where the company share price showed abnormality because
of the certain laws and taxes. Increase of tax rate and rules imposing the ban of such products
⊘ This is a preview!⊘
Do you want full access?
Subscribe today to unlock all pages.
Trusted by 1+ million students worldwide
ADVANCED FINANCIAL MANAGEMENT 6
may harm the production of the company and this had implied a massive fall in the share price of
the company. Since, the investors are aware of the past events, which had led to drop in the share
price of the company and if such taxes and regulations are imposed on, the company it will again
make the investors sell their shares. This perception of past happenings in the current scenario
affects not only a particular company but also to a group of other companies who are in the same
industry (Bondt, et.al 2015).
Rational and Methodology
There were several steps and strategies used for selection of the stocks these strategies
were used and applied and trades were executed on that behalf. Portfolio. The SGD 100,000$
was invested on the ratio of 50:50 where stocks in Portfolio 1 were selected based on the
technical charts and analysis done. The period for the Investment selected were between 4 June
2018 and 24 August 2018. Portfolio was based on the strategies of Fundamental Analysis and the
growth and outlook of the companies (Ahmad & Aljifri, 2018).
Stocks in Portfolio 1 mainly used technical analysis and strategies such as four*four
strategy where a script were selected on the basis of the rising share price followed by four
consecutive down trend a trend was identified in the Capital Land Ltd which gave a return of
13.06% (Edwards, Magee & Bassetti, 2018). The Price volatility strategy was used where the
stocks showed price abnormality and the trade was identified and executed. Singtel Ltd in the
telecommunication services were the one where the price volatility strategy were used it
delivered 8.28% (Patel et.al 2015). Several stocks were selected based on the technical strategies
identified and executed. Stocks where such trades were identified are Capital Land Ltd, OCBC
Bank Ltd, Capital Land commercial trust and Genting Singapore were some of the stocks in the
Portfolio 1 where technical analysis strategies were used (Nazário, et.al 2017).
Paraphrase This Document
Need a fresh take? Get an instant paraphrase of this document with our AI Paraphraser
ADVANCED FINANCIAL MANAGEMENT 7
Stocks in Portfolio 2 was selected based on fundamental analysis of the stock. The stocks
were chosen for the positive outlook and turnaround in the company (Deshpande, 2017). Sats Ltd
was one of them where the positive alignment of growth and turnaround in the operations of the
company. Capital Land Mall Trust got selected on the scale of their great results, divestments
and the positive outlook of the company (Mellen & Evans, 2018). Whereas companies like
Ascendas Real Estate Investment Trust was selected because of their stable operations and the
growth of the real estate sector. Sectorial investment strategy were used and diversification was
done by investing in sectors like consumer discretionary and capital goods. Portfolio 2 had
around 25% of the investment were done on scripts like Sembercorp Industries Ltd, Jardine
Cycle and Carriage Ltd and Yangzijiang Shipbuilding Holdings ltd. Stocks like Comfort Delgro
Corporation Ltd was chosen because of the organic and inorganic growth strategies the company
were deploying (Kaizoji & Miyano, 2017).
ADVANCED FINANCIAL MANAGEMENT 8
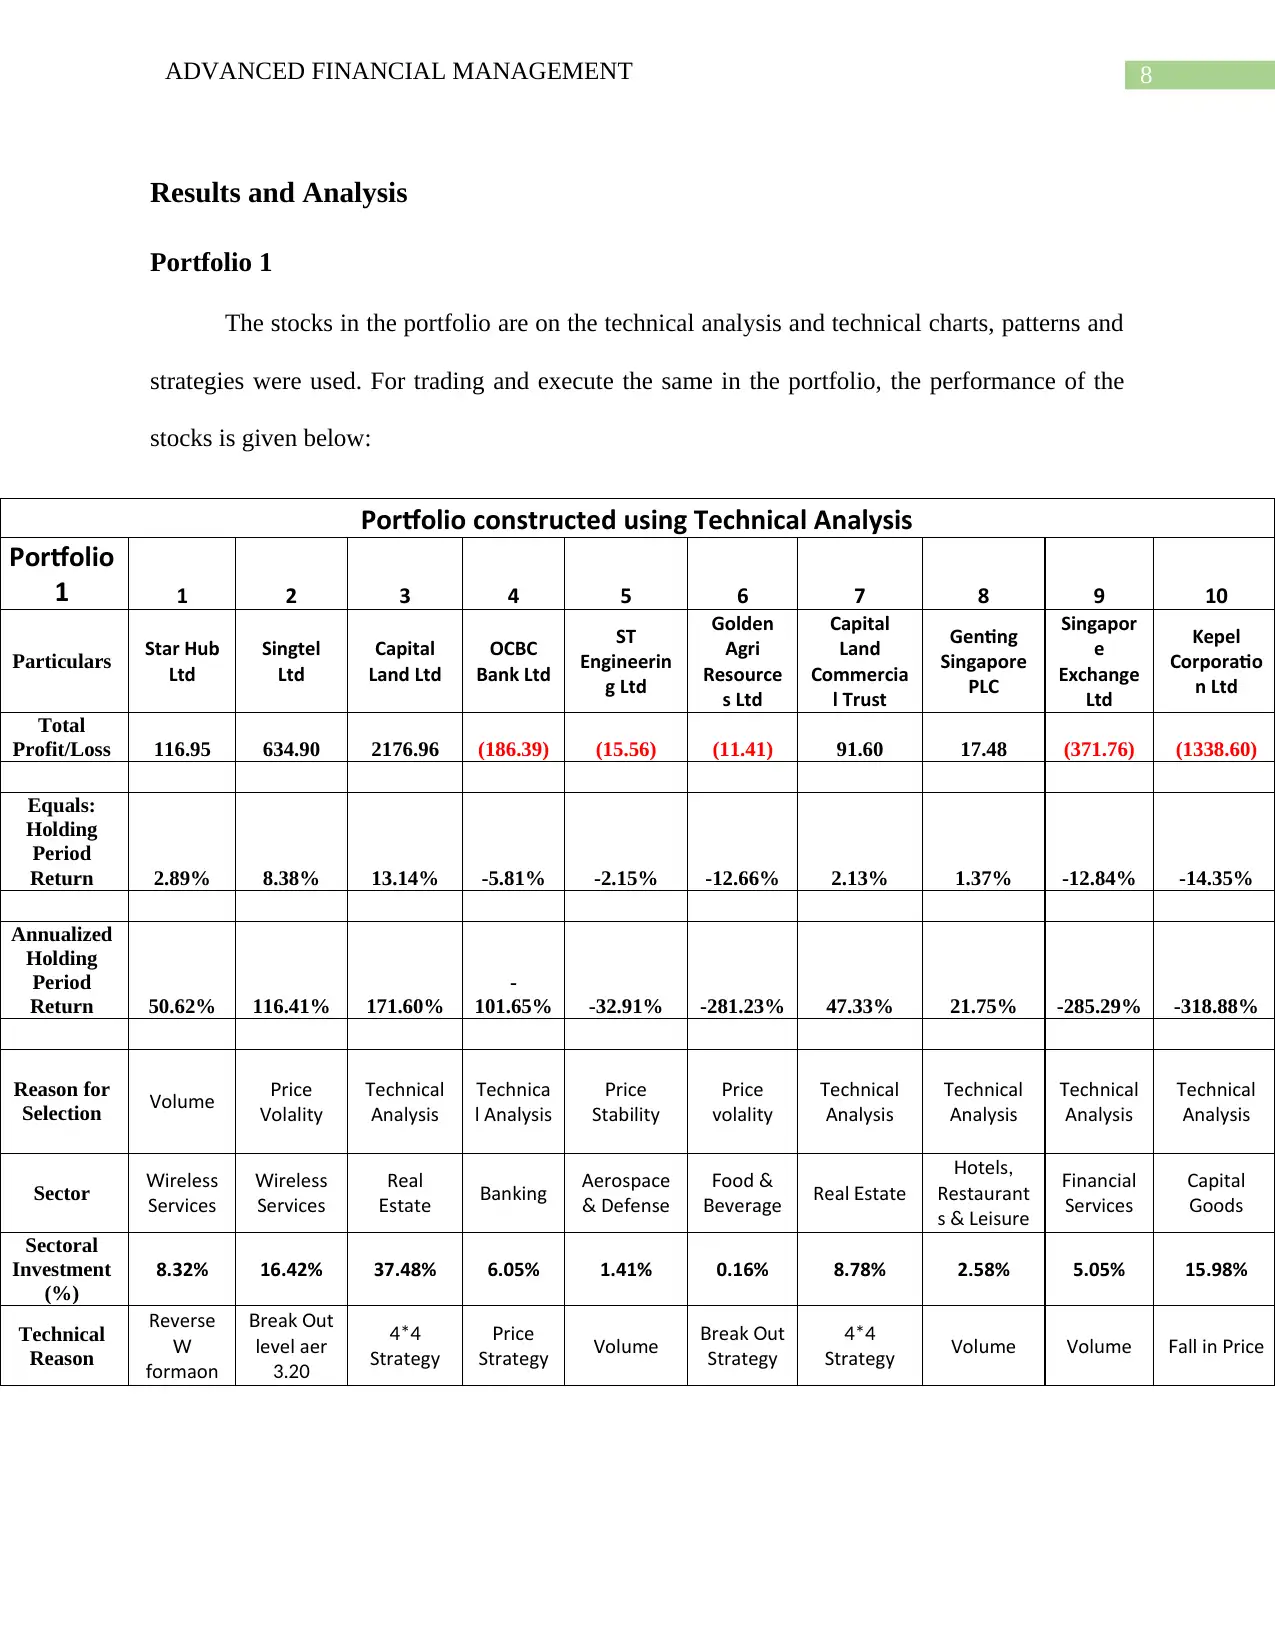
Results and Analysis
Portfolio 1
The stocks in the portfolio are on the technical analysis and technical charts, patterns and
strategies were used. For trading and execute the same in the portfolio, the performance of the
stocks is given below:
Portfolio constructed using Technical Analysis
Portfolio
1 1 2 3 4 5 6 7 8 9 10
Particulars Star Hub
Ltd
Singtel
Ltd
Capital
Land Ltd
OCBC
Bank Ltd
ST
Engineerin
g Ltd
Golden
Agri
Resource
s Ltd
Capital
Land
Commercia
l Trust
Genting
Singapore
PLC
Singapor
e
Exchange
Ltd
Kepel
Corporatio
n Ltd
Total
Profit/Loss 116.95 634.90 2176.96 (186.39) (15.56) (11.41) 91.60 17.48 (371.76) (1338.60)
Equals:
Holding
Period
Return 2.89% 8.38% 13.14% -5.81% -2.15% -12.66% 2.13% 1.37% -12.84% -14.35%
Annualized
Holding
Period
Return 50.62% 116.41% 171.60%
-
101.65% -32.91% -281.23% 47.33% 21.75% -285.29% -318.88%
Reason for
Selection Volume riceP
Volatility
echnicalT
Analysis
echnicaT
l Analysis
riceP
Stability
riceP
volatility
echnicalT
Analysis
echnicalT
Analysis
echnicalT
Analysis
echnicalT
Analysis
Sector irelessW
Services
irelessW
Services
Real
stateE ankingB Aerospace
Defense&
oodF &
everageB Real stateE
otelsH ,
Restaurant
s eisure& L
inancialF
Services
Capital
oodsG
Sectoral
Investment
(%)
8.32% 16.42% 37.48% 6.05% 1.41% 0.16% 8.78% 2.58% 5.05% 15.98%
Technical
Reason
Reverse
W
formation
reak utB O
level after
3.20
4*4
Strategy
riceP
Strategy Volume reak utB O
Strategy
4*4
Strategy Volume Volume all in riceF P
⊘ This is a preview!⊘
Do you want full access?
Subscribe today to unlock all pages.
Trusted by 1+ million students worldwide
ADVANCED FINANCIAL MANAGEMENT 9
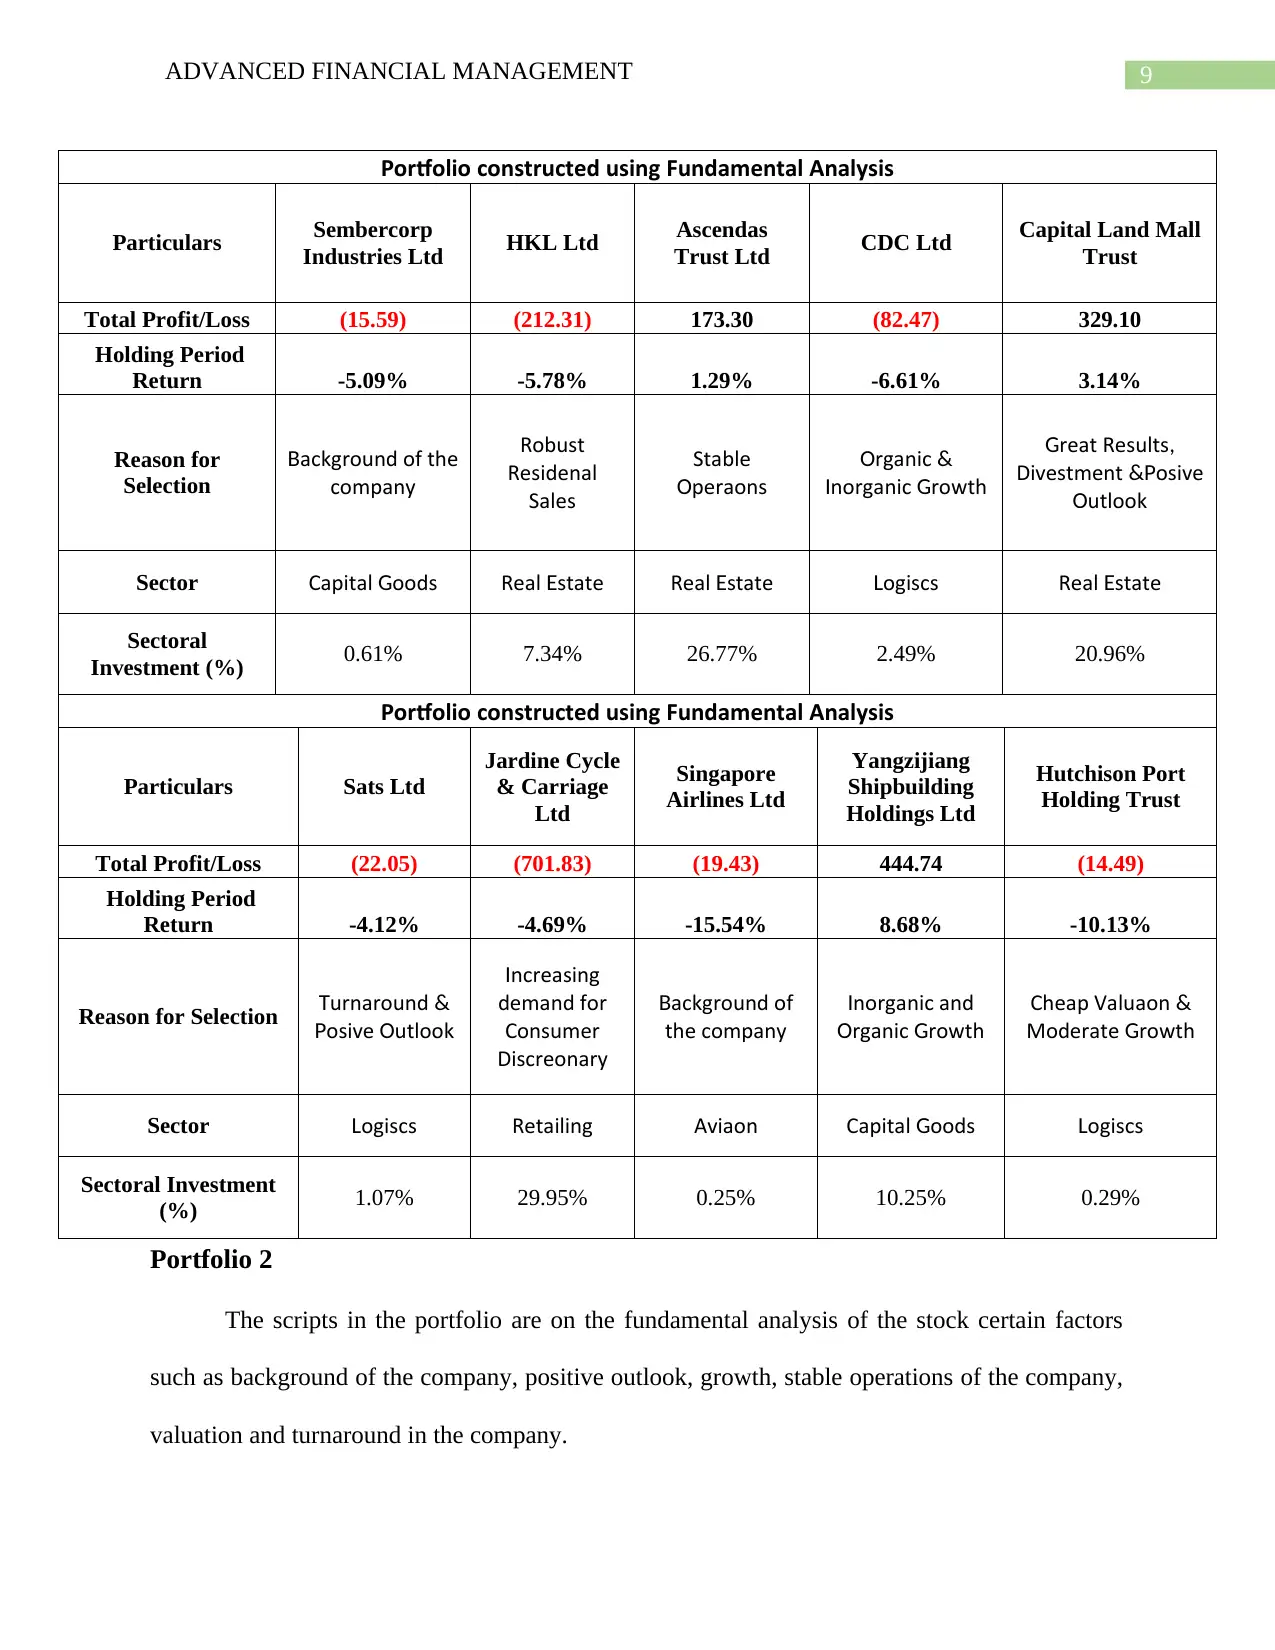
Portfolio constructed using Fundamental Analysis
Particulars Sembercorp
Industries Ltd HKL Ltd Ascendas
Trust Ltd CDC Ltd Capital Land Mall
Trust
Total Profit/Loss (15.59) (212.31) 173.30 (82.47) 329.10
Holding Period
Return -5.09% -5.78% 1.29% -6.61% 3.14%
Reason for
Selection
ackground of theB
company
Robust
Residential
Sales
Stable
perationsO
rganicO &
norganic rowthI G
reat ResultsG ,
Divestment ositive&P
utlookO
Sector Capital oodsG Real stateE Real stateE ogisticsL Real stateE
Sectoral
Investment (%) 0.61% 7.34% 26.77% 2.49% 20.96%
Portfolio constructed using Fundamental Analysis
Particulars Sats Ltd
Jardine Cycle
& Carriage
Ltd
Singapore
Airlines Ltd
Yangzijiang
Shipbuilding
Holdings Ltd
Hutchison Port
Holding Trust
Total Profit/Loss (22.05) (701.83) (19.43) 444.74 (14.49)
Holding Period
Return -4.12% -4.69% -15.54% 8.68% -10.13%
Reason for Selection urnaroundT &
ositive utlookP O
ncreasingI
demand for
Consumer
Discretionary
ackground ofB
the company
norganic andI
rganic rowthO G
Cheap Valuation &
Moderate rowthG
Sector ogisticsL Retailing Aviation Capital oodsG ogisticsL
Sectoral Investment
(%) 1.07% 29.95% 0.25% 10.25% 0.29%
Portfolio 2
The scripts in the portfolio are on the fundamental analysis of the stock certain factors
such as background of the company, positive outlook, growth, stable operations of the company,
valuation and turnaround in the company.
Portfolio constructed using Fundamental Analysis
Particulars Sembercorp
Industries Ltd HKL Ltd Ascendas
Trust Ltd CDC Ltd Capital Land Mall
Trust
Total Profit/Loss (15.59) (212.31) 173.30 (82.47) 329.10
Holding Period
Return -5.09% -5.78% 1.29% -6.61% 3.14%
Reason for
Selection
ackground of theB
company
Robust
Residential
Sales
Stable
perationsO
rganicO &
norganic rowthI G
reat ResultsG ,
Divestment ositive&P
utlookO
Sector Capital oodsG Real stateE Real stateE ogisticsL Real stateE
Sectoral
Investment (%) 0.61% 7.34% 26.77% 2.49% 20.96%
Portfolio constructed using Fundamental Analysis
Particulars Sats Ltd
Jardine Cycle
& Carriage
Ltd
Singapore
Airlines Ltd
Yangzijiang
Shipbuilding
Holdings Ltd
Hutchison Port
Holding Trust
Total Profit/Loss (22.05) (701.83) (19.43) 444.74 (14.49)
Holding Period
Return -4.12% -4.69% -15.54% 8.68% -10.13%
Reason for Selection urnaroundT &
ositive utlookP O
ncreasingI
demand for
Consumer
Discretionary
ackground ofB
the company
norganic andI
rganic rowthO G
Cheap Valuation &
Moderate rowthG
Sector ogisticsL Retailing Aviation Capital oodsG ogisticsL
Sectoral Investment
(%) 1.07% 29.95% 0.25% 10.25% 0.29%
Portfolio 2
The scripts in the portfolio are on the fundamental analysis of the stock certain factors
such as background of the company, positive outlook, growth, stable operations of the company,
valuation and turnaround in the company.
Paraphrase This Document
Need a fresh take? Get an instant paraphrase of this document with our AI Paraphraser

ADVANCED FINANCIAL MANAGEMENT 10
ADVANCED FINANCIAL MANAGEMENT 11
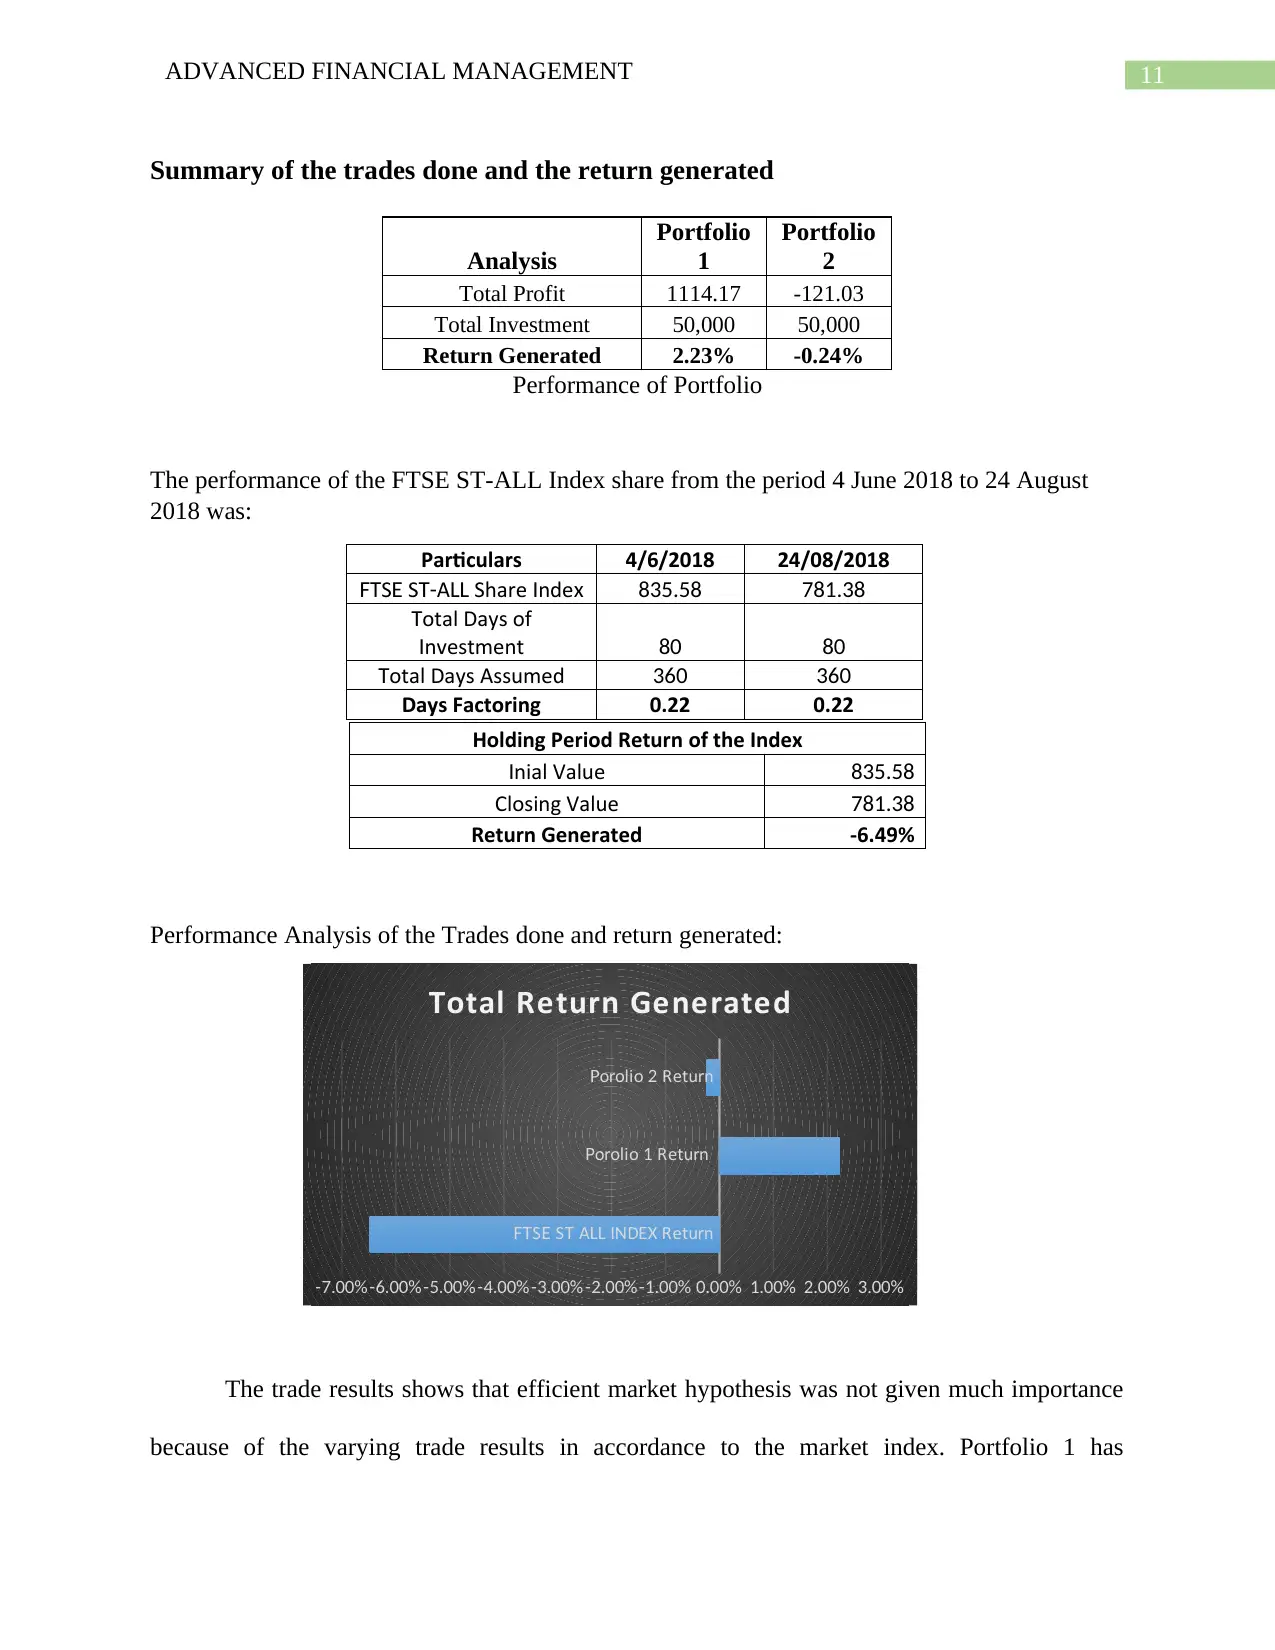
Summary of the trades done and the return generated
Analysis
Portfolio
1
Portfolio
2
Total Profit 1114.17 -121.03
Total Investment 50,000 50,000
Return Generated 2.23% -0.24%
Performance of Portfolio
The performance of the FTSE ST-ALL Index share from the period 4 June 2018 to 24 August
2018 was:
Particulars 4/6/2018 24/08/2018
S S A Share ndeFT E T- LL I x 835.58 781.38
otal Days ofT
nvestmentI 80 80
otal Days AssumedT 360 360
Days Factoring 0.22 0.22
Performance Analysis of the Trades done and return generated:
The trade results shows that efficient market hypothesis was not given much importance
because of the varying trade results in accordance to the market index. Portfolio 1 has
S S A D ReturnFT E T LL IN EX
ortfolio ReturnP 1
ortfolio ReturnP 2
-7.00%-6.00%-5.00%-4.00%-3.00%-2.00%-1.00% 0.00% 1.00% 2.00% 3.00%
Total Return Generated
Holding Period Return of the Index
nitial ValueI 835.58
Closing Value 781.38
Return Generated -6.49%
⊘ This is a preview!⊘
Do you want full access?
Subscribe today to unlock all pages.
Trusted by 1+ million students worldwide
1 out of 19
Related Documents


Your All-in-One AI-Powered Toolkit for Academic Success.
+13062052269
info@desklib.com
Available 24*7 on WhatsApp / Email
![[object Object]](/_next/static/media/star-bottom.7253800d.svg)
Unlock your academic potential
Copyright © 2020–2026 A2Z Services. All Rights Reserved. Developed and managed by ZUCOL.