Preliminary Summative Assignment 1: Equity Valuation of Canadian Tire

Verified

Added on  2022/08/20

|19
|1009
|16
Project
AI Summary
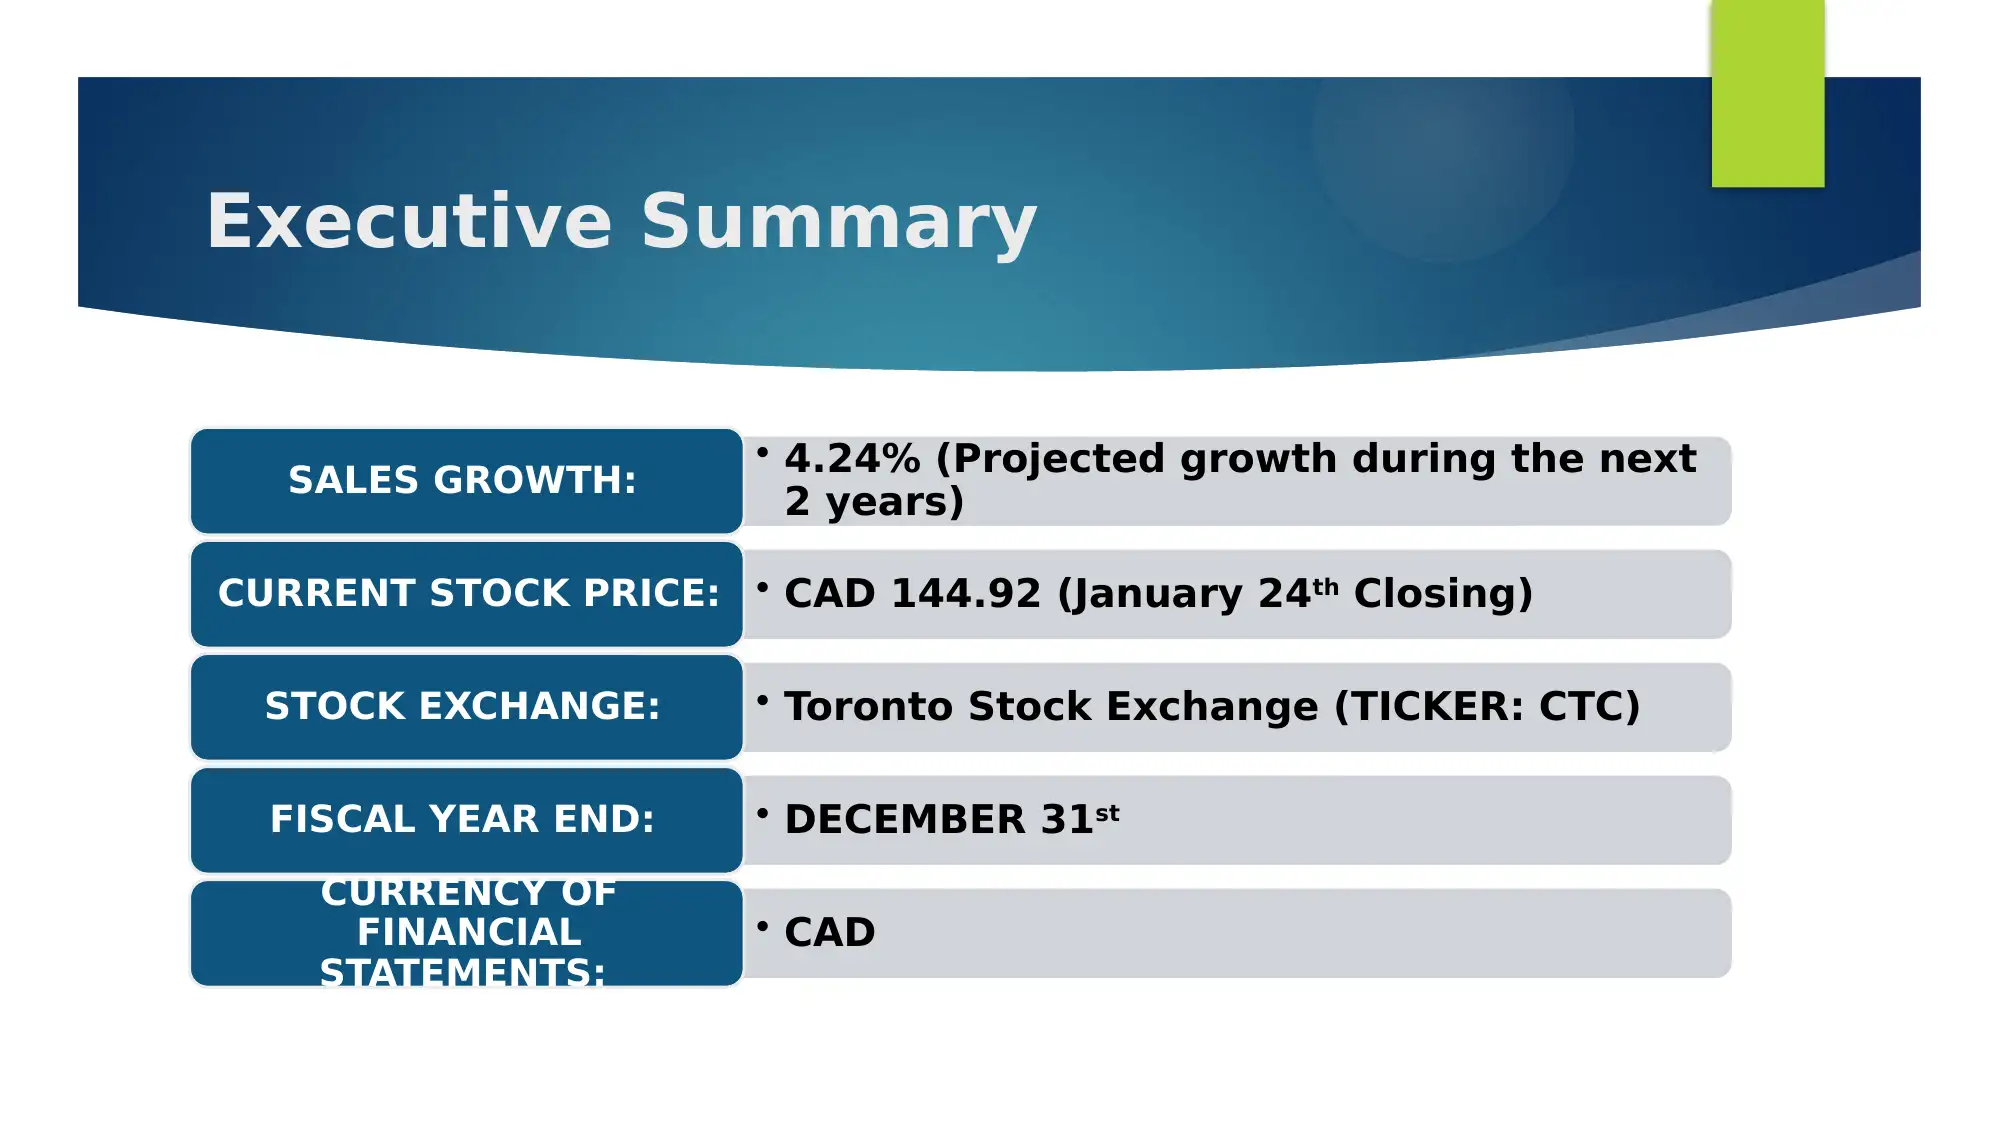
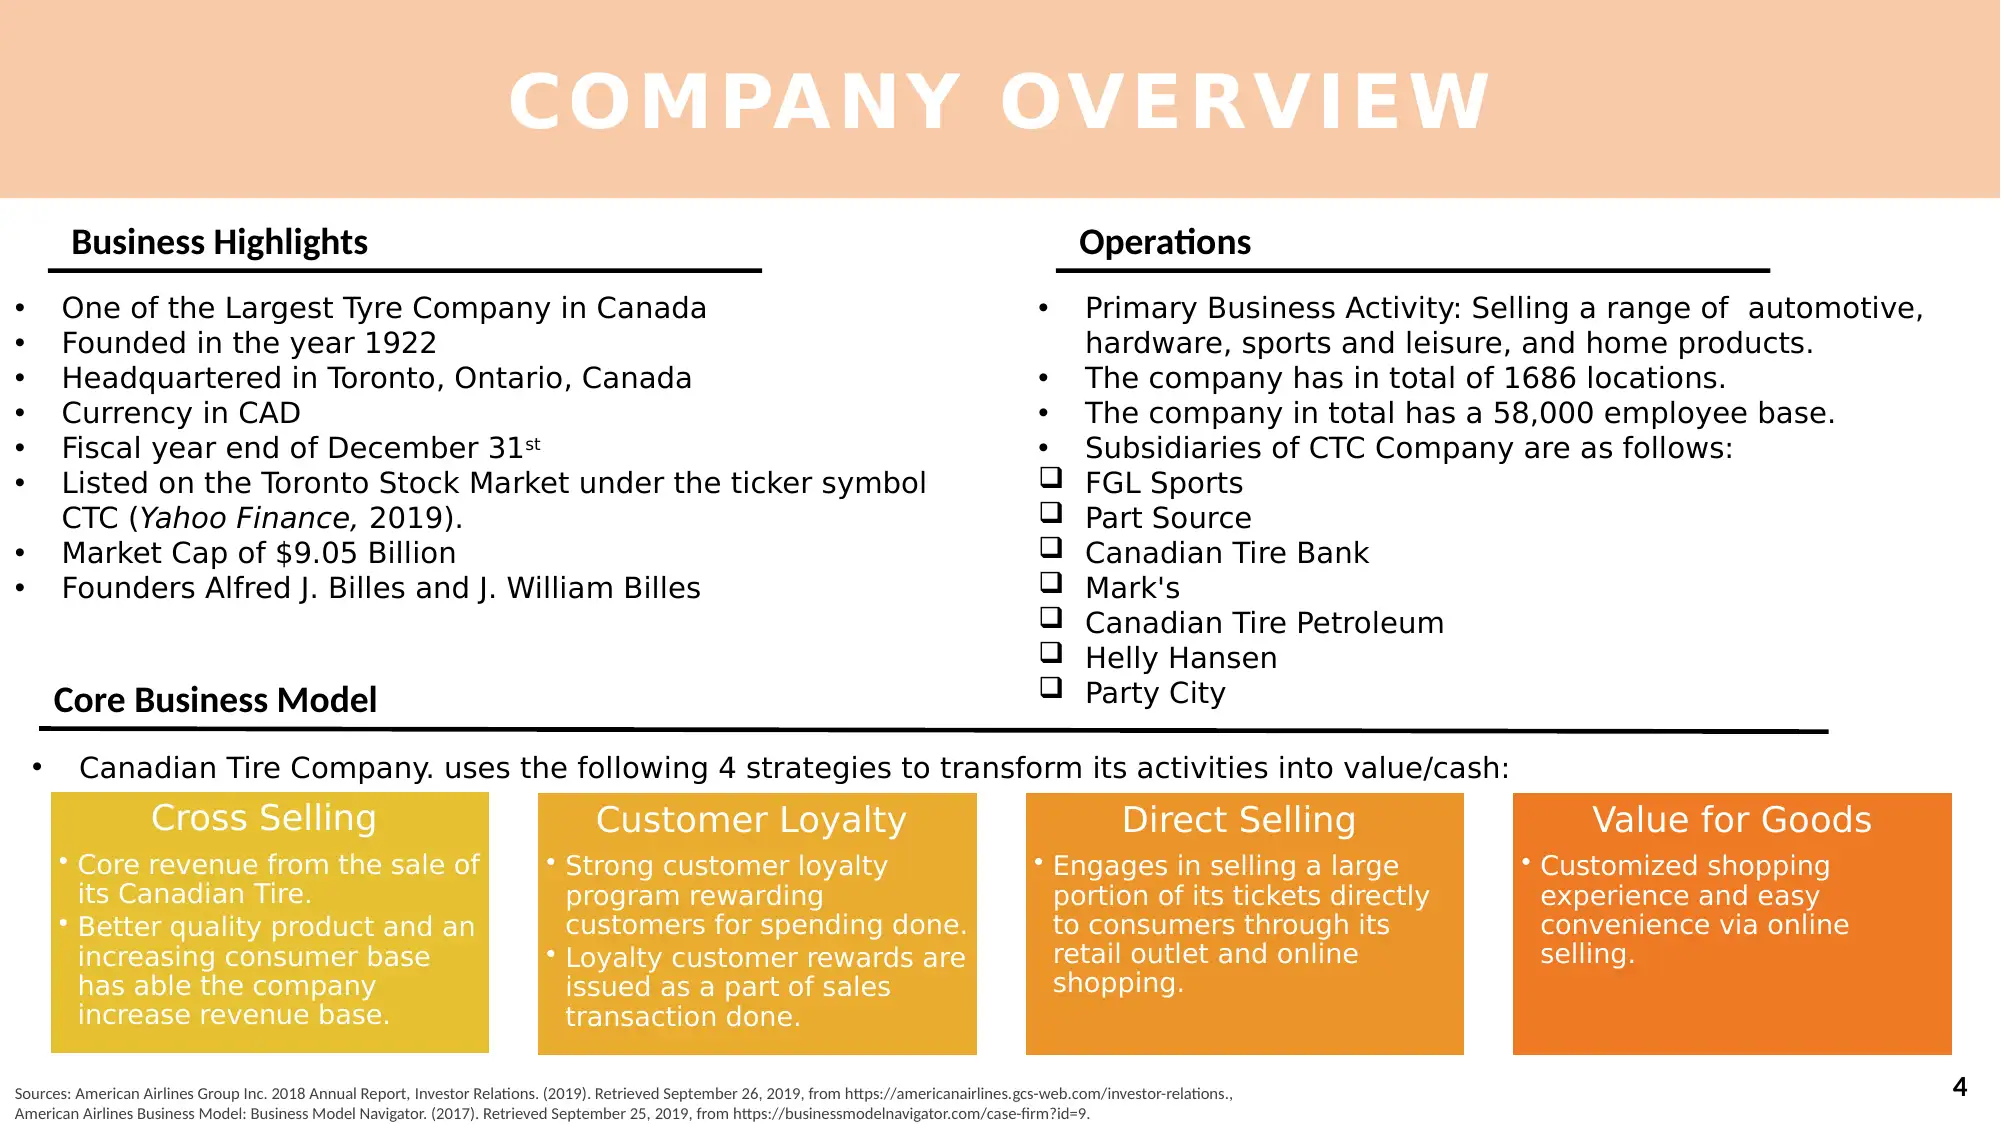
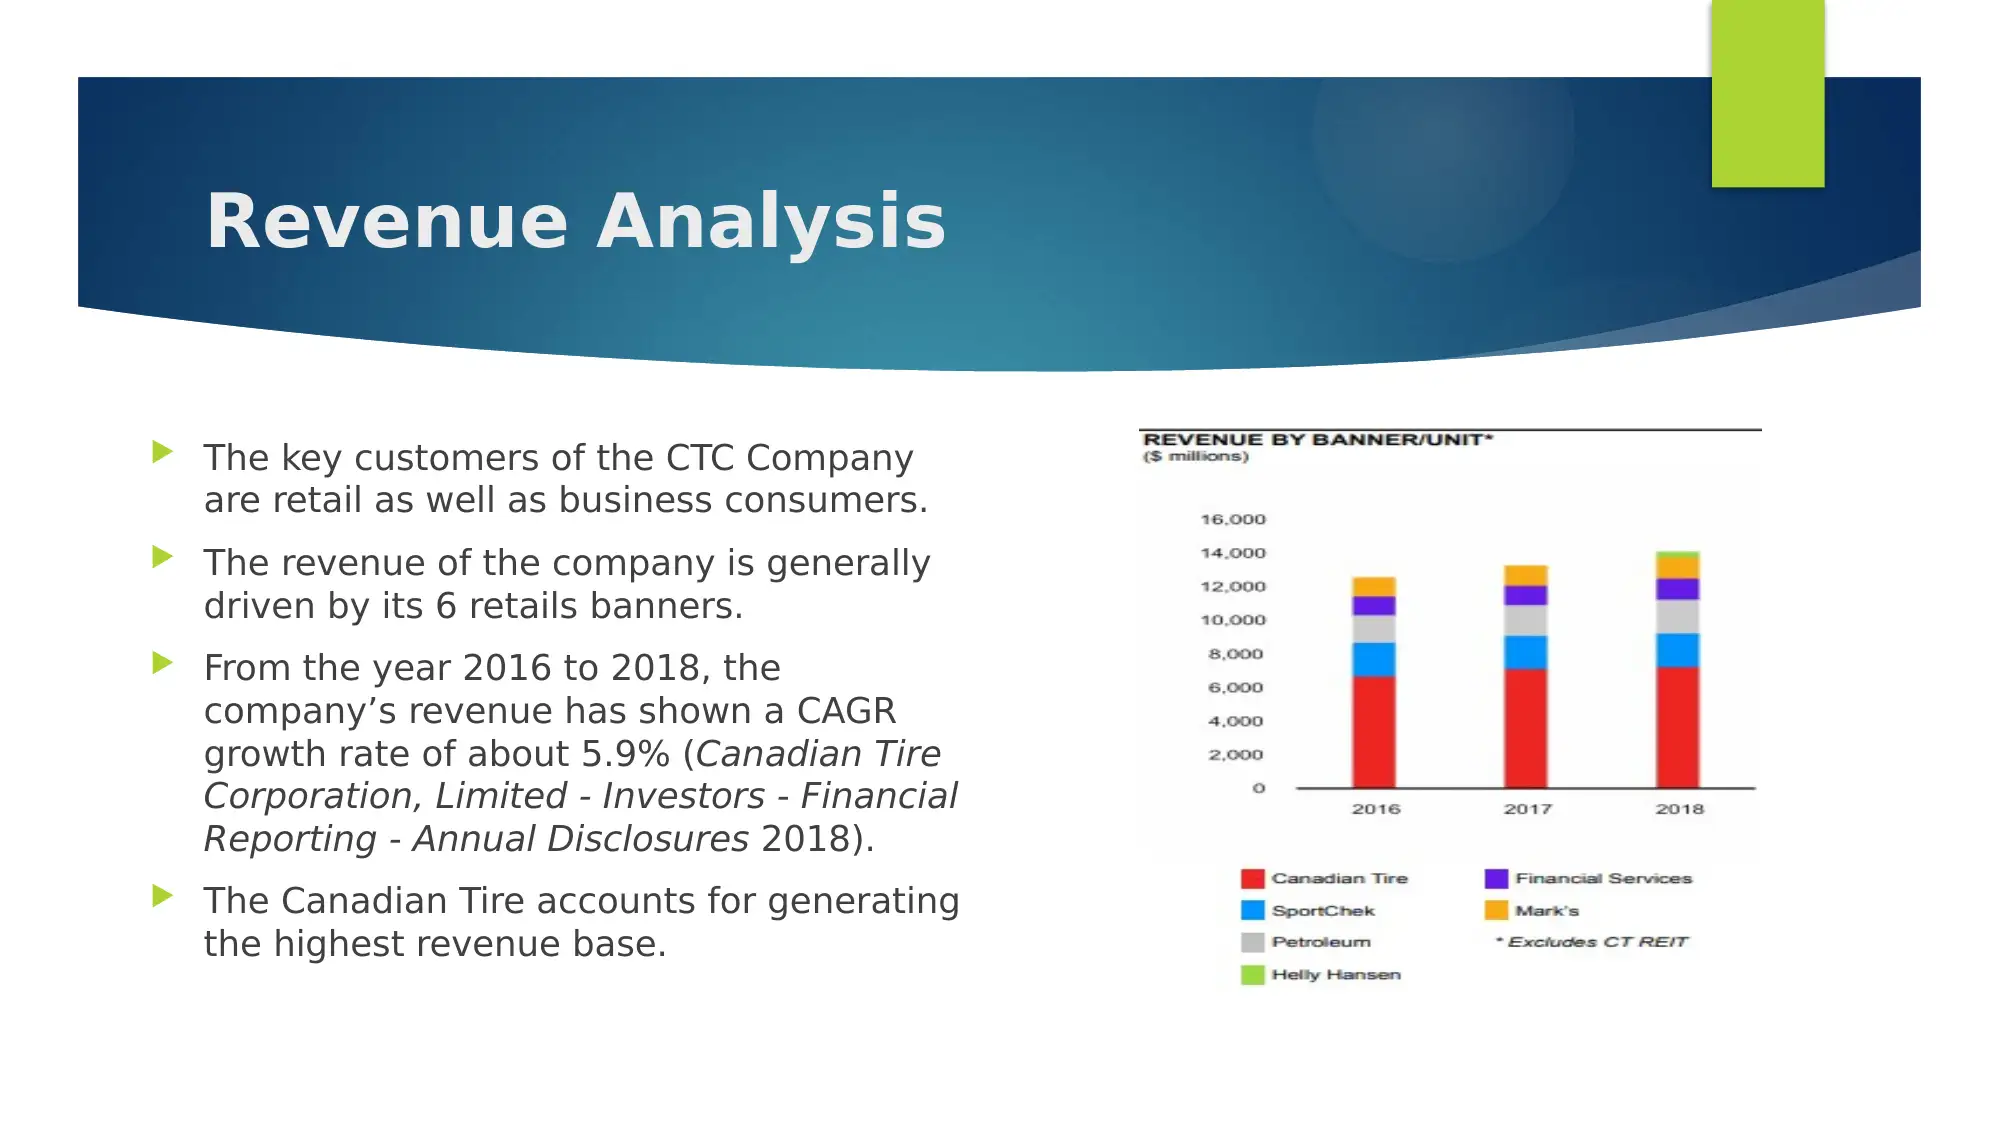
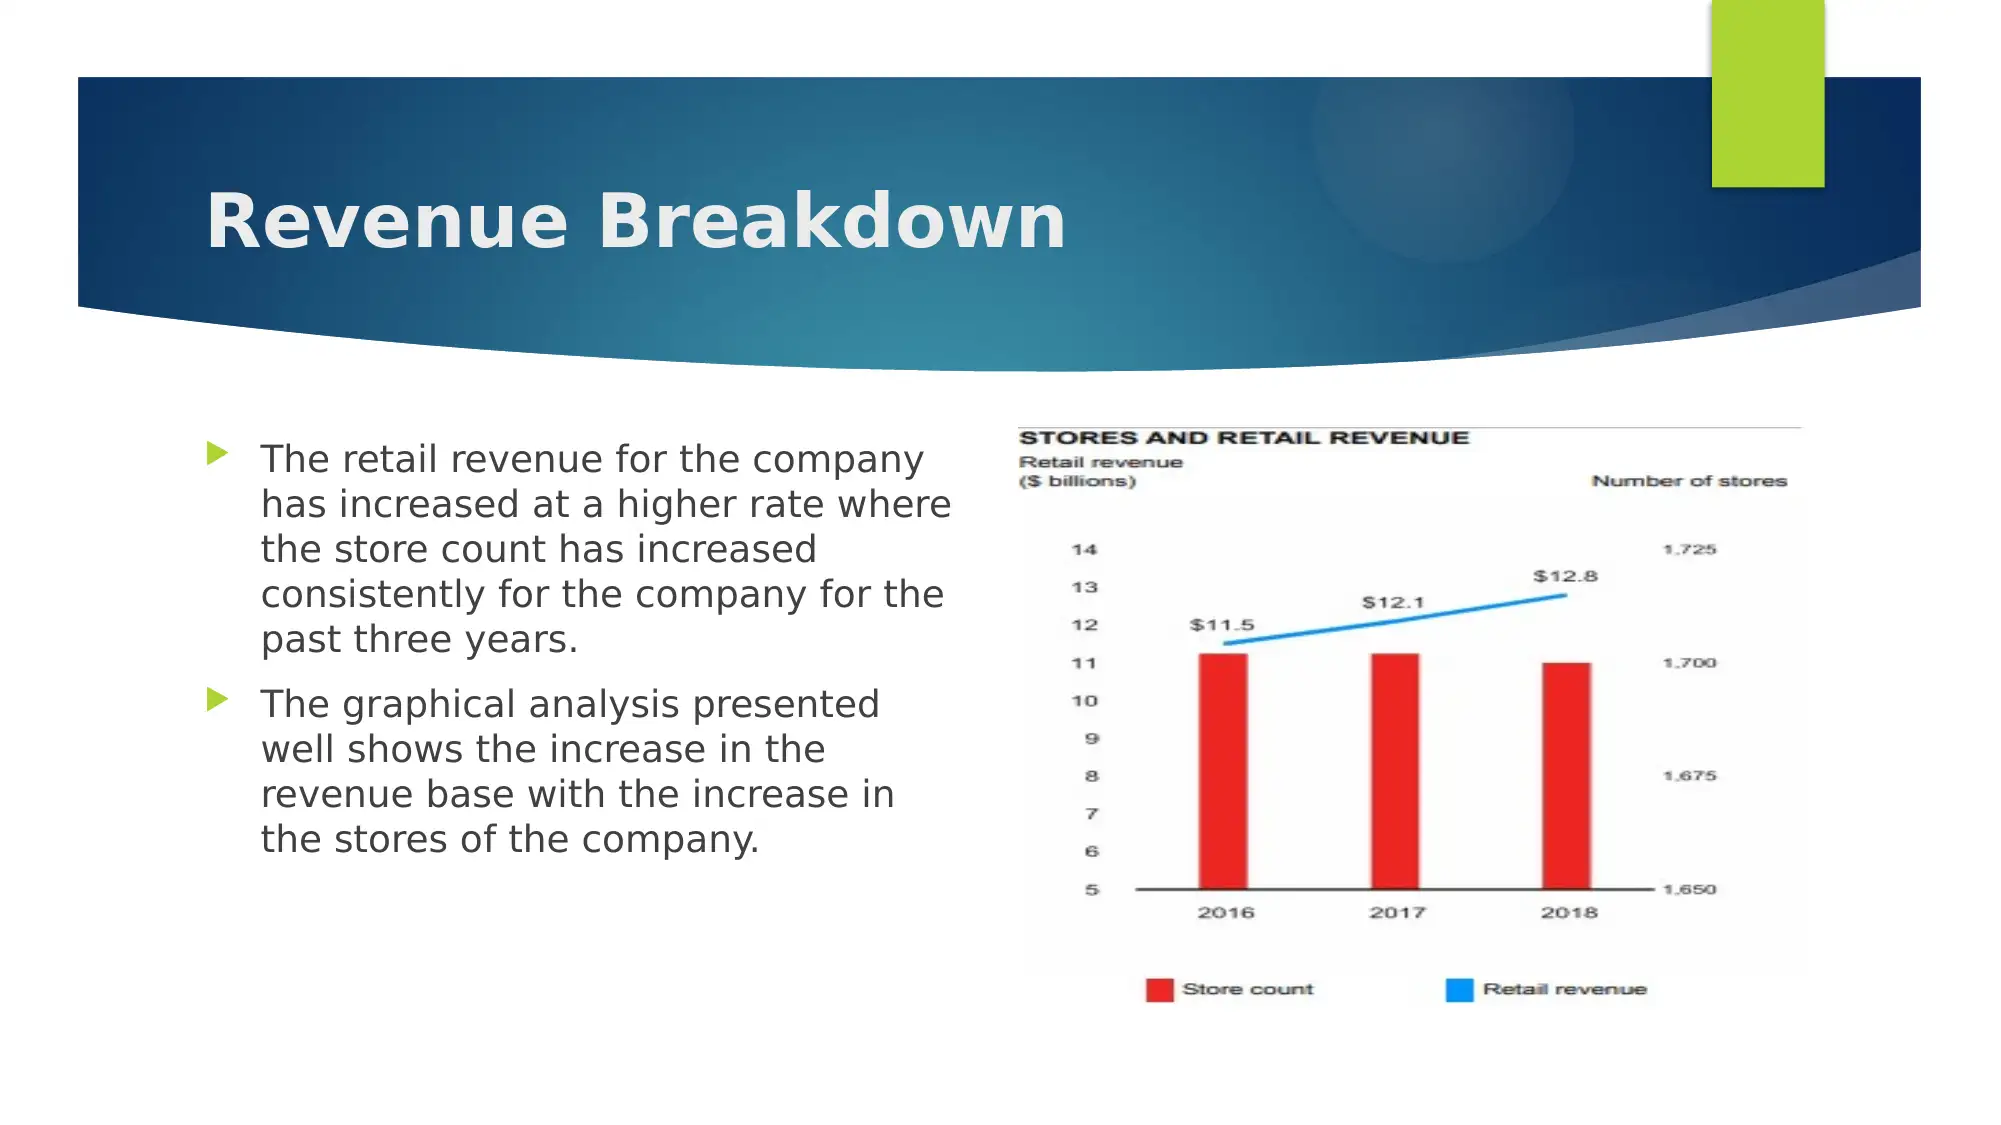
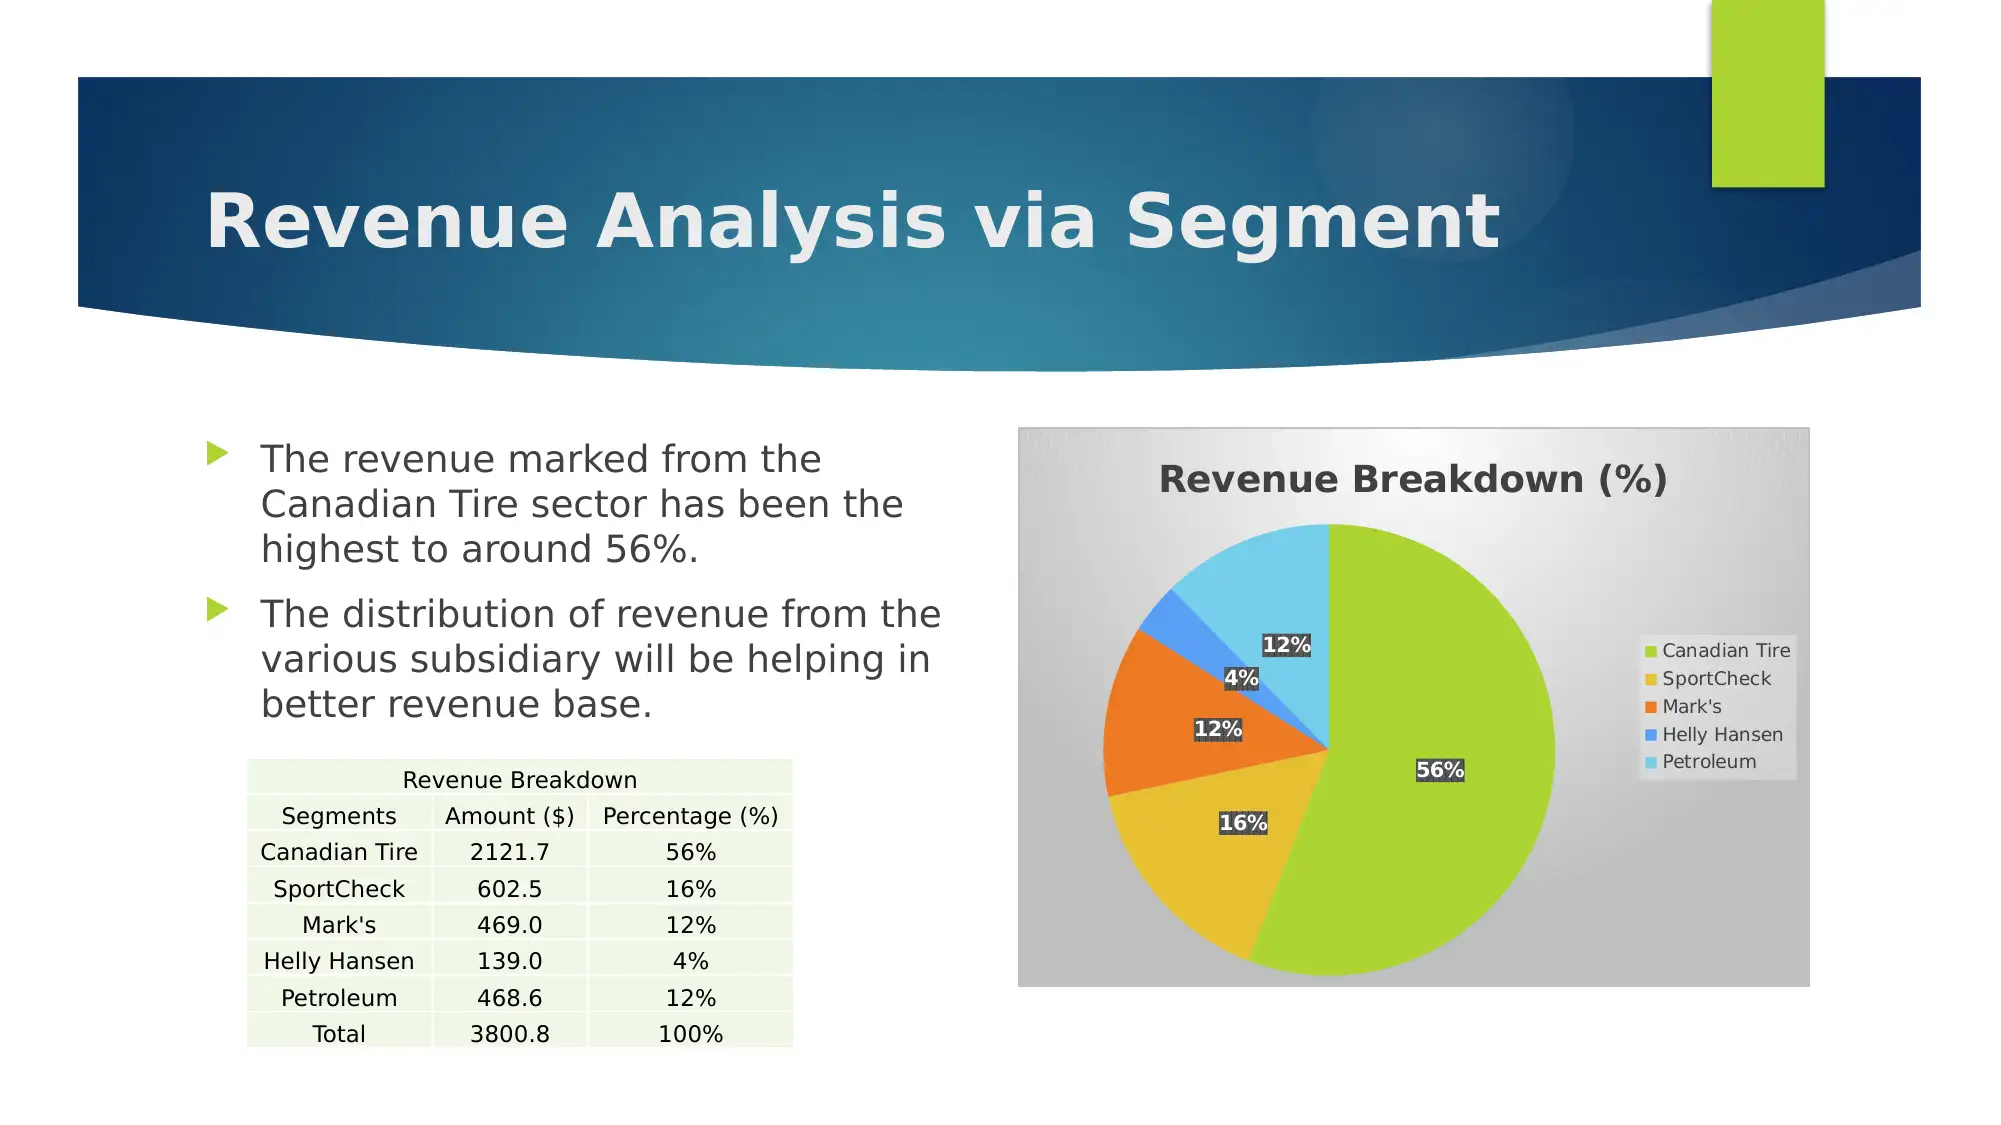
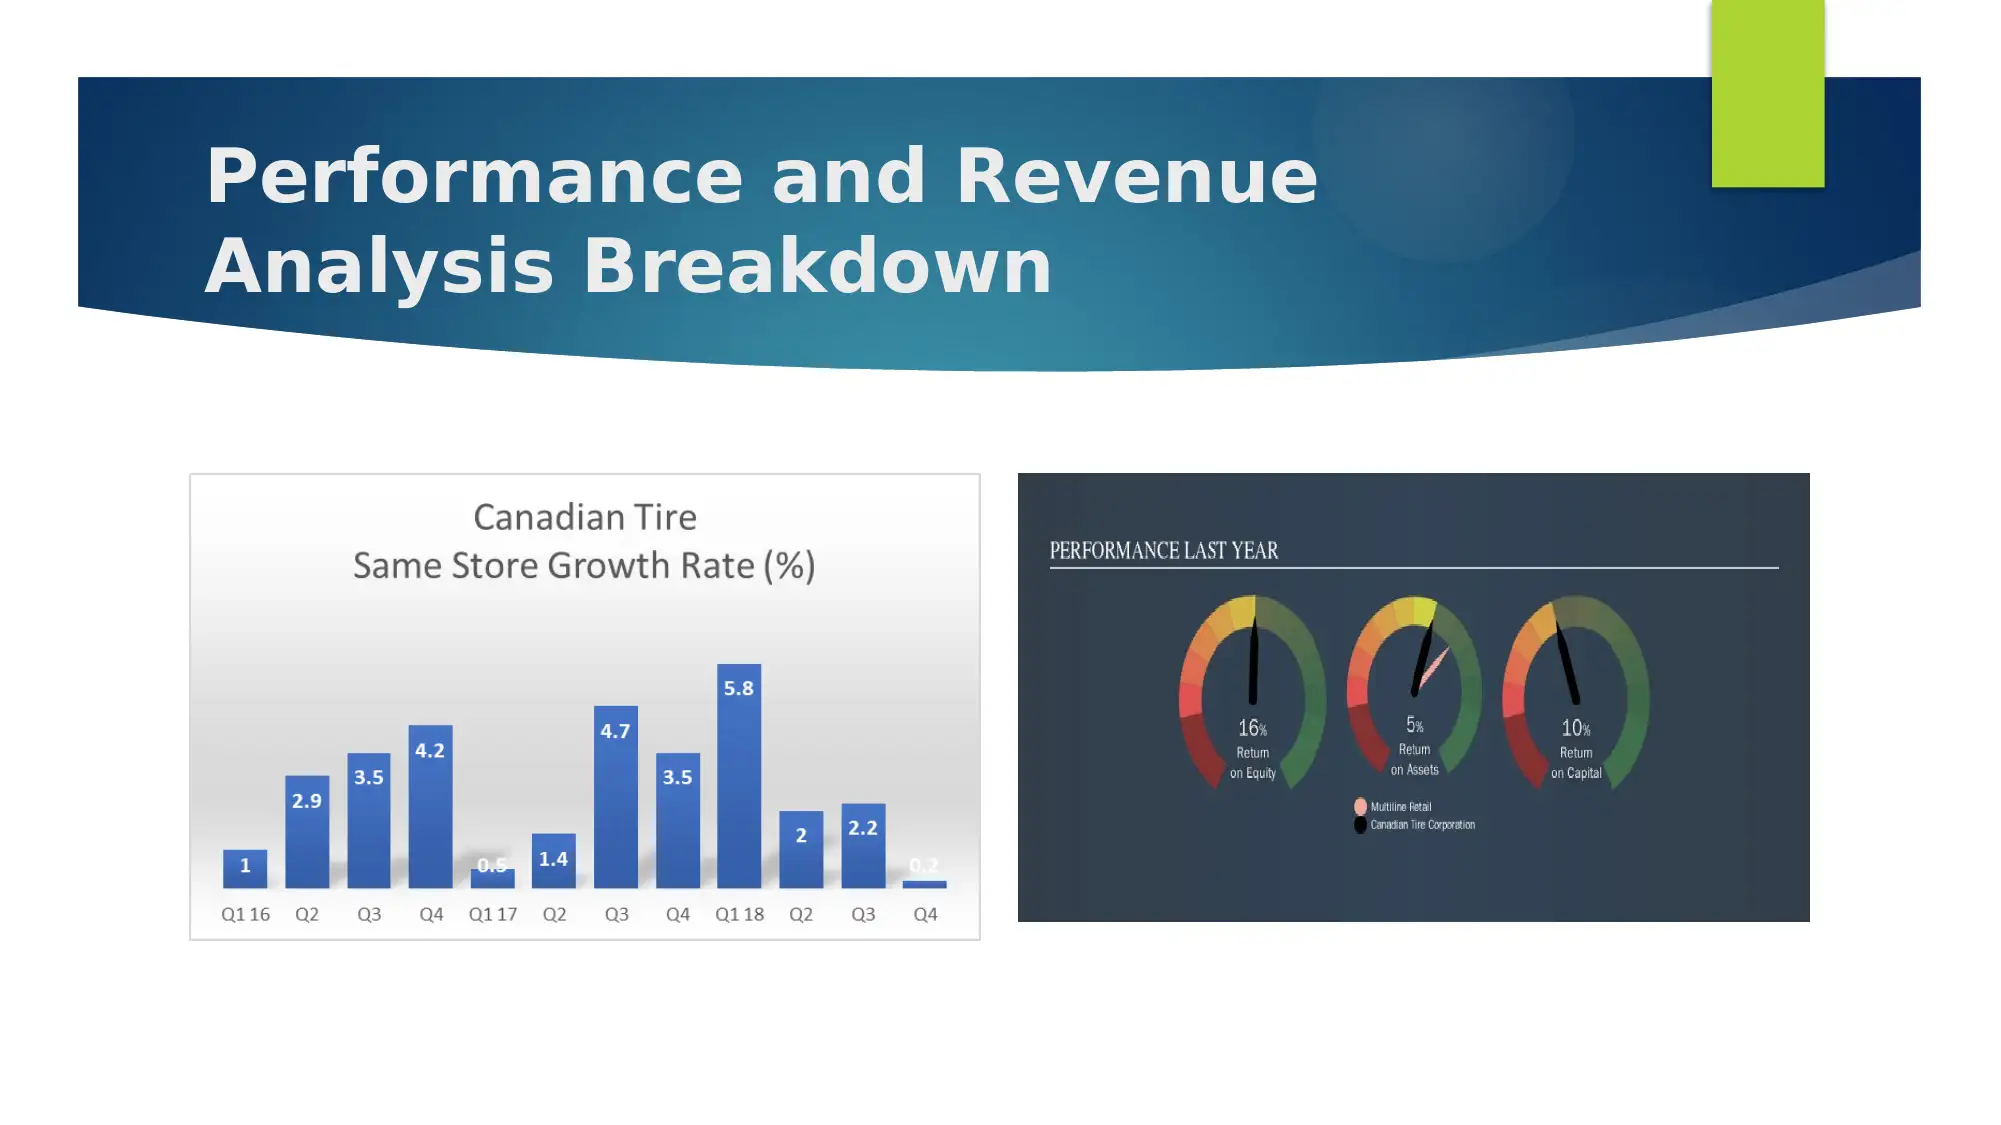
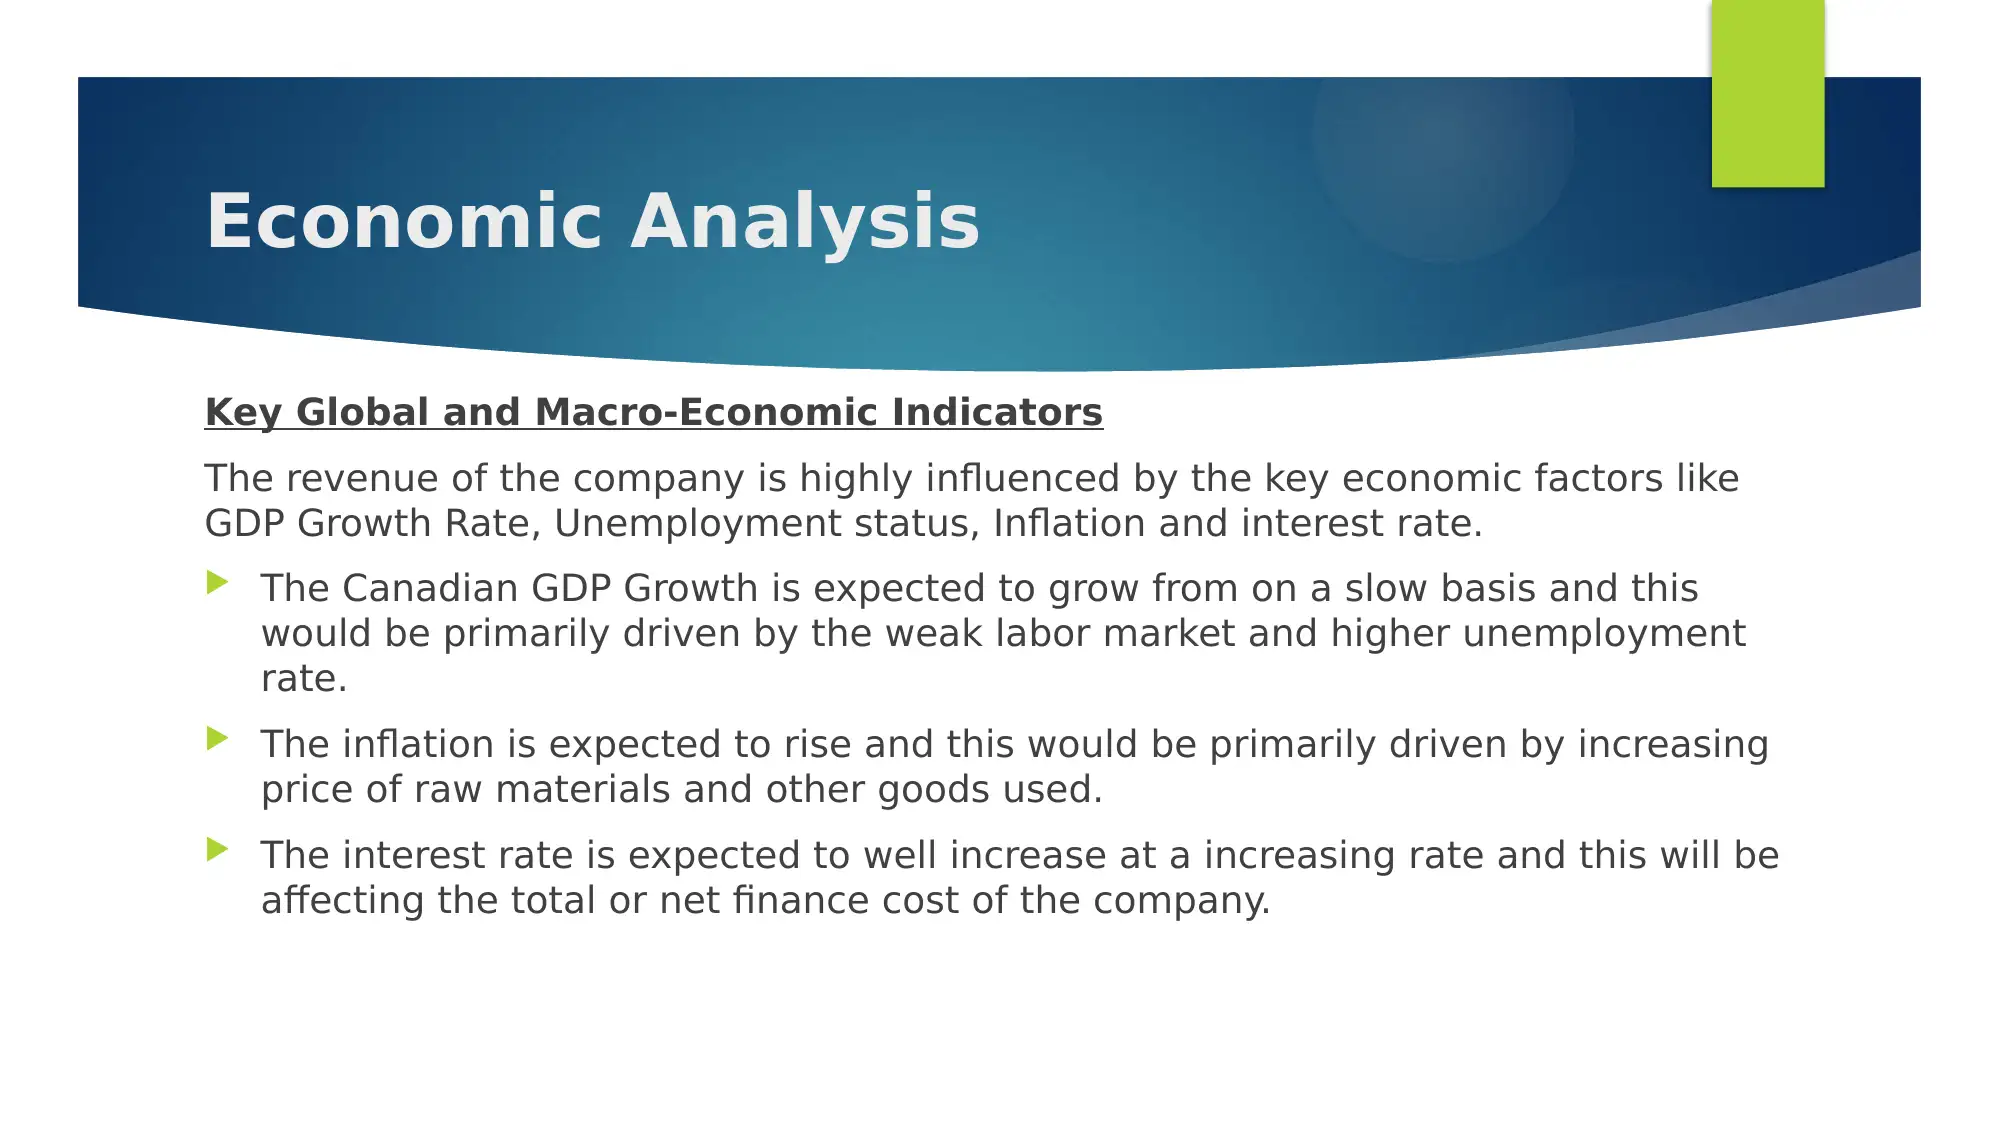
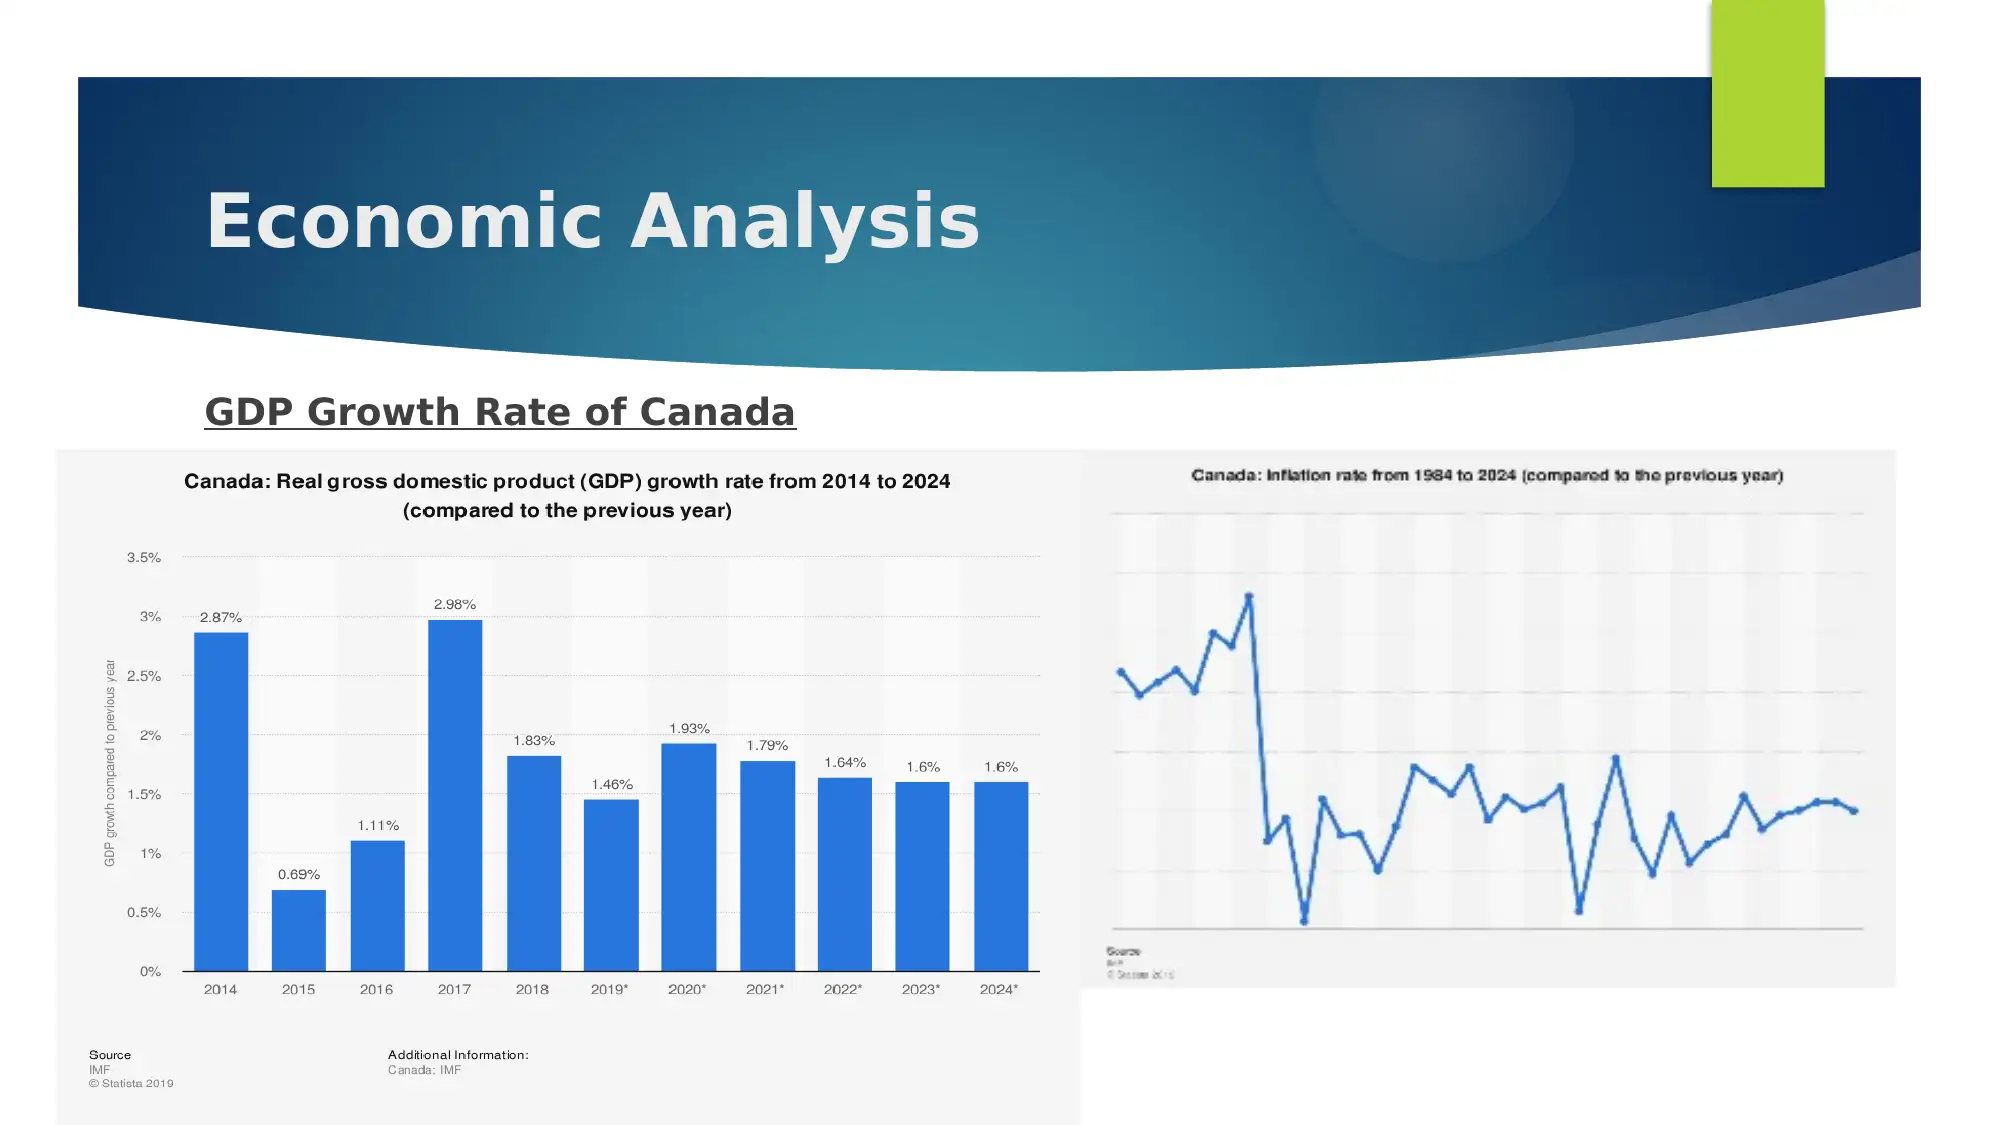
This assignment is an equity valuation report focusing on Canadian Tire Corporation (CTC). It begins with an executive summary providing a company overview, including its founding, business operations (selling automotive, hardware, sports, and home products through 1686 locations and subsidiaries), market capitalization, and financial highlights. The report then analyzes revenue, including its growth from 2016-2018, revenue breakdown by retail banners, and segment-wise revenue distribution. An environmental analysis includes key economic indicators like GDP growth, unemployment, inflation, and interest rates, as well as a Porter's Five Forces analysis and SWOT analysis to assess market dynamics and competitive positioning. Revenue projections for the next two years are developed based on historical trends, and analyst growth expectations are included. The report references financial statements and reports from sources like Yahoo Finance and Canadian Tire's investor relations to support the analysis. The assignment aims to provide a comprehensive understanding of CTC's financial performance and future prospects.
Document Page
Equity
Valuation
Preliminary Summative Assignment 1
tabler-icon-diamond-filled.svg

Paraphrase This Document

Need a fresh take? Get an instant paraphrase of this document with our AI Paraphraser
Document Page
Executive Summary
4.24% (Projected growth during the next
2 years)
SALES GROWTH:
CAD 144.92 (January 24th Closing)CURRENT STOCK PRICE:
Toronto Stock Exchange (TICKER: CTC)STOCK EXCHANGE:
DECEMBER 31stFISCAL YEAR END:
CAD
CURRENCY OF
FINANCIAL
STATEMENTS:
Document Page
Firm
Description
Document Page
COMPANY OVERVIEW
4
One of the Largest Tyre Company in Canada
Founded in the year 1922
Headquartered in Toronto, Ontario, Canada
Currency in CAD
Fiscal year end of December 31st
Listed on the Toronto Stock Market under the ticker symbol
CTC (Yahoo Finance, 2019).
Market Cap of $9.05 Billion
Founders Alfred J. Billes and J. William Billes
Business Highlights Operations
Primary Business Activity: Selling a range of automotive,
hardware, sports and leisure, and home products.
The company has in total of 1686 locations.
The company in total has a 58,000 employee base.
Subsidiaries of CTC Company are as follows:
FGL Sports
Part Source
Canadian Tire Bank
Mark's
Canadian Tire Petroleum
Helly Hansen
Party CityCore Business Model
Cross Selling
Core revenue from the sale of
its Canadian Tire.
Better quality product and an
increasing consumer base
has able the company
increase revenue base.
Customer Loyalty
Strong customer loyalty
program rewarding
customers for spending done.
Loyalty customer rewards are
issued as a part of sales
transaction done.
Direct Selling
Engages in selling a large
portion of its tickets directly
to consumers through its
retail outlet and online
shopping.
Value for Goods
Customized shopping
experience and easy
convenience via online
selling.
Canadian Tire Company. uses the following 4 strategies to transform its activities into value/cash:
Sources: American Airlines Group Inc. 2018 Annual Report, Investor Relations. (2019). Retrieved September 26, 2019, from https://americanairlines.gcs-web.com/investor-relations.,
American Airlines Business Model: Business Model Navigator. (2017). Retrieved September 25, 2019, from https://businessmodelnavigator.com/case-firm?id=9.
tabler-icon-diamond-filled.svg

Paraphrase This Document

Need a fresh take? Get an instant paraphrase of this document with our AI Paraphraser
Document Page
Revenue Analysis
The key customers of the CTC Company
are retail as well as business consumers.
The revenue of the company is generally
driven by its 6 retails banners.
From the year 2016 to 2018, the
company’s revenue has shown a CAGR
growth rate of about 5.9% (Canadian Tire
Corporation, Limited - Investors - Financial
Reporting - Annual Disclosures 2018).
The Canadian Tire accounts for generating
the highest revenue base.
Document Page
Revenue Breakdown
The retail revenue for the company
has increased at a higher rate where
the store count has increased
consistently for the company for the
past three years.
The graphical analysis presented
well shows the increase in the
revenue base with the increase in
the stores of the company.
Document Page
Revenue Analysis via Segment
The revenue marked from the
Canadian Tire sector has been the
highest to around 56%.
The distribution of revenue from the
various subsidiary will be helping in
better revenue base.
56%
16%
12%
4%
12%
Revenue Breakdown (%)
Canadian Tire
SportCheck
Mark's
Helly Hansen
Petroleum
Revenue Breakdown
Segments Amount ($) Percentage (%)
Canadian Tire 2121.7 56%
SportCheck 602.5 16%
Mark's 469.0 12%
Helly Hansen 139.0 4%
Petroleum 468.6 12%
Total 3800.8 100%
tabler-icon-diamond-filled.svg

Paraphrase This Document

Need a fresh take? Get an instant paraphrase of this document with our AI Paraphraser
Document Page
Performance and Revenue
Analysis Breakdown
Document Page
Environmen
tal Analysis
Document Page
Economic Analysis
Key Global and Macro-Economic Indicators
The revenue of the company is highly influenced by the key economic factors like
GDP Growth Rate, Unemployment status, Inflation and interest rate.
The Canadian GDP Growth is expected to grow from on a slow basis and this
would be primarily driven by the weak labor market and higher unemployment
rate.
The inflation is expected to rise and this would be primarily driven by increasing
price of raw materials and other goods used.
The interest rate is expected to well increase at a increasing rate and this will be
affecting the total or net finance cost of the company.
tabler-icon-diamond-filled.svg

Paraphrase This Document

Need a fresh take? Get an instant paraphrase of this document with our AI Paraphraser
Document Page
Economic Analysis
GDP Growth Rate of Canada
Document Page
Competition Analysis
Porters Five Forces
Threat of New Entry: Low: The retail market is primarily at a mature stage and
requires high capital outlay so entry in this market is quite challenging.
Power of Suppliers: Low: The number of suppliers selling the goods are in high
numbers that offers similar or substitute product.
Power of Buyers: High: High competition in the industry allows the retail
consumers to get a high bargaining power.
Threat of Substitution: High: The offered products by the company are very
similar to other products that are sold by other companies available in the market.
Competitive Rivalry: High: The competitive rivalry associated with the company
is comparatively high due to the wide scale expansion of various offered products.
chevron_up_icon
1 out of 19
circle_padding
hide_on_mobile
zoom_out_icon
[object Object]