Detailed ER Modeling and Database Design for Merrill Hand Tools Ltd
VerifiedAdded on 2022/12/30
|42
|8092
|1
Project
AI Summary
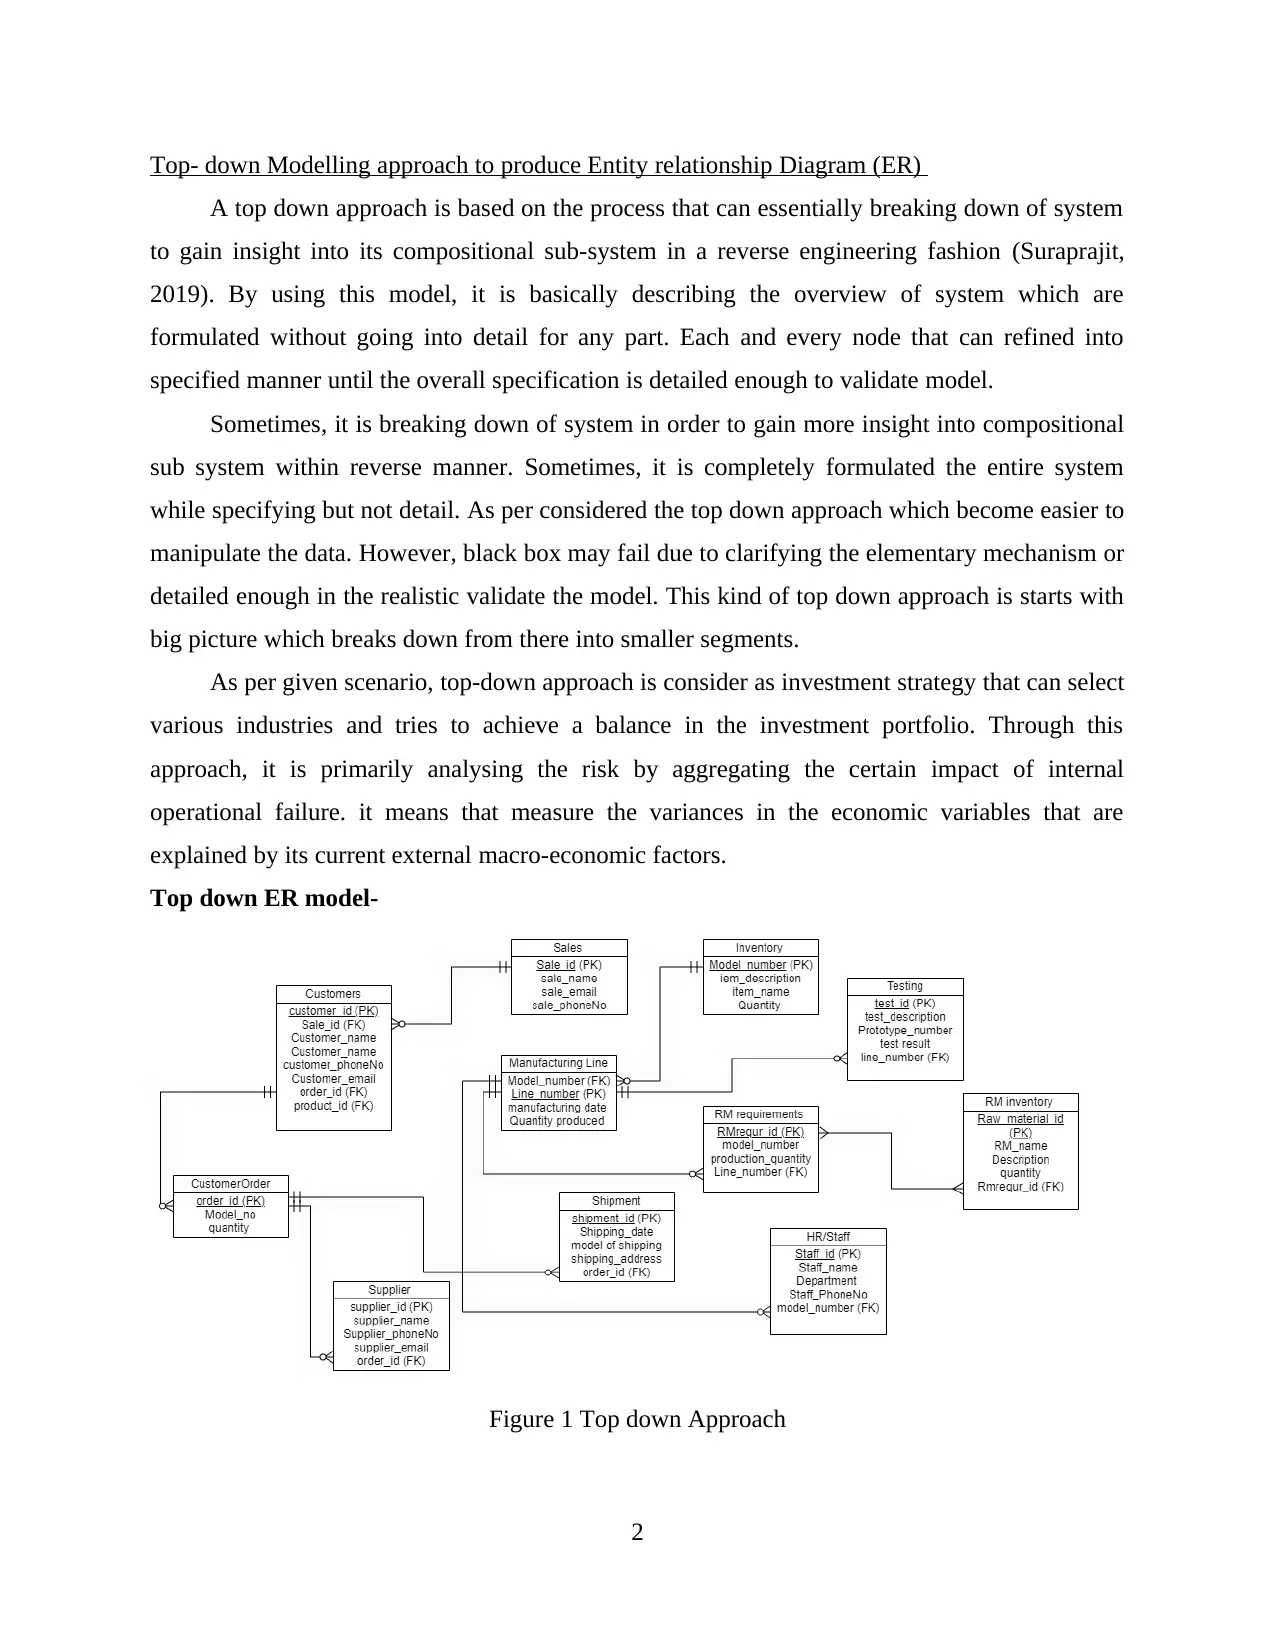
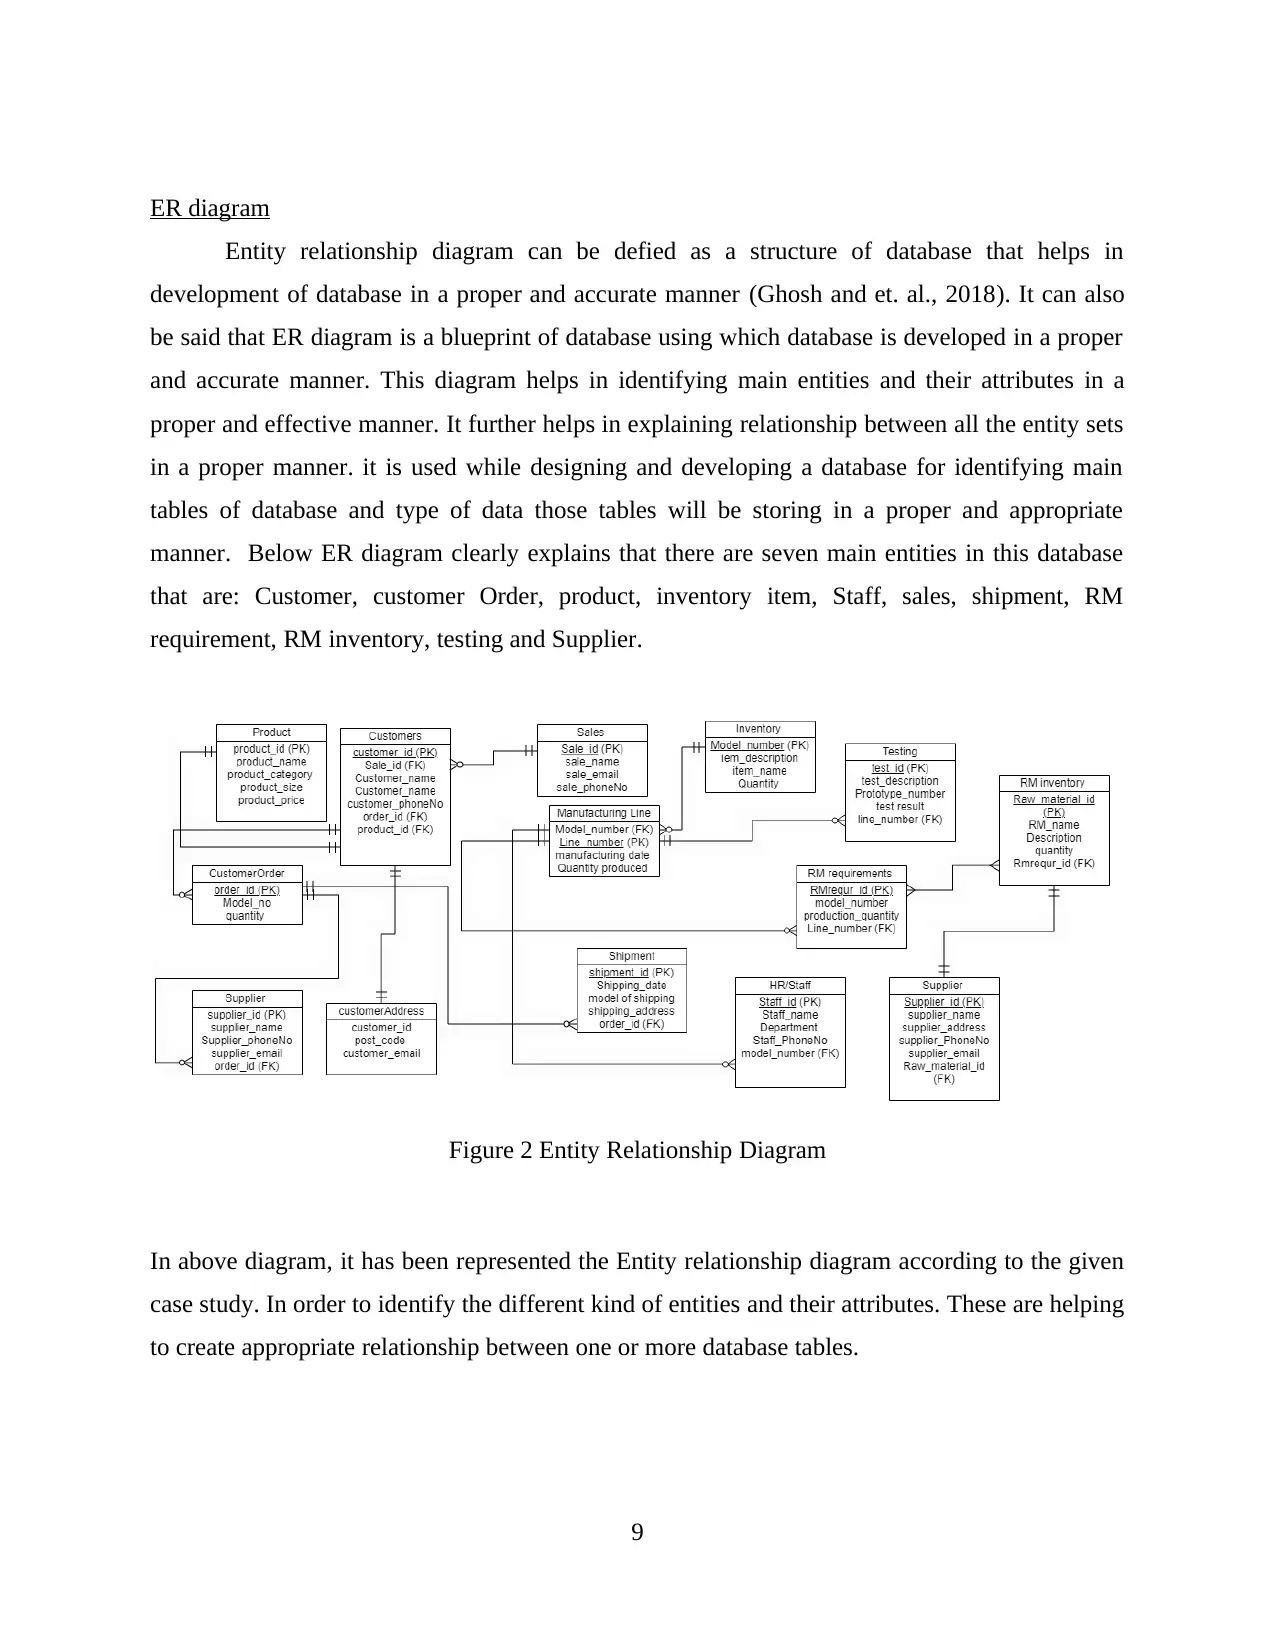
This project presents an in-depth analysis and database design for Merrill Hand Tools Ltd (MHT), a manufacturing company undergoing a system reengineering project. The assignment begins with an introduction to ER modeling and its application in database design. Task A focuses on a case study analysis, employing both top-down and bottom-up modeling approaches to create an ER diagram. The top-down approach outlines the system overview, while the bottom-up approach identifies functional dependencies and normalization. The ER diagram illustrates the relationships between entities like Customers, Customer Orders, Products, Inventory, Staff, Sales, and Manufacturing Lines. Task B involves database implementation using Microsoft SQL Server, including table creation statements for entities, sample data, and a data dictionary detailing primary keys, foreign keys, and constraints. The project concludes with SQL code for querying tables, demonstrating the practical application of the designed database and the justifications of the design choices.

ER MODELLING
Paraphrase This Document
Need a fresh take? Get an instant paraphrase of this document with our AI Paraphraser

TABLE OF CONTENTS
INTRODUCTION...........................................................................................................................1
TASK A...........................................................................................................................................1
Analysis of Case study.................................................................................................................1
Top- down Modelling approach to produce Entity relationship Diagram (ER)..........................2
Bottom-Up modelling approach to identify Functional dependencies........................................3
Combination of both order and customer table...........................................................................6
ER diagram..................................................................................................................................9
TASK B.........................................................................................................................................11
Database used............................................................................................................................11
Table creation statement............................................................................................................11
Sample data of tables.................................................................................................................16
Data Dictionary information (primary keys, foreign keys, constraints)....................................19
SQL code for querying tables....................................................................................................22
CONCLUSION..............................................................................................................................33
REFERENCES..............................................................................................................................34

INTRODUCTION
Entity relationship modelling also known as ER modelling is a kind of graphical
approach which is used for designing a database (Hossain, Rajan and Schwitter, 2019). It is a
high- level data model which is used for defining data elements and their relationship for a
specified software system. It helps in explaining entity types and relationship between them. This
assessment will lay emphasis upon a case study of Merrill Hand Tools Ltd (MHT) who have
decided of undertaking major systems reengineering project. In this assessment two main task
will be focused. First task will focus upon analysis of case study has been done, top- down
modelling, bottom- up modelling and ER diagram has been developed. In second task Table
creation statements, Data dictionary information, SQL code for querying tables, and justification
of ER diagram and assumptions made.
TASK A
Analysis of Case study
This case study is about Merrill Hand Tools Ltd (MHT) which is a family run business in
Sheffield that manufacturers different range of hand tools from general tooling to specialist
woodworking tools and agricultural implements. Currently they have three divisions: Product
Development, Manufacturing, and Marketing and Sales and each of these divisions has a vice
precedent who report to CEO. All the three divisions are facing some kinds of issues such as:
programmer in manufacturing department can only fix superficial user interface issues and repair
corrupted data files but he cannot be a part of original program development. Their current
database has several problems such like limit to number of simultaneous users, data
inconsistencies etc. Due to this, they have decided to undergo major systems reengineering
project in which new information system division will be developed along with three existing
systems. This new department will be led by Chief Information Officer who will hire Lead
Programmer, a Database Administrator, and a Lead Analyst. CIO will be developing a data
administration plan, roadmap that documents all application programs required for supporting
corporate operations, developing and hosting a Web app, ER diagrams and data dictionaries, and
will implement planned system.
1
⊘ This is a preview!⊘
Do you want full access?
Subscribe today to unlock all pages.

Trusted by 1+ million students worldwide

Top- down Modelling approach to produce Entity relationship Diagram (ER)
A top down approach is based on the process that can essentially breaking down of system
to gain insight into its compositional sub-system in a reverse engineering fashion (Suraprajit,
2019). By using this model, it is basically describing the overview of system which are
formulated without going into detail for any part. Each and every node that can refined into
specified manner until the overall specification is detailed enough to validate model.
Sometimes, it is breaking down of system in order to gain more insight into compositional
sub system within reverse manner. Sometimes, it is completely formulated the entire system
while specifying but not detail. As per considered the top down approach which become easier to
manipulate the data. However, black box may fail due to clarifying the elementary mechanism or
detailed enough in the realistic validate the model. This kind of top down approach is starts with
big picture which breaks down from there into smaller segments.
As per given scenario, top-down approach is consider as investment strategy that can select
various industries and tries to achieve a balance in the investment portfolio. Through this
approach, it is primarily analysing the risk by aggregating the certain impact of internal
operational failure. it means that measure the variances in the economic variables that are
explained by its current external macro-economic factors.
Top down ER model-
Figure 1 Top down Approach
2
Paraphrase This Document
Need a fresh take? Get an instant paraphrase of this document with our AI Paraphraser

On the basis of case study, it has been produced the tool in which identifying the procedures of
Merill Hand tools manufacturing process.
Top dowm Model relationship-
Customer and customer order
Each and every consumer may have rights to place the order
Every order need to be placed by one consumers.
Customer and Sales
A potential client has been established the connection to one or more marketing or sales
agent.
Sales agent can help to manage one and many consumers.
Manufacturing line and inventory
An efficient manufacturing line will be producing one or many finished goods.
Each finished goods which belongs to one and one manufacturing line per day
Testing and Staff/HR
Staff member can test one or many products
Testing the products that can easily done by one or one staff members
Raw material requirements and manufacturing line
Each and every material requirement produce one to one items
Manufacturing line requests for one to many in raw materials needs.
Bottom-Up modelling approach to identify Functional dependencies
Bottom- Up modelling is a kind of an Approach that helps in piecing a system together in
order to give rise to more complex systems (Streicher and et.al., 2019). It helps in making sub
system of existing system. It helps in linking large components that are linked together until
complete system is formed. It can also be said that it helps in developing small seeds of the
system that together helps in growing complete and complex projects together. Some of the main
advantages of this modelling approach are: it helps in taking decision related to reusable low-
level utilities for identifying ways in which these reusable low- level utilities can be put together
for creation of high- level construct. This approach completely contrasts with top- down
modelling.
3

Bottom Up modelling is used to resolve smaller problems so that it can be integrated as
whole and complete solution. This modelling is also used to reduce redundancy using data
encapsulation and data hiding. It helps in identifying functional dependencies within a project so
that it can be completed without any issues in a project and appropriate manner.
The normalization process from zero normal form to 3rd normal form for the bottom up model
0NF 1NF
4
⊘ This is a preview!⊘
Do you want full access?
Subscribe today to unlock all pages.

Trusted by 1+ million students worldwide

2NF
3NF Split into smaller tables such as order and customer
5
3NF Split into smaller tables such as order and customer
5
Paraphrase This Document
Need a fresh take? Get an instant paraphrase of this document with our AI Paraphraser

Functional Dependency-
Customer Customer_id customer_name Customer_PhoneNo customer_email customer address
Order Order_id Quantity
Combination of both order and customer table
Functional dependency- customer id-> customer name, phone No, email, address
Transitive dependency- order id-> quantity, customer name
6
Transitive dependency shows in
Customer Table

0NF 1NF
Candidate key – Line_number
Functional dependency-
Test_description
Test_result
Prototype_number
Quantity produced
Transitive dependency-
Line_number -> Manufacturing_date, quantity produced
7
Candidate key – Line_number
Functional dependency-
Test_description
Test_result
Prototype_number
Quantity produced
Transitive dependency-
Line_number -> Manufacturing_date, quantity produced
7
⊘ This is a preview!⊘
Do you want full access?
Subscribe today to unlock all pages.

Trusted by 1+ million students worldwide

2NF
3NF
8
3NF
8
Paraphrase This Document
Need a fresh take? Get an instant paraphrase of this document with our AI Paraphraser

ER diagram
Entity relationship diagram can be defied as a structure of database that helps in
development of database in a proper and accurate manner (Ghosh and et. al., 2018). It can also
be said that ER diagram is a blueprint of database using which database is developed in a proper
and accurate manner. This diagram helps in identifying main entities and their attributes in a
proper and effective manner. It further helps in explaining relationship between all the entity sets
in a proper manner. it is used while designing and developing a database for identifying main
tables of database and type of data those tables will be storing in a proper and appropriate
manner. Below ER diagram clearly explains that there are seven main entities in this database
that are: Customer, customer Order, product, inventory item, Staff, sales, shipment, RM
requirement, RM inventory, testing and Supplier.
Figure 2 Entity Relationship Diagram
In above diagram, it has been represented the Entity relationship diagram according to the given
case study. In order to identify the different kind of entities and their attributes. These are helping
to create appropriate relationship between one or more database tables.
9

For Example-
Relationship between customer and customer order
Order id is a primary key in which representing as foreign key into customer table.
Therefore, it has been shown as relationship between both customer and order table. By using
foreign key, each and every customer can use as unique order number to access information of
particular products. In this way, it will be creating as one to many relationship. One customer can
identify the information different product information through order number.
Relationship between supplier and customer order
Order_id is stored in supplier table as foreign key in order to establish a relationship
between both CustomerOrder and Supplier table. In this way, supplier can select a particular
product through order Id and transport from another place. Therefore, it will create one to many
relational where one supplier can supply many orders. It can help to maintain or control supply
chain management process within manufacturing areas.
Relationship between testing and Manufacturing Line
In manufacturing line table, Line_number is a primary key in which represent as foreign key
into testing table. In this way, it has been developed the relationship between manufacturing and
testing table. Through this, it has been identified that test can happen on the basis of
manufacturing line of particular product. It should be categorised into line number and become
easier to identify the accurate result or outcome. One to many relationship has been established
between both testing and manufacturing line database tables.
10
⊘ This is a preview!⊘
Do you want full access?
Subscribe today to unlock all pages.

Trusted by 1+ million students worldwide
1 out of 42
Related Documents

Your All-in-One AI-Powered Toolkit for Academic Success.
+13062052269
info@desklib.com
Available 24*7 on WhatsApp / Email
Unlock your academic potential
Copyright © 2020–2025 A2Z Services. All Rights Reserved. Developed and managed by ZUCOL.