ERM Power Limited: Financial Statement, Cash Flow and Tax Analysis
VerifiedAdded on 2021/06/17
|10
|2708
|22
Report
AI Summary
This report provides a detailed financial analysis of ERM Power Limited, an Australian energy company. It examines the company's cash flow statement, comparing data from 2015 to 2017, and identifies changes in operating, investing, and financing activities. The report also analyzes the comprehensive income statement, explaining items not directly shown in the final financial statement due to accounting standards. Furthermore, it delves into the company's tax expenses, deferred tax assets and liabilities, and the discrepancies between accounting profit and taxation amounts, referencing AASB regulations. The analysis highlights the complexities of tax recording and the factors influencing ERM Power's financial performance. Desklib provides various resources including past papers and solved assignments for students.

Running Head: Corporate Accounting
1
1
Paraphrase This Document
Need a fresh take? Get an instant paraphrase of this document with our AI Paraphraser
Corporate Accounting
2
Contents
Introduction.......................................................................................................................3
Cash flow statement analysis............................................................................................3
Comparative analysis........................................................................................................4
Comprehensive income statement....................................................................................5
Understanding about comprehensive income statement...................................................5
Reasons.............................................................................................................................6
Tax expenses.....................................................................................................................6
Accounting income and taxation amount.........................................................................6
Deferred tax assets and liabilities.....................................................................................7
Income tax payable...........................................................................................................8
Income tax amount in final statements.............................................................................8
Tax treatment factors........................................................................................................9
Conclusion........................................................................................................................9
References.......................................................................................................................10
Corporate Accounting
3
Introduction:
The report emphasizes upon the financial factors and the financial recording system if
the company. It measures that how the company is recording all the financial transaction of
the company and what are the accenting standards and accounting regulations which are
followed by the company. This report focuses on the final financial statement of the company
to measure the accounting process and the accounting system of the company. It majorly
focuses on the taxation recording system of the company, cash flow statement and the
comprehensive income statement of the company.
Company overview:
ERM power limited is an Australian energy company which operates it activities and
the business in electricity sales and the generation capability of the business. The company
has been founded in 1980 and headquarter of the company is in Australia itself. The company
is second largest company in Australian market in context with selling the energy. The
company mainly focuses on the selling the electricity to the business customers only. The
company is operating its business through various subsidiary companies (Home, 2018).
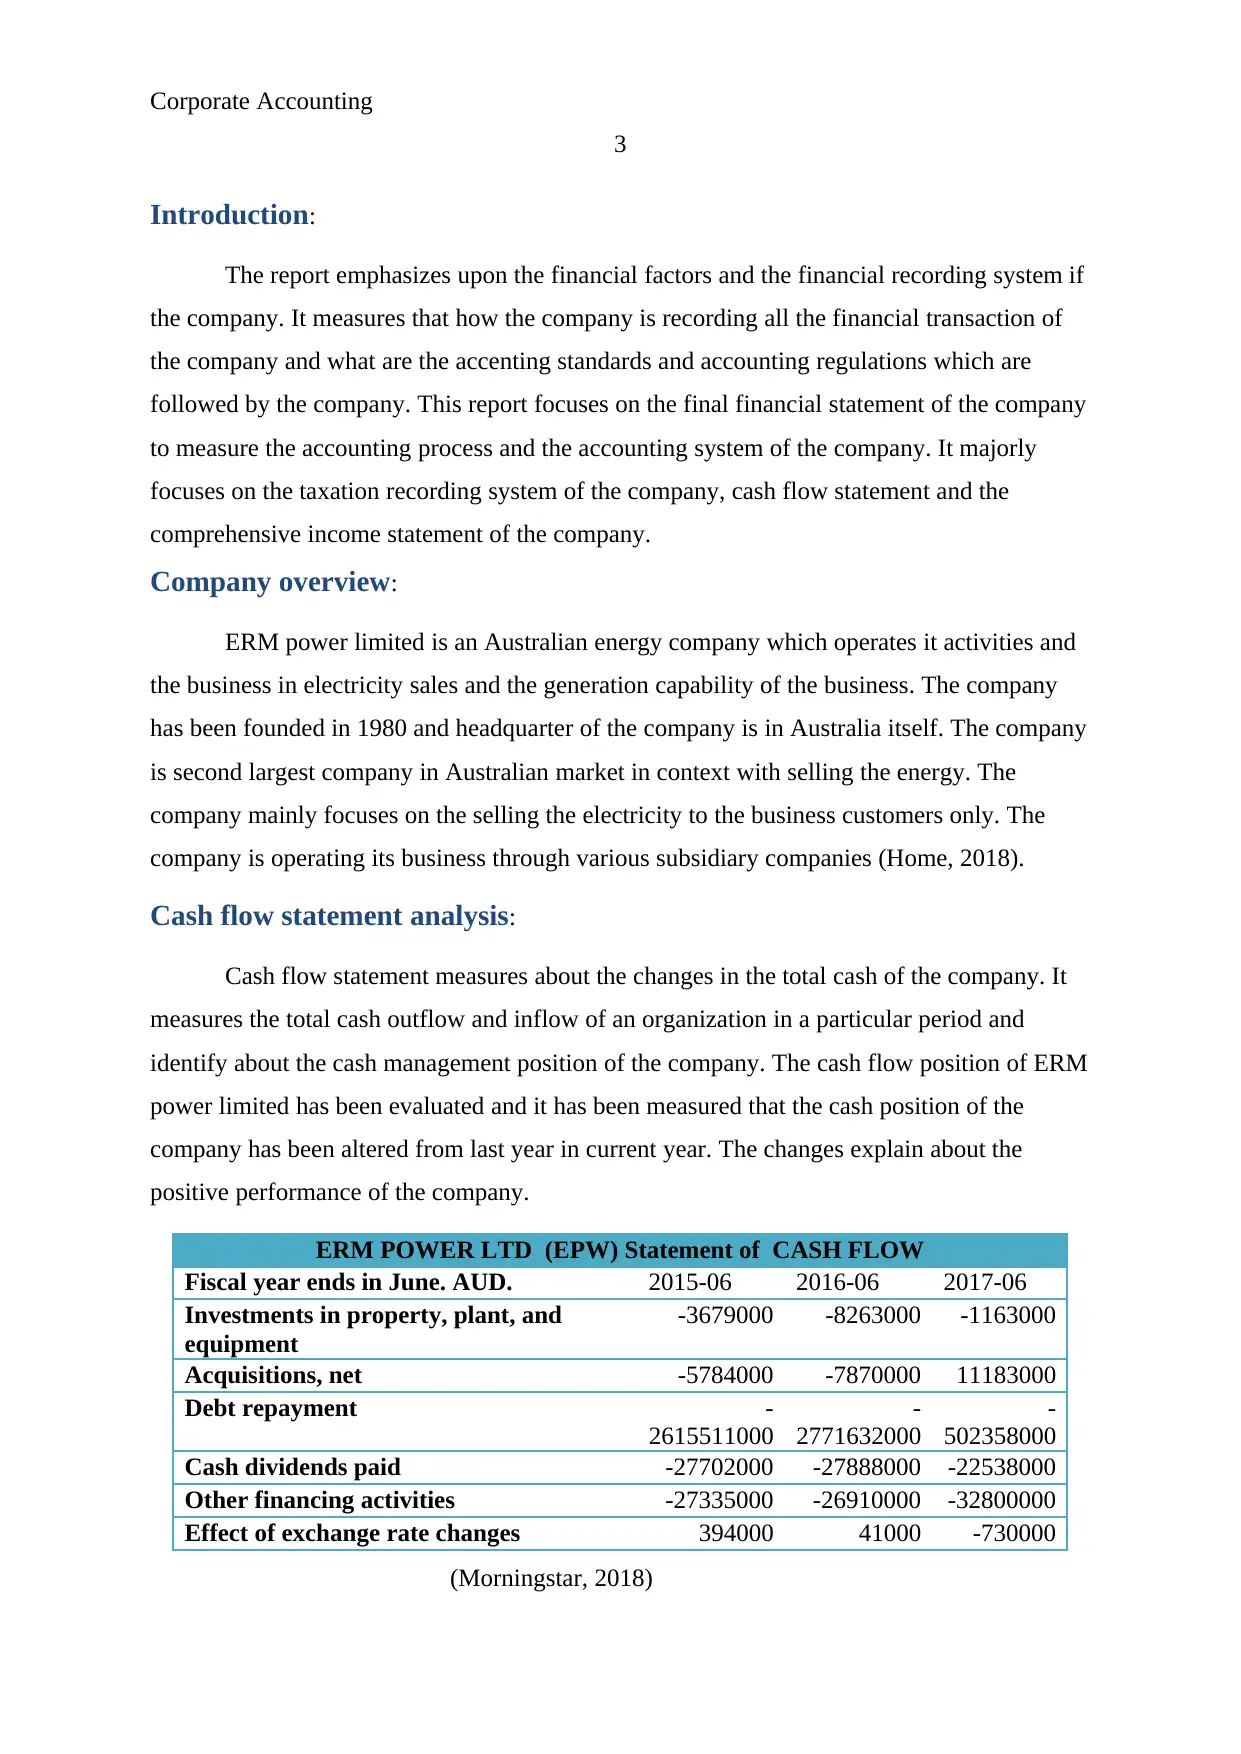
Cash flow statement analysis:
Cash flow statement measures about the changes in the total cash of the company. It
measures the total cash outflow and inflow of an organization in a particular period and
identify about the cash management position of the company. The cash flow position of ERM
power limited has been evaluated and it has been measured that the cash position of the
company has been altered from last year in current year. The changes explain about the
positive performance of the company.
ERM POWER LTD (EPW) Statement of CASH FLOW
Fiscal year ends in June. AUD. 2015-06 2016-06 2017-06
Investments in property, plant, and
equipment
-3679000 -8263000 -1163000
Acquisitions, net -5784000 -7870000 11183000
Debt repayment -
2615511000
-
2771632000
-
502358000
Cash dividends paid -27702000 -27888000 -22538000
Other financing activities -27335000 -26910000 -32800000
Effect of exchange rate changes 394000 41000 -730000
(Morningstar, 2018)
3
Introduction:
The report emphasizes upon the financial factors and the financial recording system if
the company. It measures that how the company is recording all the financial transaction of
the company and what are the accenting standards and accounting regulations which are
followed by the company. This report focuses on the final financial statement of the company
to measure the accounting process and the accounting system of the company. It majorly
focuses on the taxation recording system of the company, cash flow statement and the
comprehensive income statement of the company.
Company overview:
ERM power limited is an Australian energy company which operates it activities and
the business in electricity sales and the generation capability of the business. The company
has been founded in 1980 and headquarter of the company is in Australia itself. The company
is second largest company in Australian market in context with selling the energy. The
company mainly focuses on the selling the electricity to the business customers only. The
company is operating its business through various subsidiary companies (Home, 2018).
Cash flow statement analysis:
Cash flow statement measures about the changes in the total cash of the company. It
measures the total cash outflow and inflow of an organization in a particular period and
identify about the cash management position of the company. The cash flow position of ERM
power limited has been evaluated and it has been measured that the cash position of the
company has been altered from last year in current year. The changes explain about the
positive performance of the company.
ERM POWER LTD (EPW) Statement of CASH FLOW
Fiscal year ends in June. AUD. 2015-06 2016-06 2017-06
Investments in property, plant, and
equipment
-3679000 -8263000 -1163000
Acquisitions, net -5784000 -7870000 11183000
Debt repayment -
2615511000
-
2771632000
-
502358000
Cash dividends paid -27702000 -27888000 -22538000
Other financing activities -27335000 -26910000 -32800000
Effect of exchange rate changes 394000 41000 -730000
(Morningstar, 2018)
⊘ This is a preview!⊘
Do you want full access?
Subscribe today to unlock all pages.
Trusted by 1+ million students worldwide
Corporate Accounting
4
The above table explains that the investment into the property, plant and equipment
has been enhanced by the company which has lead to high cash outflow to the company.
However, the acquisition has managed the cash inflow of the company and due to it; the total
investing cash outflow of the company has been lowered. In addition, it has been found that
the debt repayment capability of the company has also been lowered and the company has
reduced the capital structure (Tran, 2015). In addition, it has been measured that the financing
cash flows of the company explains about the negative changes due to buy back of shares,
debts and huge dividend amount.
The analysis explains about the total changes into the cash flow of the company from
last year. It measures the performance of the company and concludes that the positive
changes have occurred into the cash flow statement of the company from last year.
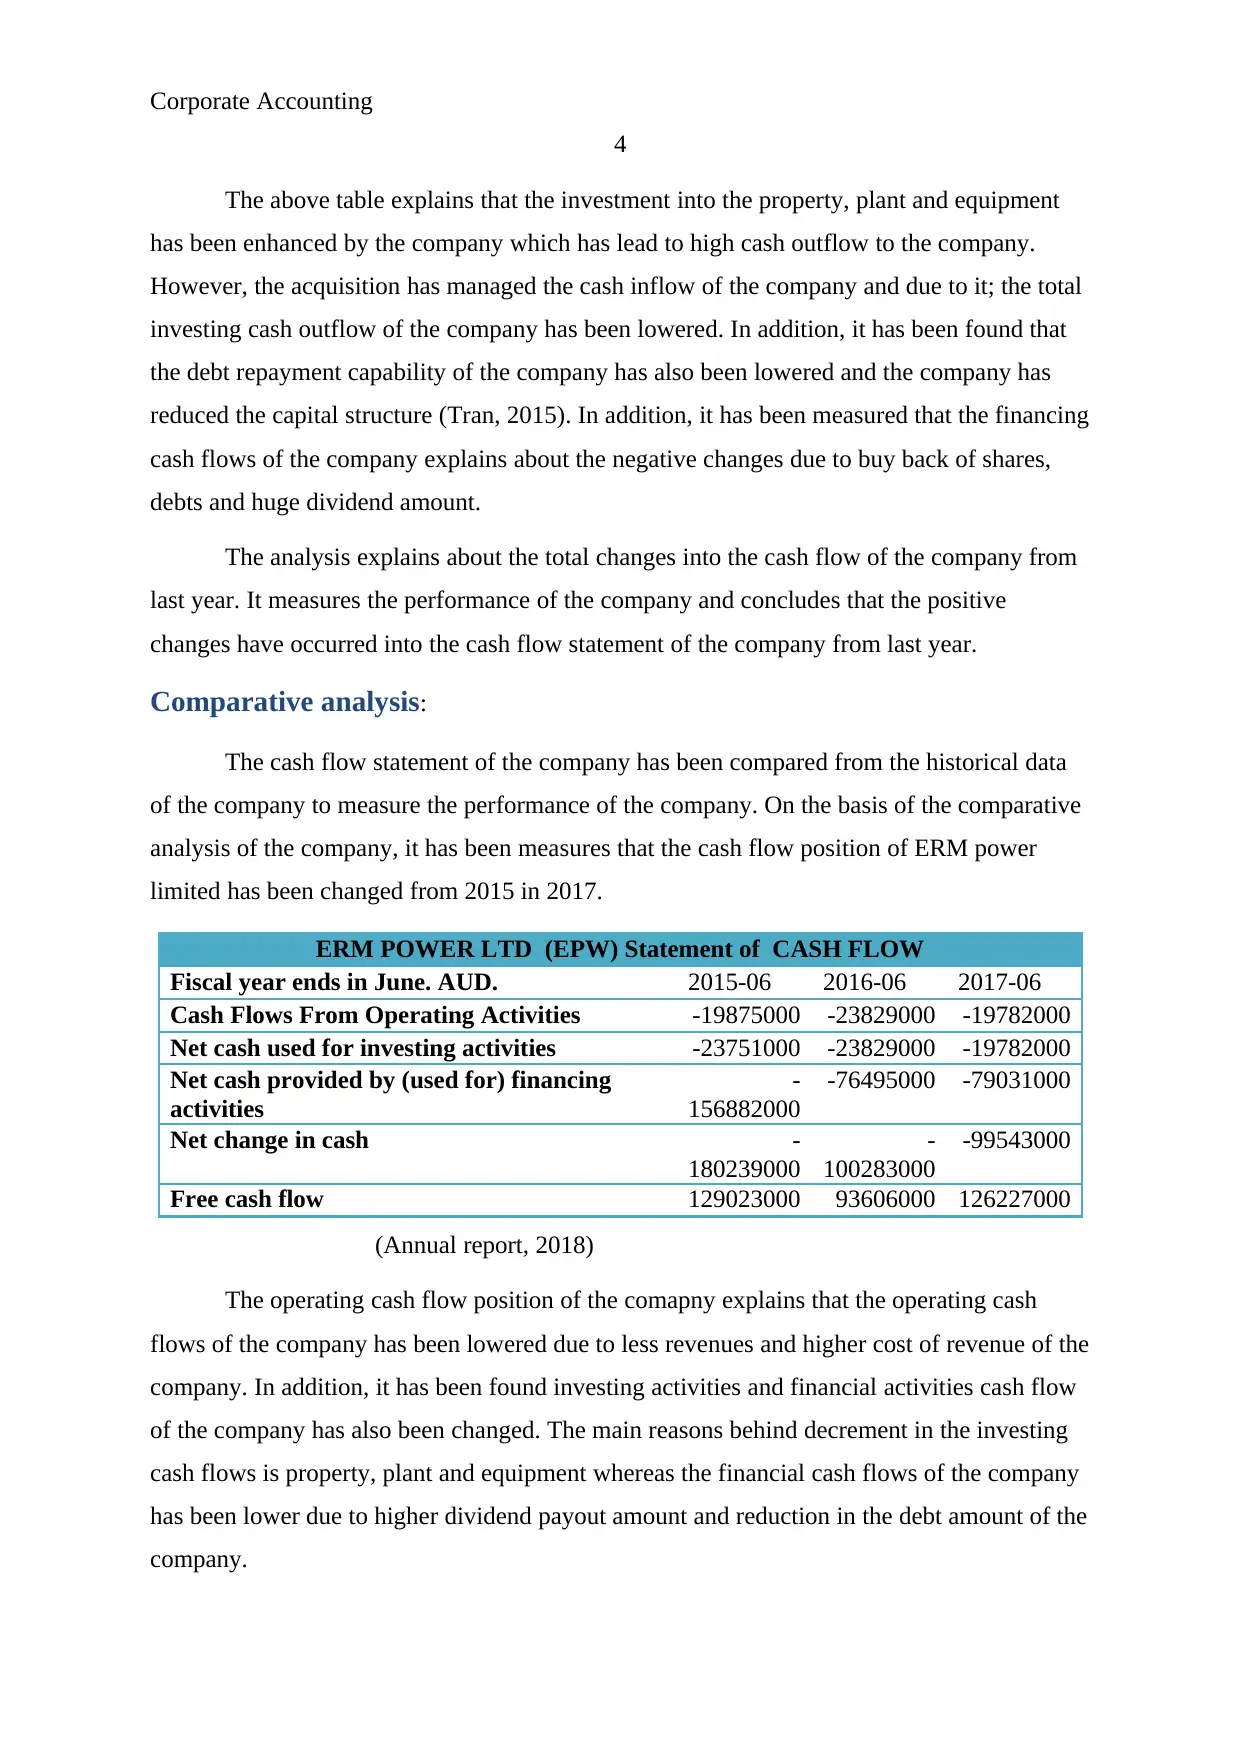
Comparative analysis:
The cash flow statement of the company has been compared from the historical data
of the company to measure the performance of the company. On the basis of the comparative
analysis of the company, it has been measures that the cash flow position of ERM power
limited has been changed from 2015 in 2017.
ERM POWER LTD (EPW) Statement of CASH FLOW
Fiscal year ends in June. AUD. 2015-06 2016-06 2017-06
Cash Flows From Operating Activities -19875000 -23829000 -19782000
Net cash used for investing activities -23751000 -23829000 -19782000
Net cash provided by (used for) financing
activities
-
156882000
-76495000 -79031000
Net change in cash -
180239000
-
100283000
-99543000
Free cash flow 129023000 93606000 126227000
(Annual report, 2018)
The operating cash flow position of the comapny explains that the operating cash
flows of the company has been lowered due to less revenues and higher cost of revenue of the
company. In addition, it has been found investing activities and financial activities cash flow
of the company has also been changed. The main reasons behind decrement in the investing
cash flows is property, plant and equipment whereas the financial cash flows of the company
has been lower due to higher dividend payout amount and reduction in the debt amount of the
company.
4
The above table explains that the investment into the property, plant and equipment
has been enhanced by the company which has lead to high cash outflow to the company.
However, the acquisition has managed the cash inflow of the company and due to it; the total
investing cash outflow of the company has been lowered. In addition, it has been found that
the debt repayment capability of the company has also been lowered and the company has
reduced the capital structure (Tran, 2015). In addition, it has been measured that the financing
cash flows of the company explains about the negative changes due to buy back of shares,
debts and huge dividend amount.
The analysis explains about the total changes into the cash flow of the company from
last year. It measures the performance of the company and concludes that the positive
changes have occurred into the cash flow statement of the company from last year.
Comparative analysis:
The cash flow statement of the company has been compared from the historical data
of the company to measure the performance of the company. On the basis of the comparative
analysis of the company, it has been measures that the cash flow position of ERM power
limited has been changed from 2015 in 2017.
ERM POWER LTD (EPW) Statement of CASH FLOW
Fiscal year ends in June. AUD. 2015-06 2016-06 2017-06
Cash Flows From Operating Activities -19875000 -23829000 -19782000
Net cash used for investing activities -23751000 -23829000 -19782000
Net cash provided by (used for) financing
activities
-
156882000
-76495000 -79031000
Net change in cash -
180239000
-
100283000
-99543000
Free cash flow 129023000 93606000 126227000
(Annual report, 2018)
The operating cash flow position of the comapny explains that the operating cash
flows of the company has been lowered due to less revenues and higher cost of revenue of the
company. In addition, it has been found investing activities and financial activities cash flow
of the company has also been changed. The main reasons behind decrement in the investing
cash flows is property, plant and equipment whereas the financial cash flows of the company
has been lower due to higher dividend payout amount and reduction in the debt amount of the
company.
Paraphrase This Document
Need a fresh take? Get an instant paraphrase of this document with our AI Paraphraser
Corporate Accounting
5
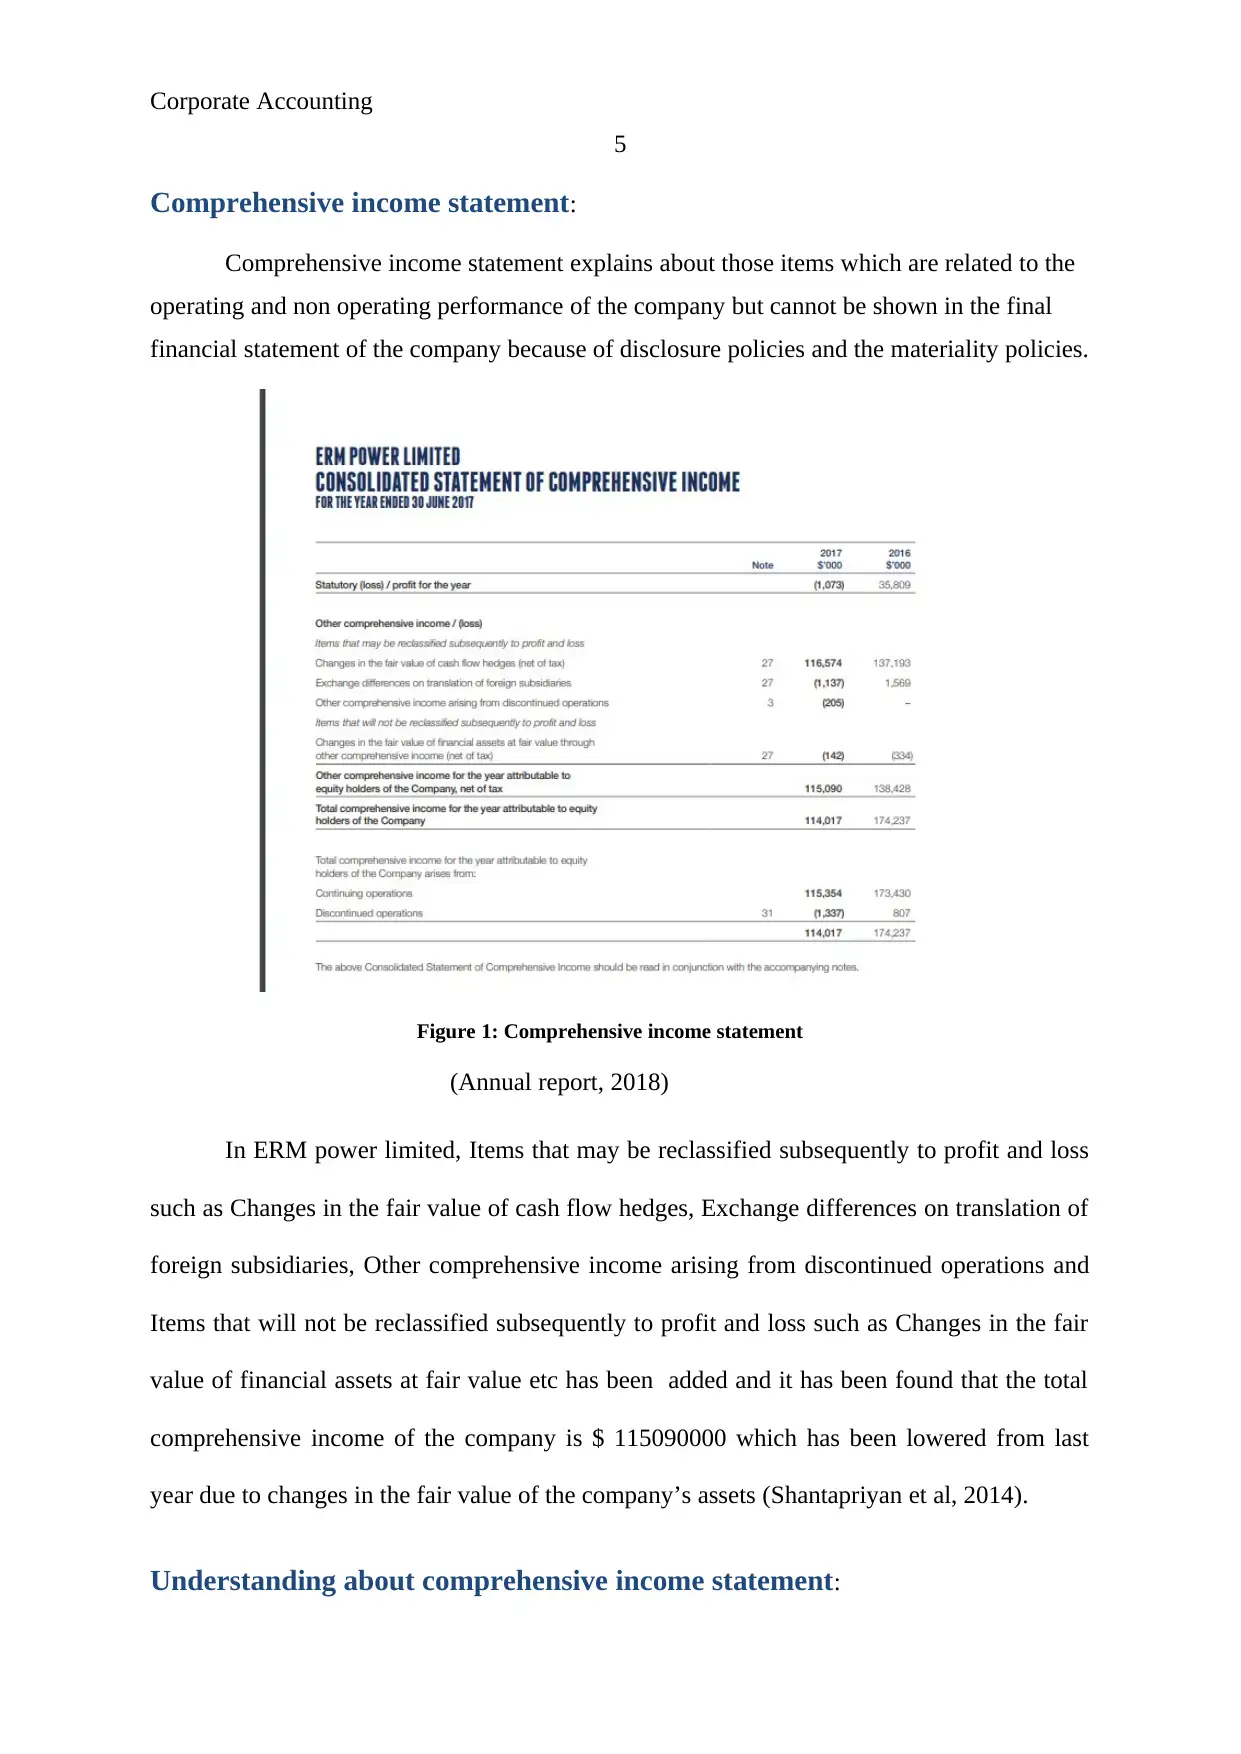
Comprehensive income statement:
Comprehensive income statement explains about those items which are related to the
operating and non operating performance of the company but cannot be shown in the final
financial statement of the company because of disclosure policies and the materiality policies.
Figure 1: Comprehensive income statement
(Annual report, 2018)
In ERM power limited, Items that may be reclassified subsequently to profit and loss
such as Changes in the fair value of cash flow hedges, Exchange differences on translation of
foreign subsidiaries, Other comprehensive income arising from discontinued operations and
Items that will not be reclassified subsequently to profit and loss such as Changes in the fair
value of financial assets at fair value etc has been added and it has been found that the total
comprehensive income of the company is $ 115090000 which has been lowered from last
year due to changes in the fair value of the company’s assets (Shantapriyan et al, 2014).
Understanding about comprehensive income statement:
5
Comprehensive income statement:
Comprehensive income statement explains about those items which are related to the
operating and non operating performance of the company but cannot be shown in the final
financial statement of the company because of disclosure policies and the materiality policies.
Figure 1: Comprehensive income statement
(Annual report, 2018)
In ERM power limited, Items that may be reclassified subsequently to profit and loss
such as Changes in the fair value of cash flow hedges, Exchange differences on translation of
foreign subsidiaries, Other comprehensive income arising from discontinued operations and
Items that will not be reclassified subsequently to profit and loss such as Changes in the fair
value of financial assets at fair value etc has been added and it has been found that the total
comprehensive income of the company is $ 115090000 which has been lowered from last
year due to changes in the fair value of the company’s assets (Shantapriyan et al, 2014).
Understanding about comprehensive income statement:
Corporate Accounting
6
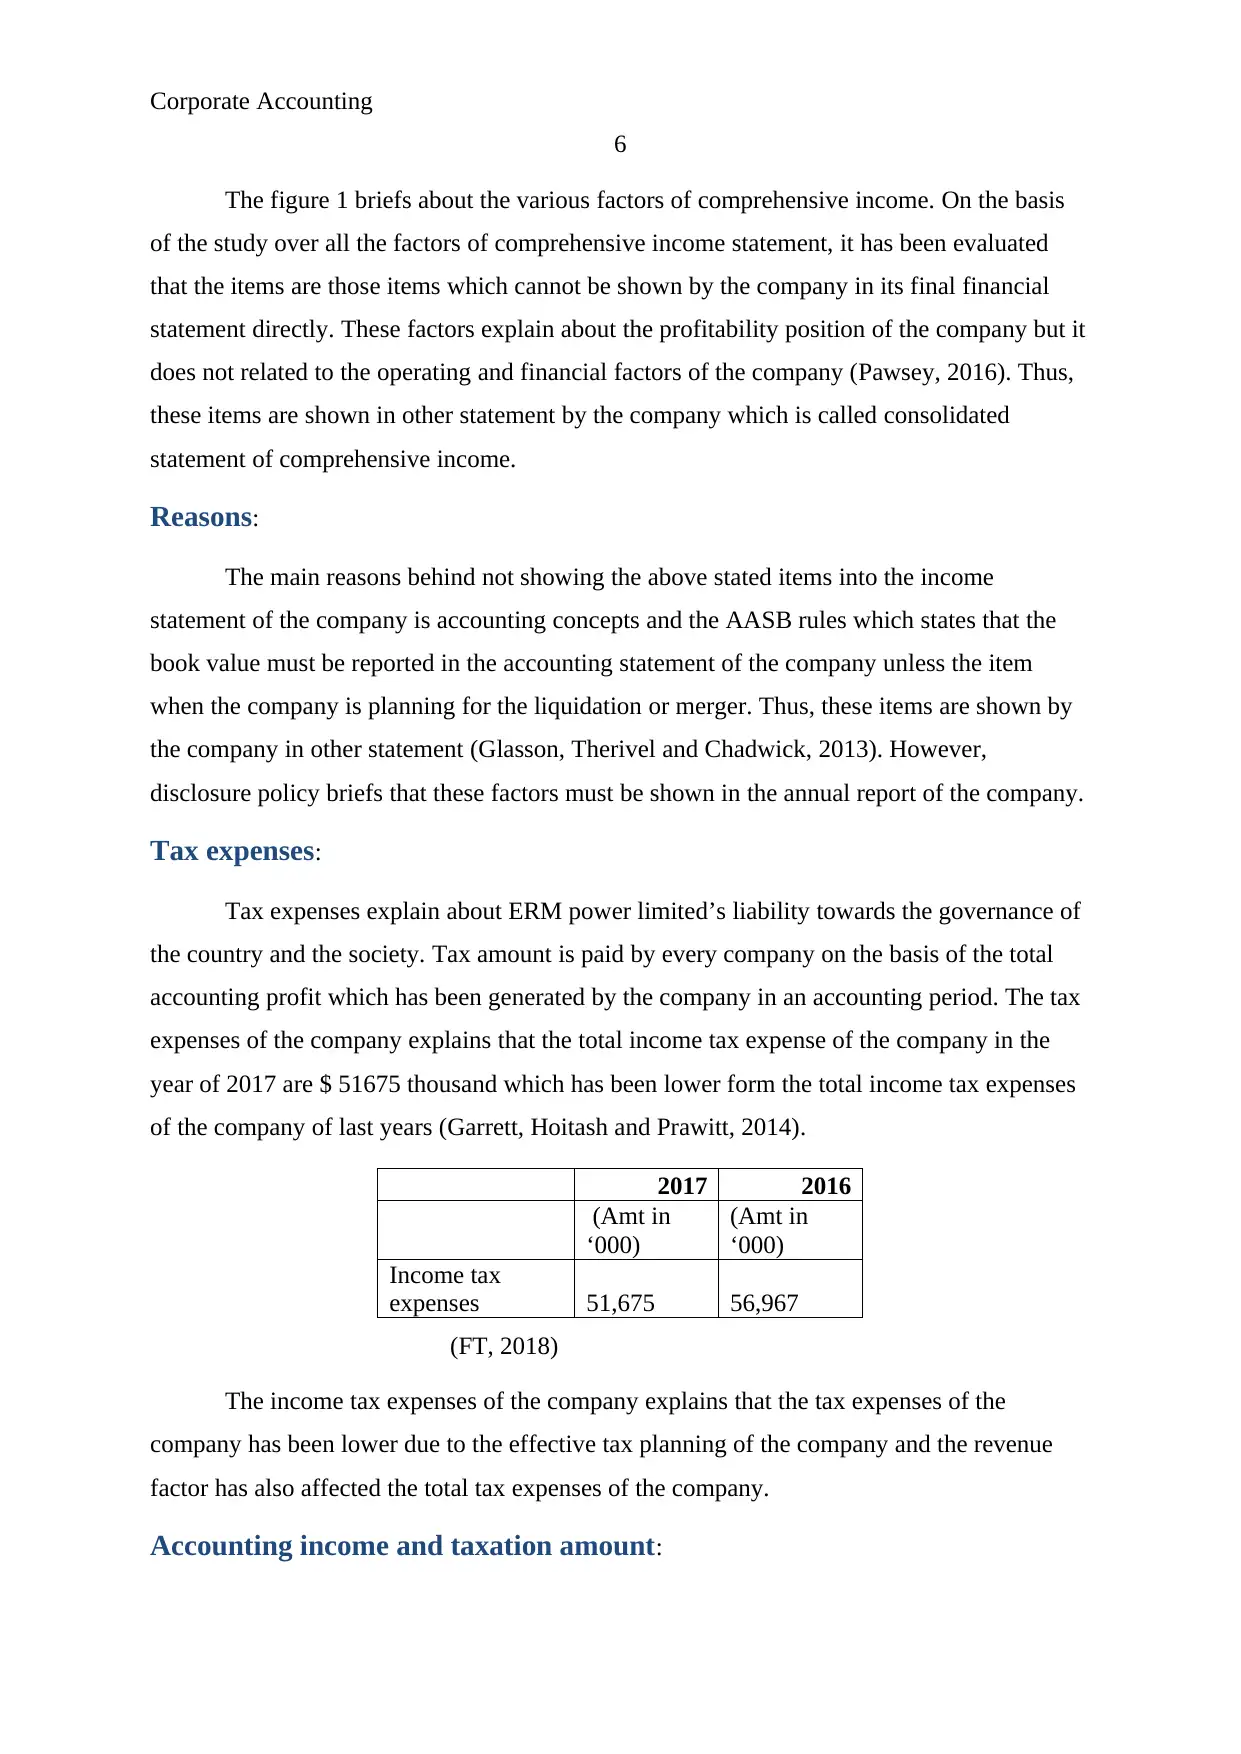
The figure 1 briefs about the various factors of comprehensive income. On the basis
of the study over all the factors of comprehensive income statement, it has been evaluated
that the items are those items which cannot be shown by the company in its final financial
statement directly. These factors explain about the profitability position of the company but it
does not related to the operating and financial factors of the company (Pawsey, 2016). Thus,
these items are shown in other statement by the company which is called consolidated
statement of comprehensive income.
Reasons:
The main reasons behind not showing the above stated items into the income
statement of the company is accounting concepts and the AASB rules which states that the
book value must be reported in the accounting statement of the company unless the item
when the company is planning for the liquidation or merger. Thus, these items are shown by
the company in other statement (Glasson, Therivel and Chadwick, 2013). However,
disclosure policy briefs that these factors must be shown in the annual report of the company.
Tax expenses:
Tax expenses explain about ERM power limited’s liability towards the governance of
the country and the society. Tax amount is paid by every company on the basis of the total
accounting profit which has been generated by the company in an accounting period. The tax
expenses of the company explains that the total income tax expense of the company in the
year of 2017 are $ 51675 thousand which has been lower form the total income tax expenses
of the company of last years (Garrett, Hoitash and Prawitt, 2014).
2017 2016
(Amt in
‘000)
(Amt in
‘000)
Income tax
expenses 51,675 56,967
(FT, 2018)
The income tax expenses of the company explains that the tax expenses of the
company has been lower due to the effective tax planning of the company and the revenue
factor has also affected the total tax expenses of the company.
Accounting income and taxation amount:
6
The figure 1 briefs about the various factors of comprehensive income. On the basis
of the study over all the factors of comprehensive income statement, it has been evaluated
that the items are those items which cannot be shown by the company in its final financial
statement directly. These factors explain about the profitability position of the company but it
does not related to the operating and financial factors of the company (Pawsey, 2016). Thus,
these items are shown in other statement by the company which is called consolidated
statement of comprehensive income.
Reasons:
The main reasons behind not showing the above stated items into the income
statement of the company is accounting concepts and the AASB rules which states that the
book value must be reported in the accounting statement of the company unless the item
when the company is planning for the liquidation or merger. Thus, these items are shown by
the company in other statement (Glasson, Therivel and Chadwick, 2013). However,
disclosure policy briefs that these factors must be shown in the annual report of the company.
Tax expenses:
Tax expenses explain about ERM power limited’s liability towards the governance of
the country and the society. Tax amount is paid by every company on the basis of the total
accounting profit which has been generated by the company in an accounting period. The tax
expenses of the company explains that the total income tax expense of the company in the
year of 2017 are $ 51675 thousand which has been lower form the total income tax expenses
of the company of last years (Garrett, Hoitash and Prawitt, 2014).
2017 2016
(Amt in
‘000)
(Amt in
‘000)
Income tax
expenses 51,675 56,967
(FT, 2018)
The income tax expenses of the company explains that the tax expenses of the
company has been lower due to the effective tax planning of the company and the revenue
factor has also affected the total tax expenses of the company.
Accounting income and taxation amount:
⊘ This is a preview!⊘
Do you want full access?
Subscribe today to unlock all pages.
Trusted by 1+ million students worldwide
Corporate Accounting
7
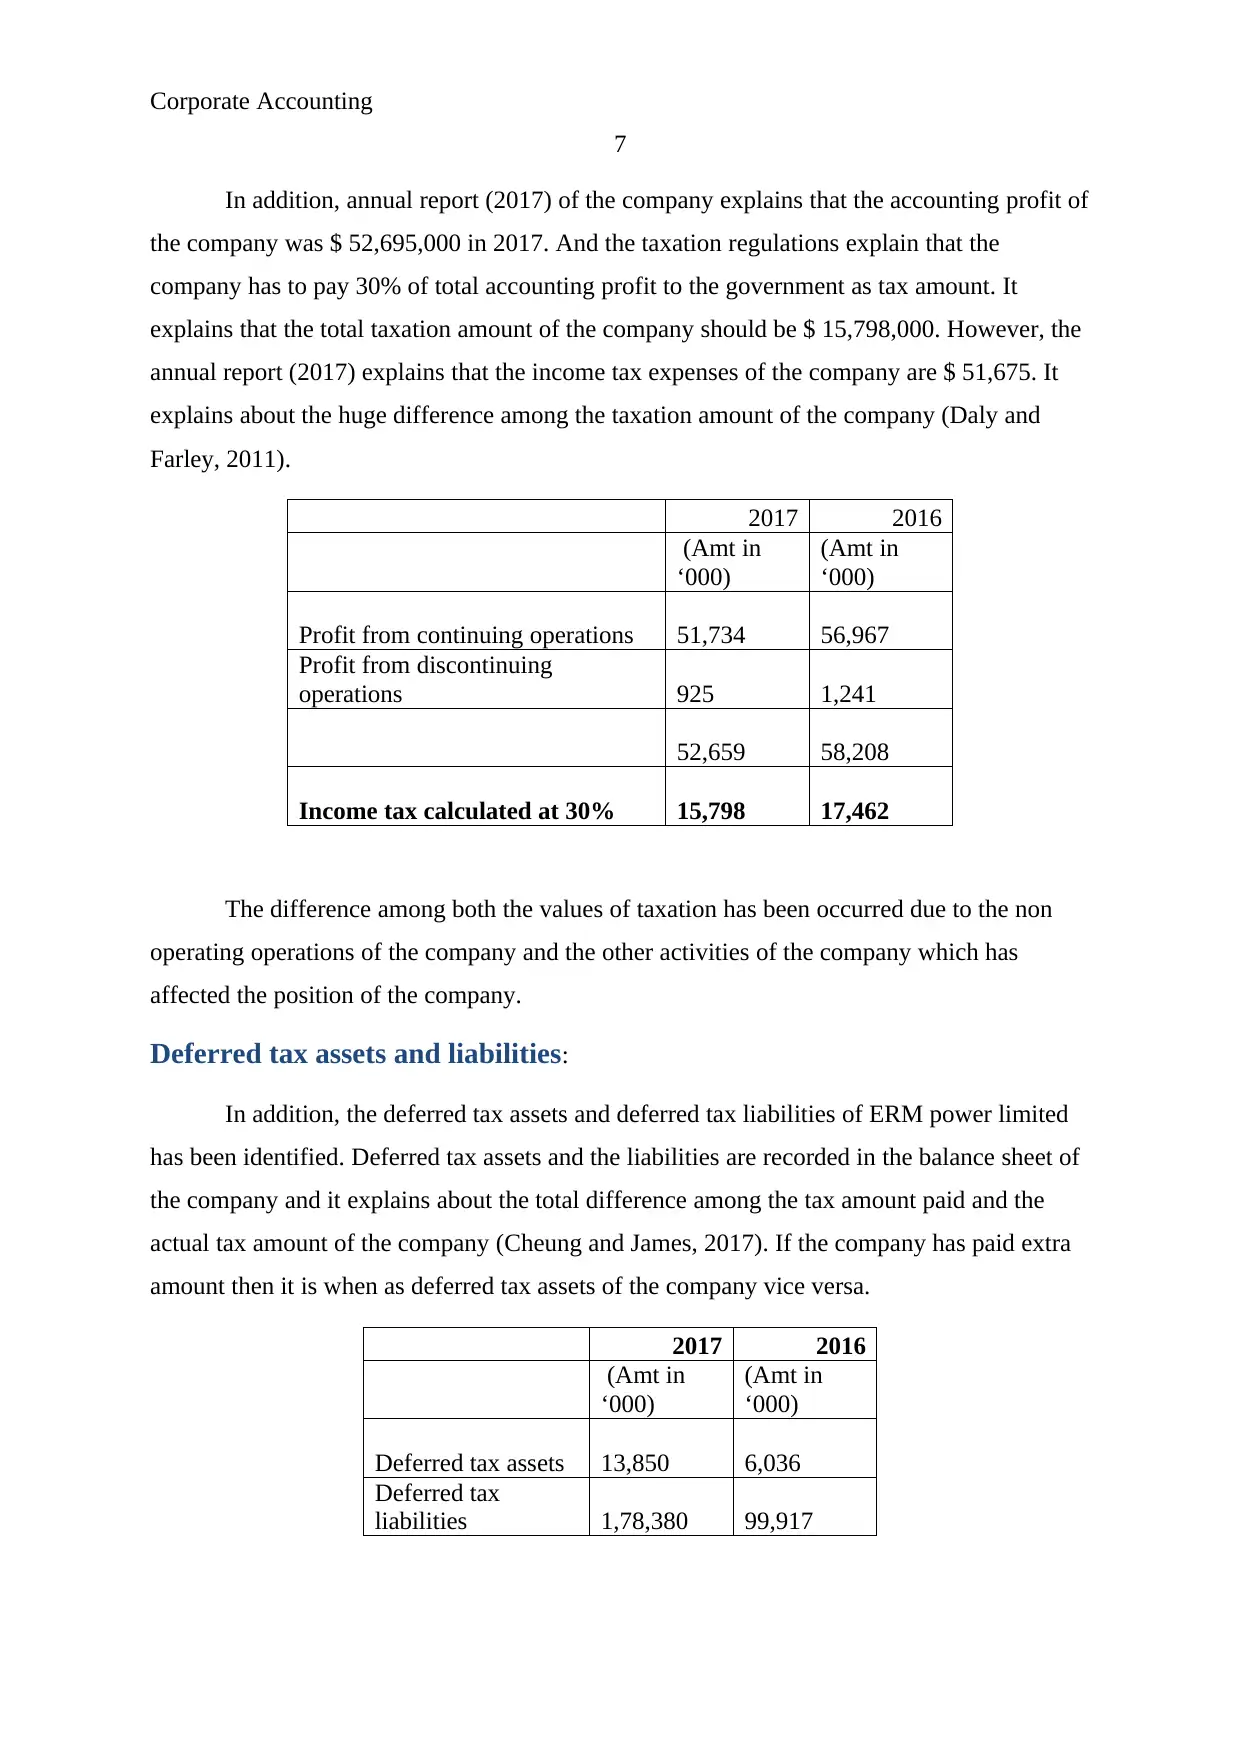
In addition, annual report (2017) of the company explains that the accounting profit of
the company was $ 52,695,000 in 2017. And the taxation regulations explain that the
company has to pay 30% of total accounting profit to the government as tax amount. It
explains that the total taxation amount of the company should be $ 15,798,000. However, the
annual report (2017) explains that the income tax expenses of the company are $ 51,675. It
explains about the huge difference among the taxation amount of the company (Daly and
Farley, 2011).
2017 2016
(Amt in
‘000)
(Amt in
‘000)
Profit from continuing operations 51,734 56,967
Profit from discontinuing
operations 925 1,241
52,659 58,208
Income tax calculated at 30% 15,798 17,462
The difference among both the values of taxation has been occurred due to the non
operating operations of the company and the other activities of the company which has
affected the position of the company.
Deferred tax assets and liabilities:
In addition, the deferred tax assets and deferred tax liabilities of ERM power limited
has been identified. Deferred tax assets and the liabilities are recorded in the balance sheet of
the company and it explains about the total difference among the tax amount paid and the
actual tax amount of the company (Cheung and James, 2017). If the company has paid extra
amount then it is when as deferred tax assets of the company vice versa.
2017 2016
(Amt in
‘000)
(Amt in
‘000)
Deferred tax assets 13,850 6,036
Deferred tax
liabilities 1,78,380 99,917
7
In addition, annual report (2017) of the company explains that the accounting profit of
the company was $ 52,695,000 in 2017. And the taxation regulations explain that the
company has to pay 30% of total accounting profit to the government as tax amount. It
explains that the total taxation amount of the company should be $ 15,798,000. However, the
annual report (2017) explains that the income tax expenses of the company are $ 51,675. It
explains about the huge difference among the taxation amount of the company (Daly and
Farley, 2011).
2017 2016
(Amt in
‘000)
(Amt in
‘000)
Profit from continuing operations 51,734 56,967
Profit from discontinuing
operations 925 1,241
52,659 58,208
Income tax calculated at 30% 15,798 17,462
The difference among both the values of taxation has been occurred due to the non
operating operations of the company and the other activities of the company which has
affected the position of the company.
Deferred tax assets and liabilities:
In addition, the deferred tax assets and deferred tax liabilities of ERM power limited
has been identified. Deferred tax assets and the liabilities are recorded in the balance sheet of
the company and it explains about the total difference among the tax amount paid and the
actual tax amount of the company (Cheung and James, 2017). If the company has paid extra
amount then it is when as deferred tax assets of the company vice versa.
2017 2016
(Amt in
‘000)
(Amt in
‘000)
Deferred tax assets 13,850 6,036
Deferred tax
liabilities 1,78,380 99,917
Paraphrase This Document
Need a fresh take? Get an instant paraphrase of this document with our AI Paraphraser
Corporate Accounting
8
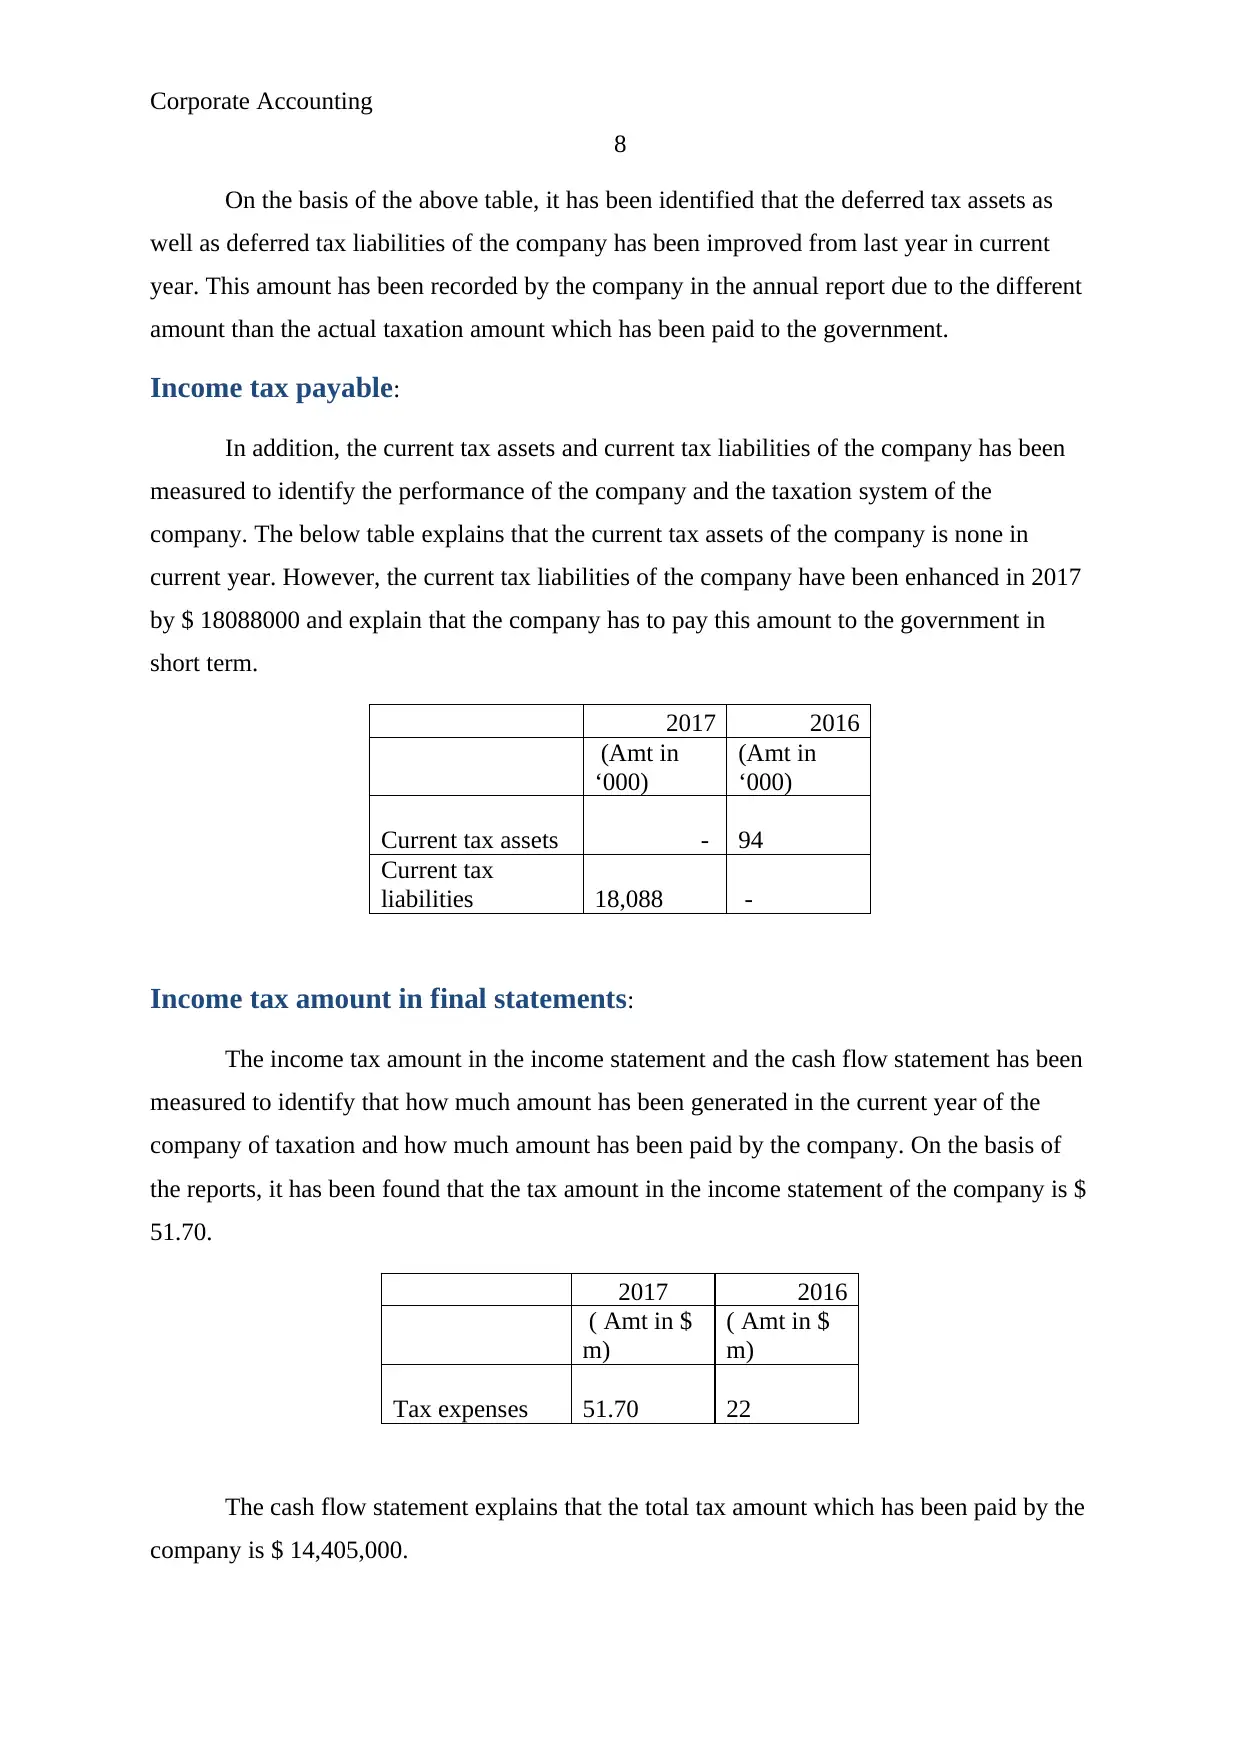
On the basis of the above table, it has been identified that the deferred tax assets as
well as deferred tax liabilities of the company has been improved from last year in current
year. This amount has been recorded by the company in the annual report due to the different
amount than the actual taxation amount which has been paid to the government.
Income tax payable:
In addition, the current tax assets and current tax liabilities of the company has been
measured to identify the performance of the company and the taxation system of the
company. The below table explains that the current tax assets of the company is none in
current year. However, the current tax liabilities of the company have been enhanced in 2017
by $ 18088000 and explain that the company has to pay this amount to the government in
short term.
2017 2016
(Amt in
‘000)
(Amt in
‘000)
Current tax assets - 94
Current tax
liabilities 18,088 -
Income tax amount in final statements:
The income tax amount in the income statement and the cash flow statement has been
measured to identify that how much amount has been generated in the current year of the
company of taxation and how much amount has been paid by the company. On the basis of
the reports, it has been found that the tax amount in the income statement of the company is $
51.70.
2017 2016
( Amt in $
m)
( Amt in $
m)
Tax expenses 51.70 22
The cash flow statement explains that the total tax amount which has been paid by the
company is $ 14,405,000.
8
On the basis of the above table, it has been identified that the deferred tax assets as
well as deferred tax liabilities of the company has been improved from last year in current
year. This amount has been recorded by the company in the annual report due to the different
amount than the actual taxation amount which has been paid to the government.
Income tax payable:
In addition, the current tax assets and current tax liabilities of the company has been
measured to identify the performance of the company and the taxation system of the
company. The below table explains that the current tax assets of the company is none in
current year. However, the current tax liabilities of the company have been enhanced in 2017
by $ 18088000 and explain that the company has to pay this amount to the government in
short term.
2017 2016
(Amt in
‘000)
(Amt in
‘000)
Current tax assets - 94
Current tax
liabilities 18,088 -
Income tax amount in final statements:
The income tax amount in the income statement and the cash flow statement has been
measured to identify that how much amount has been generated in the current year of the
company of taxation and how much amount has been paid by the company. On the basis of
the reports, it has been found that the tax amount in the income statement of the company is $
51.70.
2017 2016
( Amt in $
m)
( Amt in $
m)
Tax expenses 51.70 22
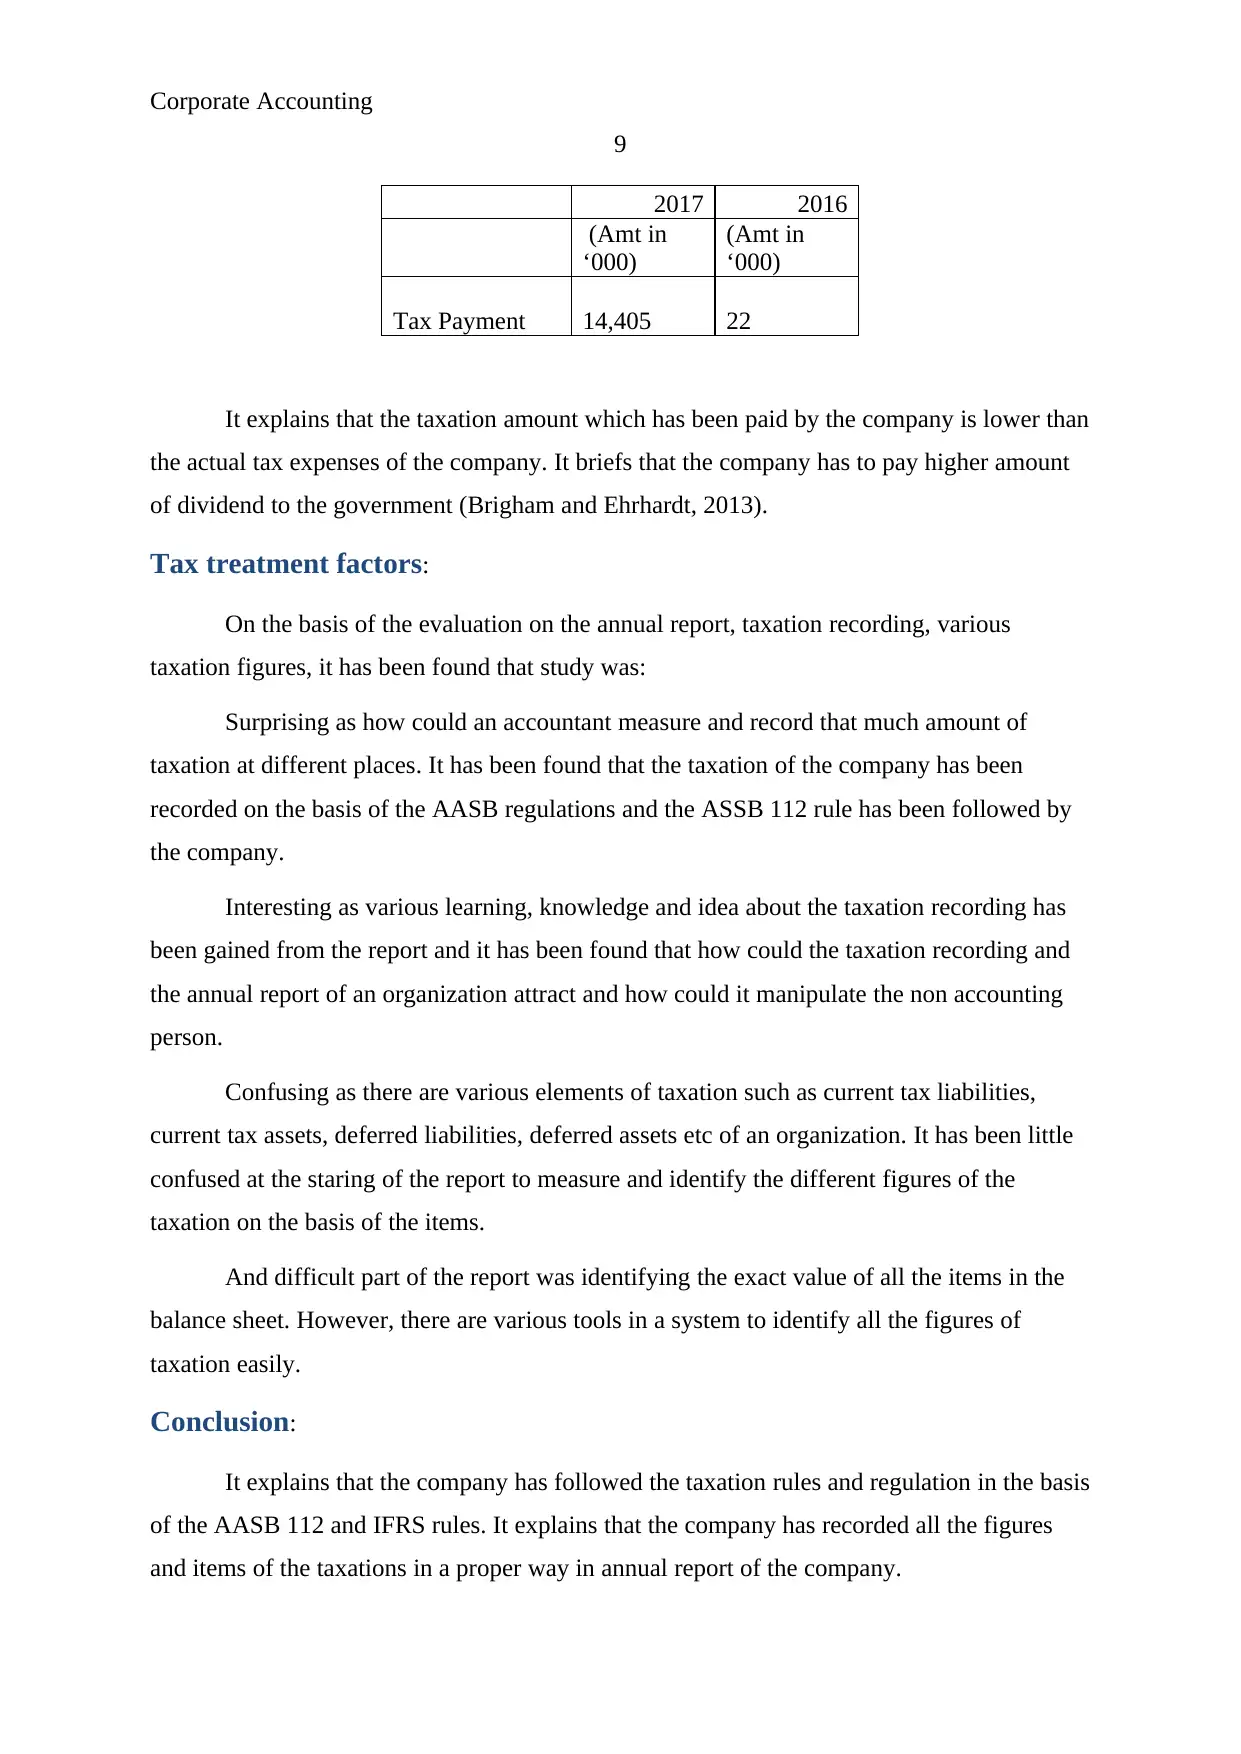
The cash flow statement explains that the total tax amount which has been paid by the
company is $ 14,405,000.
Corporate Accounting
9
2017 2016
(Amt in
‘000)
(Amt in
‘000)
Tax Payment 14,405 22
It explains that the taxation amount which has been paid by the company is lower than
the actual tax expenses of the company. It briefs that the company has to pay higher amount
of dividend to the government (Brigham and Ehrhardt, 2013).
Tax treatment factors:
On the basis of the evaluation on the annual report, taxation recording, various
taxation figures, it has been found that study was:
Surprising as how could an accountant measure and record that much amount of
taxation at different places. It has been found that the taxation of the company has been
recorded on the basis of the AASB regulations and the ASSB 112 rule has been followed by
the company.
Interesting as various learning, knowledge and idea about the taxation recording has
been gained from the report and it has been found that how could the taxation recording and
the annual report of an organization attract and how could it manipulate the non accounting
person.
Confusing as there are various elements of taxation such as current tax liabilities,
current tax assets, deferred liabilities, deferred assets etc of an organization. It has been little
confused at the staring of the report to measure and identify the different figures of the
taxation on the basis of the items.
And difficult part of the report was identifying the exact value of all the items in the
balance sheet. However, there are various tools in a system to identify all the figures of
taxation easily.
Conclusion:
It explains that the company has followed the taxation rules and regulation in the basis
of the AASB 112 and IFRS rules. It explains that the company has recorded all the figures
and items of the taxations in a proper way in annual report of the company.
⊘ This is a preview!⊘
Do you want full access?
Subscribe today to unlock all pages.
Trusted by 1+ million students worldwide
Corporate Accounting
10
References:
Annual report. 2017. ERM power limited. [online]. Available at:
https://www.ermpower.com.au/wp-content/uploads/2017/09/ERM-Annual-Report-
2017_WEB.pdf (accessed 23/5/2018).
Brigham, E.F. and Ehrhardt, M.C., 2013. Financial management: Theory and practice.
Cengage Learning.
Cheung, E. and James L. 2017. "Readability of Notes to the Financial Statements and the
Adoption of IFRS." Australian Accounting Review 26.2 (2016): 162-176.
Daly, H. E., and Farley, J., 2011. Ecological economics: principles andapplications.
Islandpress.
FT 2018. ERM power limited. [online]. Available at:
https://markets.ft.com/data/equities/tearsheet/forecasts?s=EPW:ASX (accessed 23/5/2018).
Garrett, J., Hoitash, R. and Prawitt, D.F., 2014. Trust and financial reporting quality. Journal
of Accounting Research, 52(5), pp.1087-1125.
Glasson, J., Therivel, R., and Chadwick, A., 2013. Introduction to environmental impact
assessment. Routledge.
Home. 2018. ERM power limited. [online]. Available at: https://www.ermpower.com.au/
(accessed 23/5/2018).
Morningstar. 2018. ERM power limited. [online]. Available at
http://financials.morningstar.com/cash-flow/cf.html?t=EPW®ion=aus&culture=en-US
(accessed 23/5/2018).
Pawsey, N., 2016. Project: Review of IFRS adoption in Australia. Accounting Journal.
Shantapriyan, P., O'Donnell, K., Streeter, J. and Hicks, B., 2014. Getting it Right: Directors’
Assessment of Information.
Tran, A., 2015. Can taxable income be estimated from financial reports of listed companies in
Australia?. Browser Download This Paper.
1 out of 10
Related Documents


Your All-in-One AI-Powered Toolkit for Academic Success.
+13062052269
info@desklib.com
Available 24*7 on WhatsApp / Email
![[object Object]](/_next/static/media/star-bottom.7253800d.svg)
Unlock your academic potential
Copyright © 2020–2026 A2Z Services. All Rights Reserved. Developed and managed by ZUCOL.