Corporate Accounting and Financial Statement Analysis of Estia Health
VerifiedAdded on 2020/05/16
|19
|2949
|52
Report
AI Summary
This report provides a detailed financial analysis of Estia Health Ltd., focusing on its corporate accounting practices. The executive summary highlights the assessment of equity, tax expenses, and the treatment of income tax. The analysis includes an examination of the company's equity structure, including issued capital, shared-based payment reserves, and accumulated losses. The report also delves into the company's tax expenses, comparing current and deferred income tax expenses and analyzing the company's tax rate. Furthermore, it explores the deferred tax assets and liabilities, the current tax expense, and compares the income tax expense as per the income statement and cash flow statement. The report includes tables and figures illustrating key financial data and provides insights into the company's financial disclosure practices and compliance with tax laws.

Corporate Accounting
Paraphrase This Document
Need a fresh take? Get an instant paraphrase of this document with our AI Paraphraser
EXECUTIVE SUMMARY
Financial statement analysis can be specified as a procedure for assessing and reviewing
financial information of business comprised in Balance Sheet, Statement of Income, Statement of
change in equity and Cash flow statement. The present report provides a descriptive evaluation
of the financial statements of Estia Health Ltd. Core emphasis has been made on the accounting
treatment of equity and income tax expense during the current year. The present study shows that
treatment of income tax is a complex and detail procedure. Thus, appropriate income tax liability
can be ascertained only after assessing the overall provision of accounting relating to income tax.
TABLE OF CONTENTS
Introduction......................................................................................................................................5
Assessment of Equity......................................................................................................................5
Tax Expenses of the Organization...................................................................................................8
Company Tax Rate Times of Firm Accounting Income.................................................................9
Deferred Tax Asset or Liability.......................................................................................................9
Current Tax Expense.....................................................................................................................10
Income Tax Expense as Per Income Statement and As Per Cash Flow Statement.......................10
Analysis of Treatment of Tax Expense and New Insights Learned From Above Study...............12
Appendices....................................................................................................................................13
Income Statement......................................................................................................................13
Balance Sheet.............................................................................................................................14
Statement of Change in Equity..................................................................................................15
Consolidated statements of Cash Flows....................................................................................16
⊘ This is a preview!⊘
Do you want full access?
Subscribe today to unlock all pages.
Trusted by 1+ million students worldwide

LIST OF FIGURES
Figure 1: The shared Based payment reserve for the year 2017 and 2016......................................7
Figure 1: The shared Based payment reserve for the year 2017 and 2016......................................7
Paraphrase This Document
Need a fresh take? Get an instant paraphrase of this document with our AI Paraphraser
LIST OF TABLES
Table 1: profit attributable to Equity shareholders..........................................................................7
Table 2: The equity structure of the Company in the current and the past year..............................7
Table 3: Tax expenses of Estia Health Limited...............................................................................9
Table 4: Income tax payable for two consecutive years................................................................11
Table 5: Statement of P&L............................................................................................................12
Table 6: Cash Flow Statement.......................................................................................................13
Introduction
The present study is based on the financial analysis of Estia Health Limited. The report analysis
the taxation practices of the Company along with the statement of the equity of the Company.
Estia health is one of the leading providers of aged care services in Australia in the private
sector. The Company is committed to improving their operational performance expanding their
refurbishment plans for which continues to be a major source of earnings growth (Estia Health,
2017). The report highlights the composition of equity, deferred tax assets and liabilities; a
comparison has also been derived with the past figures. The study also depicts the taxation
practices with regards to the income tax payable, the taxation expenses and its compliance with
the Tax laws of the country. The income tax payables as per cash flow statement and as per the
income statement are compared for any variations and the underlying reason behind the same. A
conclusion is made regarding the financial disclosure of the company.
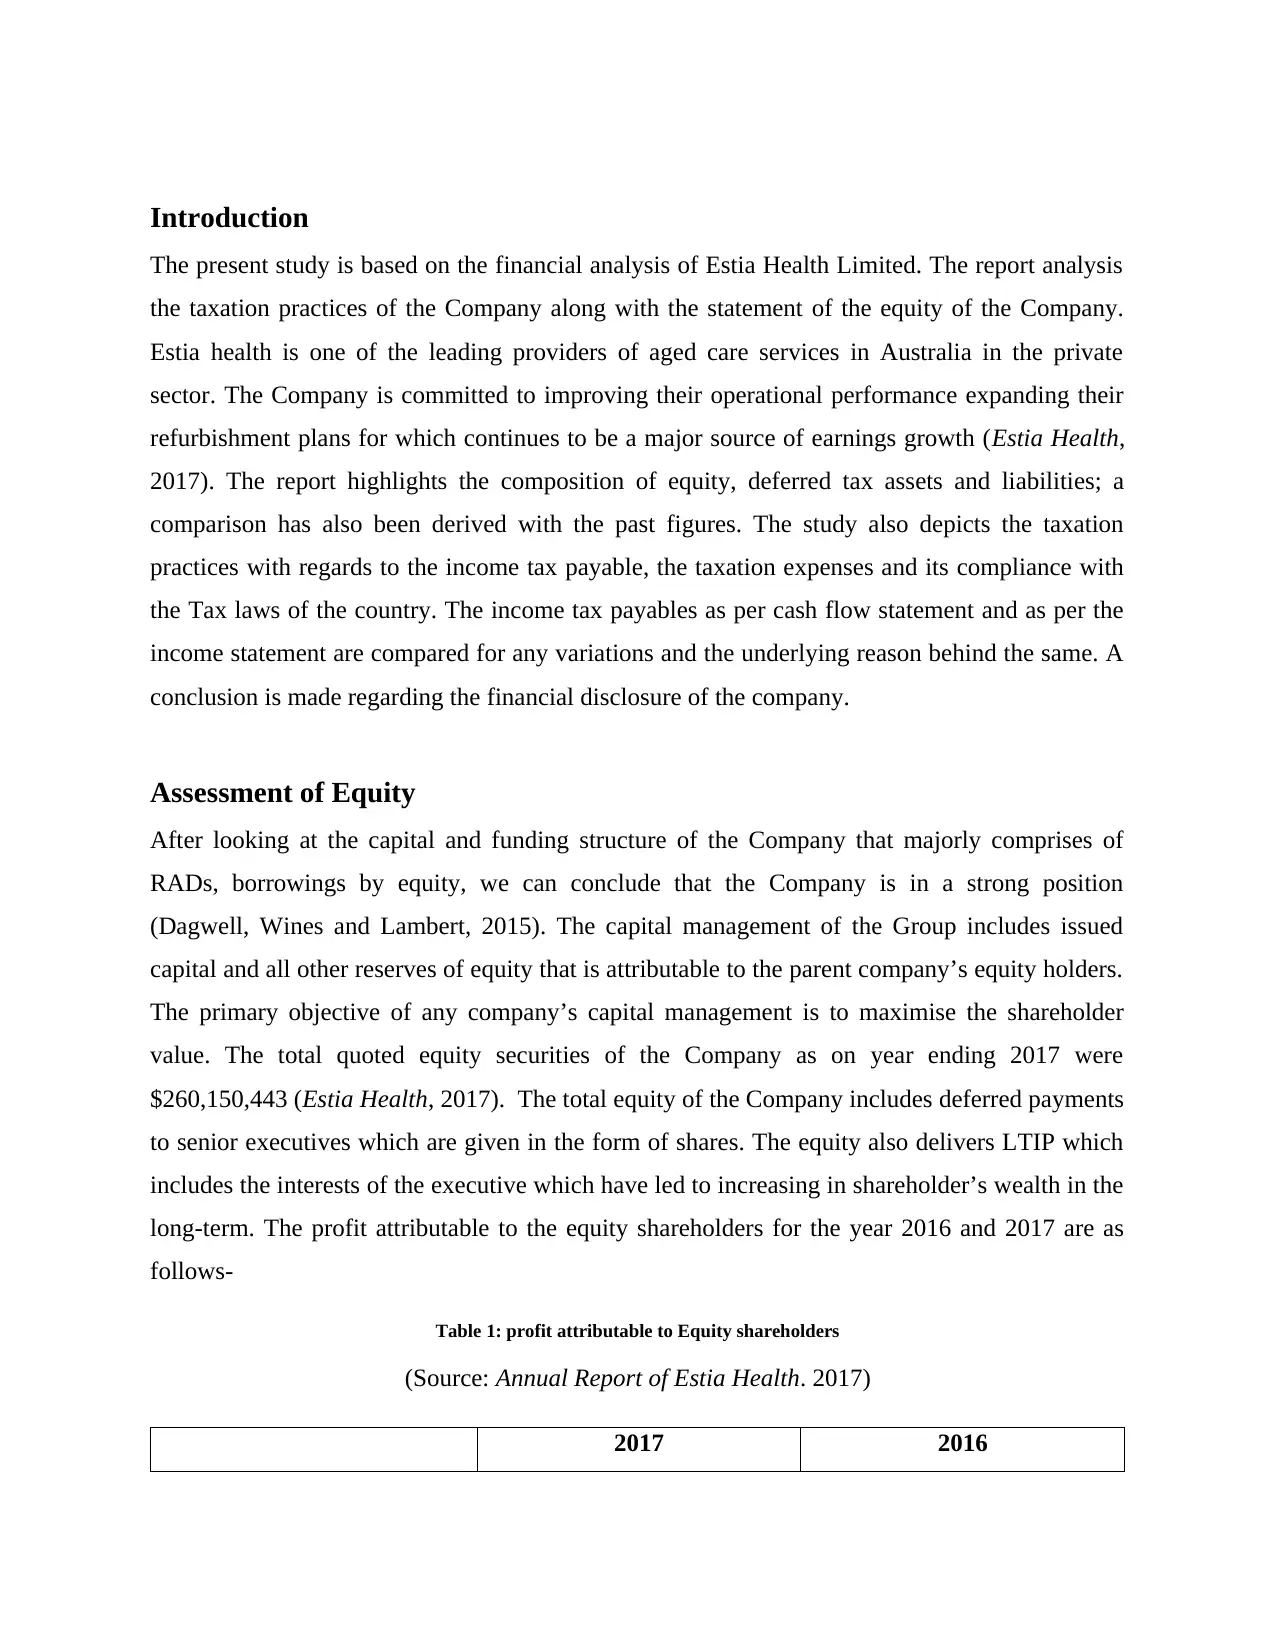
Assessment of Equity
After looking at the capital and funding structure of the Company that majorly comprises of
RADs, borrowings by equity, we can conclude that the Company is in a strong position
(Dagwell, Wines and Lambert, 2015). The capital management of the Group includes issued
capital and all other reserves of equity that is attributable to the parent company’s equity holders.
The primary objective of any company’s capital management is to maximise the shareholder
value. The total quoted equity securities of the Company as on year ending 2017 were
$260,150,443 (Estia Health, 2017). The total equity of the Company includes deferred payments
to senior executives which are given in the form of shares. The equity also delivers LTIP which
includes the interests of the executive which have led to increasing in shareholder’s wealth in the
long-term. The profit attributable to the equity shareholders for the year 2016 and 2017 are as
follows-
Table 1: profit attributable to Equity shareholders
(Source: Annual Report of Estia Health. 2017)
2017 2016
The present study is based on the financial analysis of Estia Health Limited. The report analysis
the taxation practices of the Company along with the statement of the equity of the Company.
Estia health is one of the leading providers of aged care services in Australia in the private
sector. The Company is committed to improving their operational performance expanding their
refurbishment plans for which continues to be a major source of earnings growth (Estia Health,
2017). The report highlights the composition of equity, deferred tax assets and liabilities; a
comparison has also been derived with the past figures. The study also depicts the taxation
practices with regards to the income tax payable, the taxation expenses and its compliance with
the Tax laws of the country. The income tax payables as per cash flow statement and as per the
income statement are compared for any variations and the underlying reason behind the same. A
conclusion is made regarding the financial disclosure of the company.
Assessment of Equity
After looking at the capital and funding structure of the Company that majorly comprises of
RADs, borrowings by equity, we can conclude that the Company is in a strong position
(Dagwell, Wines and Lambert, 2015). The capital management of the Group includes issued
capital and all other reserves of equity that is attributable to the parent company’s equity holders.
The primary objective of any company’s capital management is to maximise the shareholder
value. The total quoted equity securities of the Company as on year ending 2017 were
$260,150,443 (Estia Health, 2017). The total equity of the Company includes deferred payments
to senior executives which are given in the form of shares. The equity also delivers LTIP which
includes the interests of the executive which have led to increasing in shareholder’s wealth in the
long-term. The profit attributable to the equity shareholders for the year 2016 and 2017 are as
follows-
Table 1: profit attributable to Equity shareholders
(Source: Annual Report of Estia Health. 2017)
2017 2016
⊘ This is a preview!⊘
Do you want full access?
Subscribe today to unlock all pages.
Trusted by 1+ million students worldwide
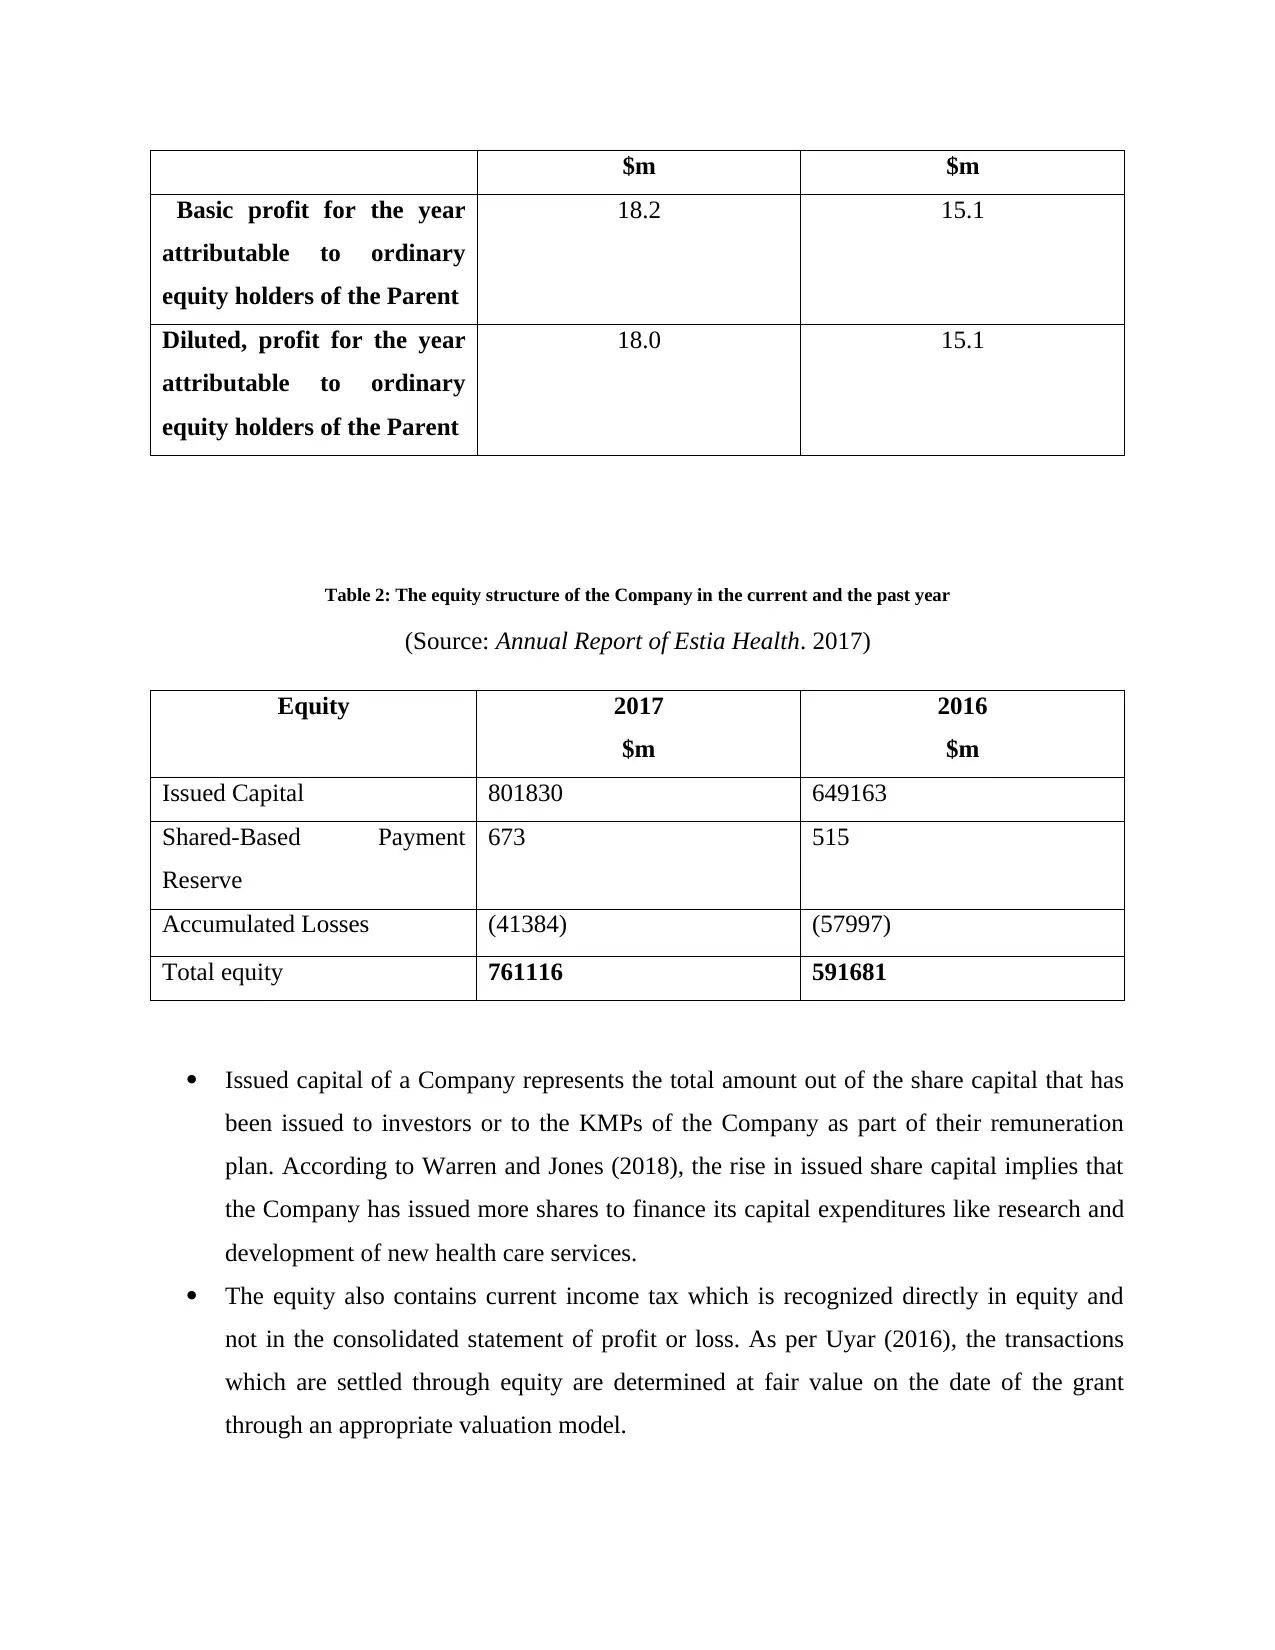
$m $m
Basic profit for the year
attributable to ordinary
equity holders of the Parent
18.2 15.1
Diluted, profit for the year
attributable to ordinary
equity holders of the Parent
18.0 15.1
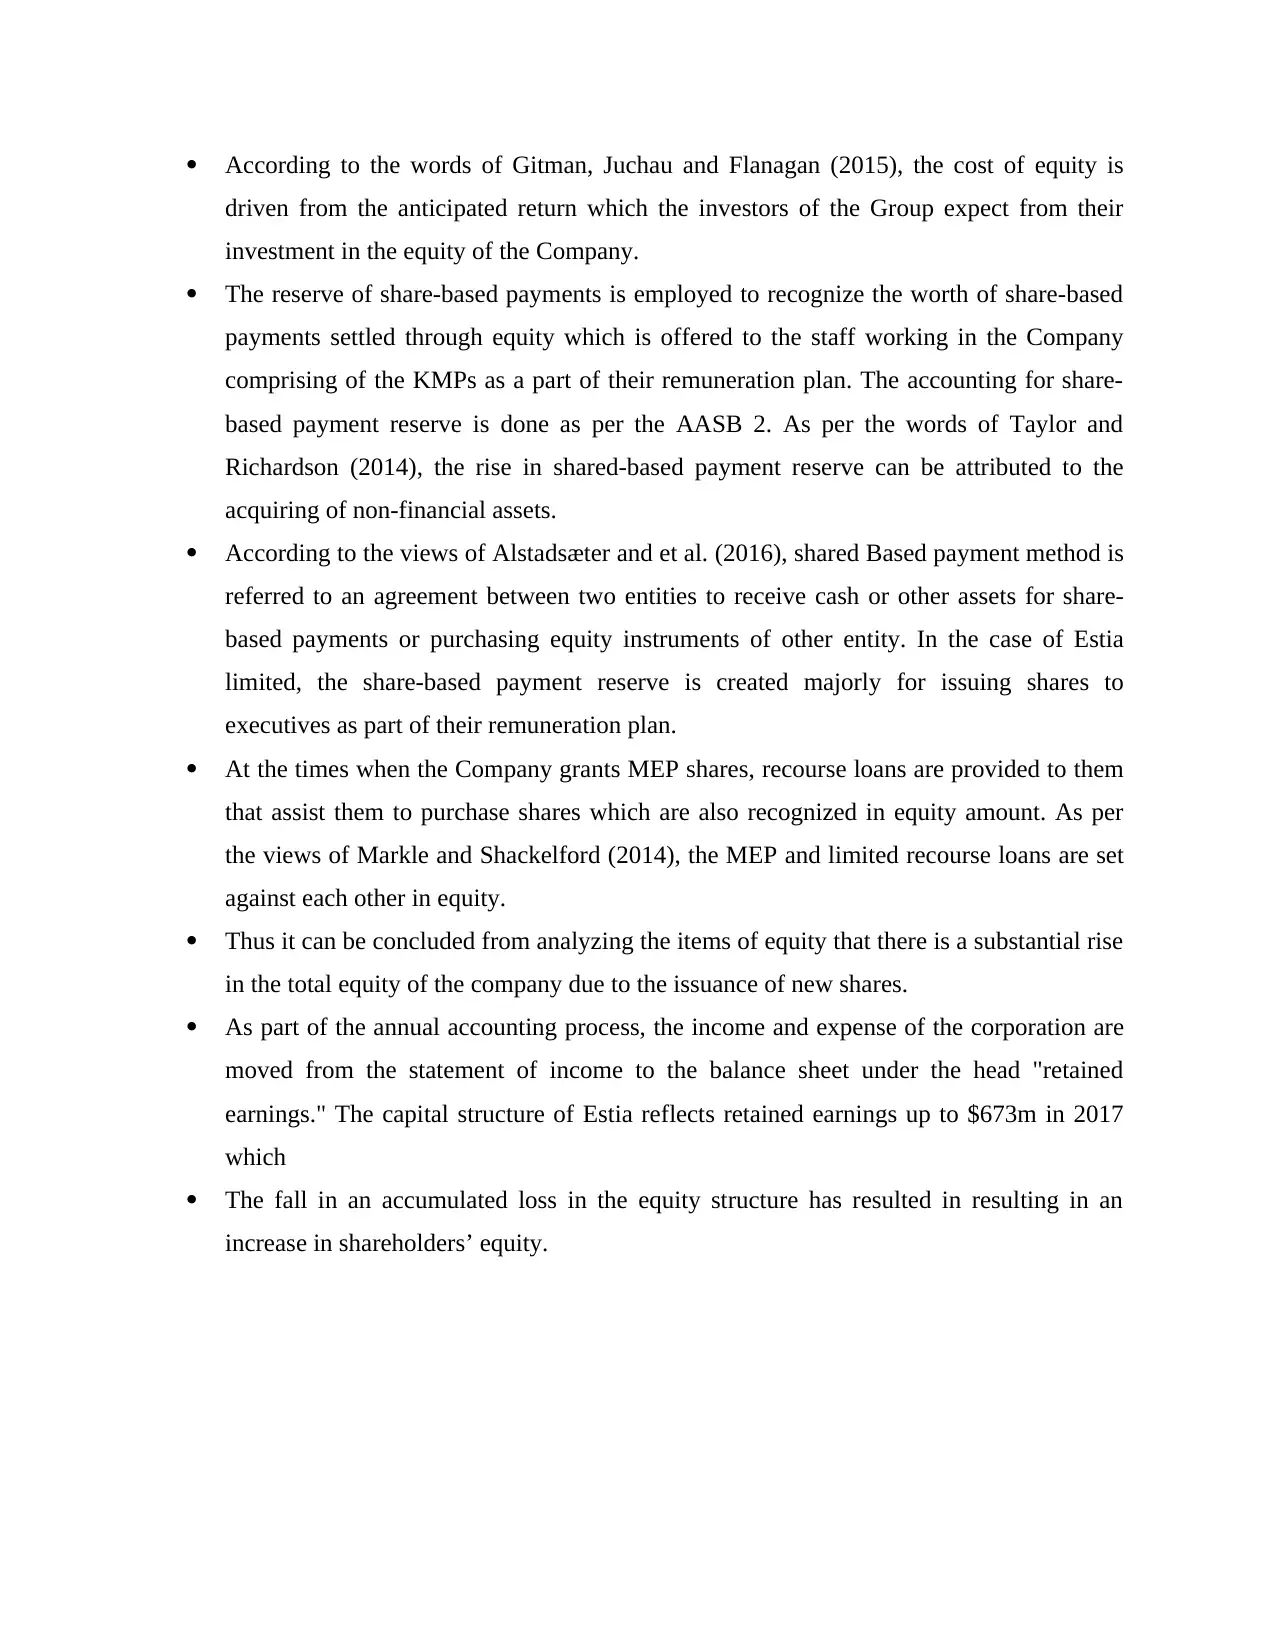
Table 2: The equity structure of the Company in the current and the past year
(Source: Annual Report of Estia Health. 2017)
Equity 2017
$m
2016
$m
Issued Capital 801830 649163
Shared-Based Payment
Reserve
673 515
Accumulated Losses (41384) (57997)
Total equity 761116 591681
Issued capital of a Company represents the total amount out of the share capital that has
been issued to investors or to the KMPs of the Company as part of their remuneration
plan. According to Warren and Jones (2018), the rise in issued share capital implies that
the Company has issued more shares to finance its capital expenditures like research and
development of new health care services.
The equity also contains current income tax which is recognized directly in equity and
not in the consolidated statement of profit or loss. As per Uyar (2016), the transactions
which are settled through equity are determined at fair value on the date of the grant
through an appropriate valuation model.
Basic profit for the year
attributable to ordinary
equity holders of the Parent
18.2 15.1
Diluted, profit for the year
attributable to ordinary
equity holders of the Parent
18.0 15.1
Table 2: The equity structure of the Company in the current and the past year
(Source: Annual Report of Estia Health. 2017)
Equity 2017
$m
2016
$m
Issued Capital 801830 649163
Shared-Based Payment
Reserve
673 515
Accumulated Losses (41384) (57997)
Total equity 761116 591681
Issued capital of a Company represents the total amount out of the share capital that has
been issued to investors or to the KMPs of the Company as part of their remuneration
plan. According to Warren and Jones (2018), the rise in issued share capital implies that
the Company has issued more shares to finance its capital expenditures like research and
development of new health care services.
The equity also contains current income tax which is recognized directly in equity and
not in the consolidated statement of profit or loss. As per Uyar (2016), the transactions
which are settled through equity are determined at fair value on the date of the grant
through an appropriate valuation model.
Paraphrase This Document
Need a fresh take? Get an instant paraphrase of this document with our AI Paraphraser
According to the words of Gitman, Juchau and Flanagan (2015), the cost of equity is
driven from the anticipated return which the investors of the Group expect from their
investment in the equity of the Company.
The reserve of share-based payments is employed to recognize the worth of share-based
payments settled through equity which is offered to the staff working in the Company
comprising of the KMPs as a part of their remuneration plan. The accounting for share-
based payment reserve is done as per the AASB 2. As per the words of Taylor and
Richardson (2014), the rise in shared-based payment reserve can be attributed to the
acquiring of non-financial assets.
According to the views of Alstadsæter and et al. (2016), shared Based payment method is
referred to an agreement between two entities to receive cash or other assets for share-
based payments or purchasing equity instruments of other entity. In the case of Estia
limited, the share-based payment reserve is created majorly for issuing shares to
executives as part of their remuneration plan.
At the times when the Company grants MEP shares, recourse loans are provided to them
that assist them to purchase shares which are also recognized in equity amount. As per
the views of Markle and Shackelford (2014), the MEP and limited recourse loans are set
against each other in equity.
Thus it can be concluded from analyzing the items of equity that there is a substantial rise
in the total equity of the company due to the issuance of new shares.
As part of the annual accounting process, the income and expense of the corporation are
moved from the statement of income to the balance sheet under the head "retained
earnings." The capital structure of Estia reflects retained earnings up to $673m in 2017
which
The fall in an accumulated loss in the equity structure has resulted in resulting in an
increase in shareholders’ equity.
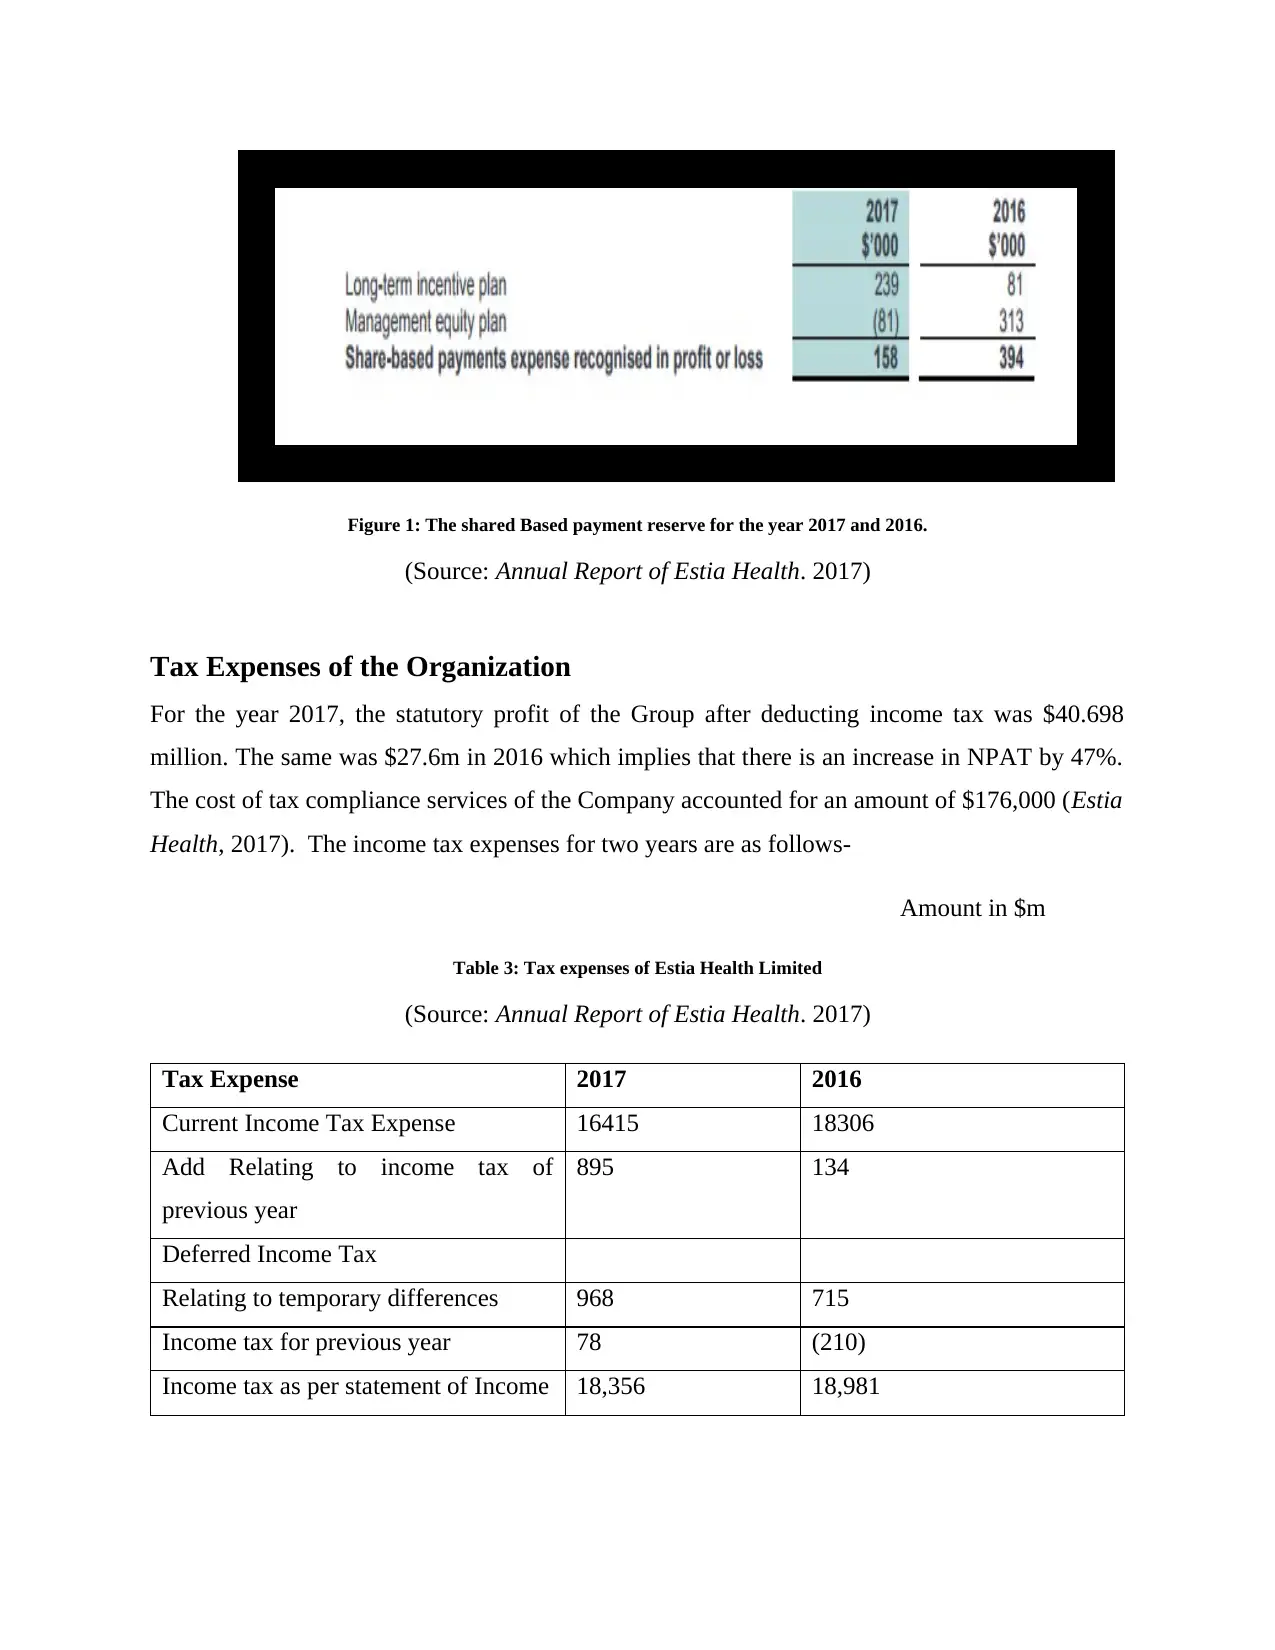
Figure 1: The shared Based payment reserve for the year 2017 and 2016.
(Source: Annual Report of Estia Health. 2017)
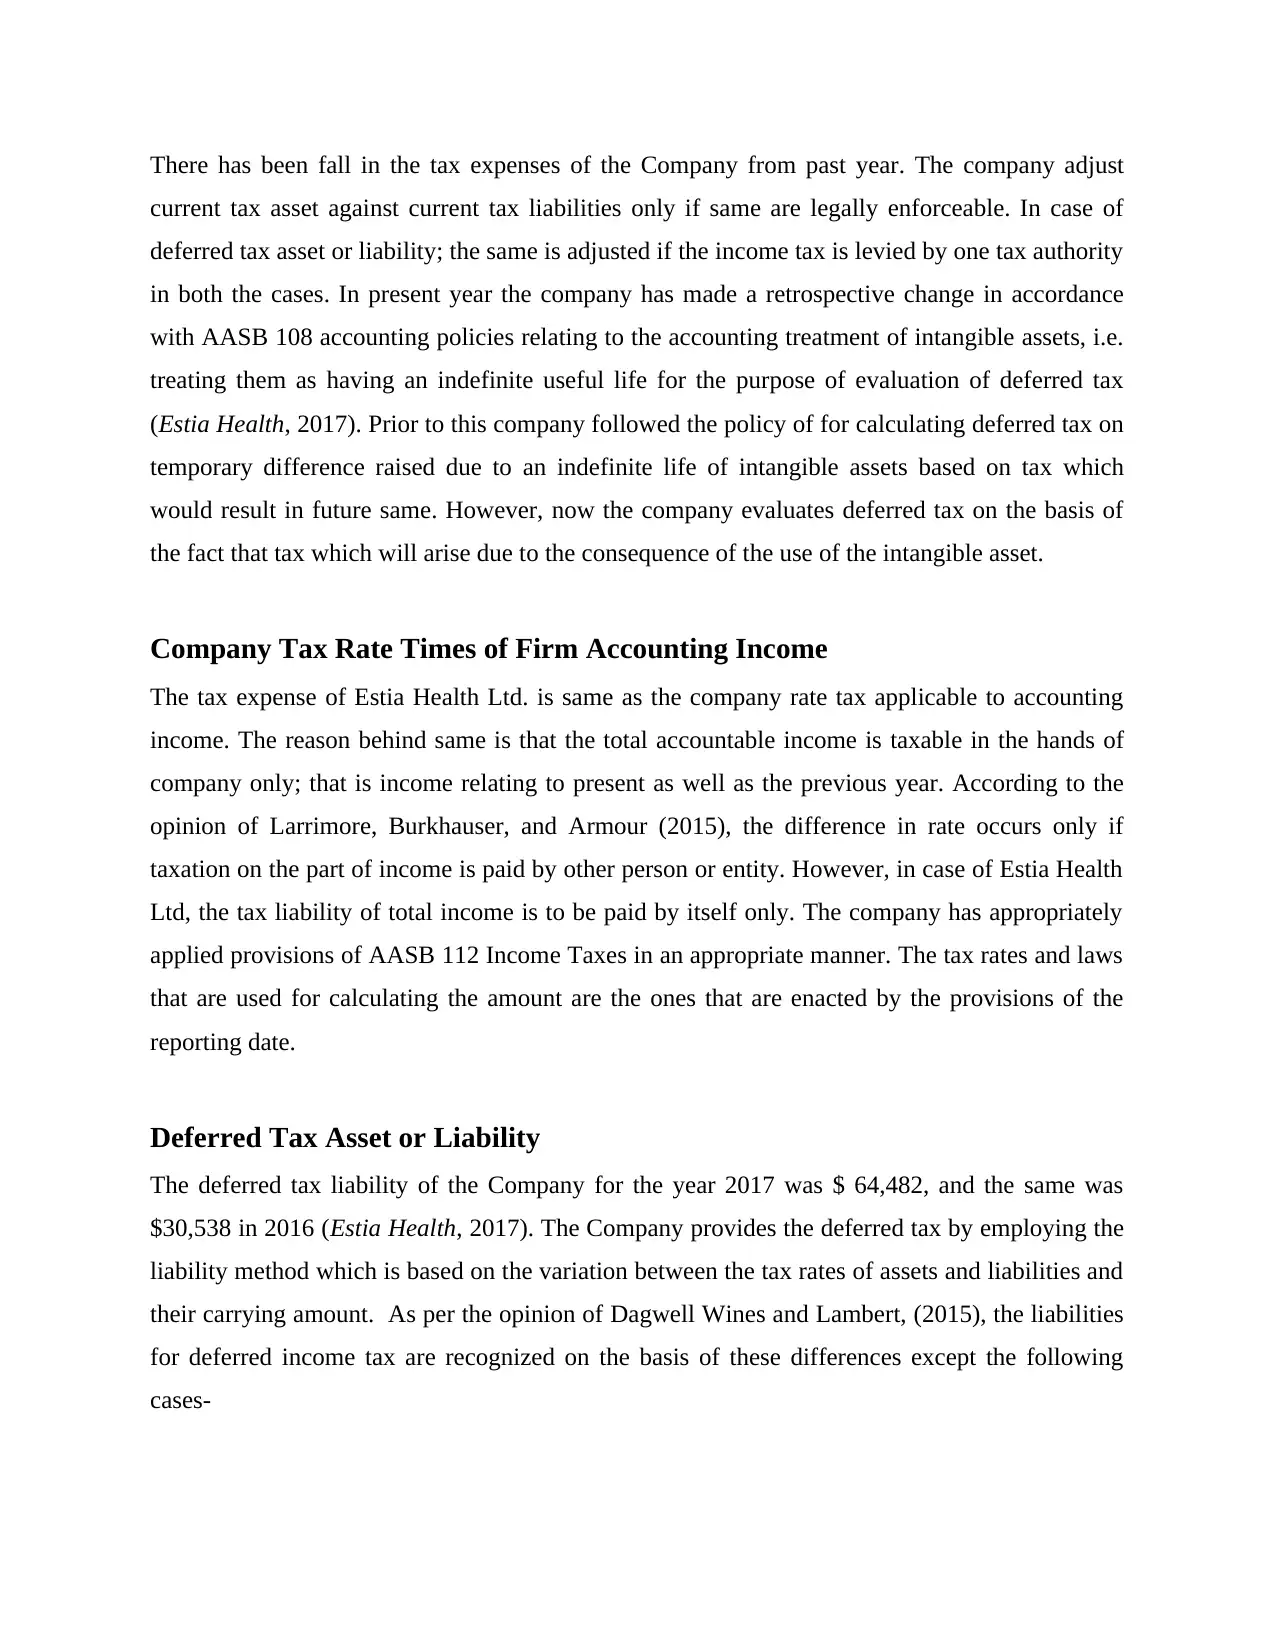
Tax Expenses of the Organization
For the year 2017, the statutory profit of the Group after deducting income tax was $40.698
million. The same was $27.6m in 2016 which implies that there is an increase in NPAT by 47%.
The cost of tax compliance services of the Company accounted for an amount of $176,000 (Estia
Health, 2017). The income tax expenses for two years are as follows-
Amount in $m
Table 3: Tax expenses of Estia Health Limited
(Source: Annual Report of Estia Health. 2017)
Tax Expense 2017 2016
Current Income Tax Expense 16415 18306
Add Relating to income tax of
previous year
895 134
Deferred Income Tax
Relating to temporary differences 968 715
Income tax for previous year 78 (210)
Income tax as per statement of Income 18,356 18,981
(Source: Annual Report of Estia Health. 2017)
Tax Expenses of the Organization
For the year 2017, the statutory profit of the Group after deducting income tax was $40.698
million. The same was $27.6m in 2016 which implies that there is an increase in NPAT by 47%.
The cost of tax compliance services of the Company accounted for an amount of $176,000 (Estia
Health, 2017). The income tax expenses for two years are as follows-
Amount in $m
Table 3: Tax expenses of Estia Health Limited
(Source: Annual Report of Estia Health. 2017)
Tax Expense 2017 2016
Current Income Tax Expense 16415 18306
Add Relating to income tax of
previous year
895 134
Deferred Income Tax
Relating to temporary differences 968 715
Income tax for previous year 78 (210)
Income tax as per statement of Income 18,356 18,981
⊘ This is a preview!⊘
Do you want full access?
Subscribe today to unlock all pages.
Trusted by 1+ million students worldwide
There has been fall in the tax expenses of the Company from past year. The company adjust
current tax asset against current tax liabilities only if same are legally enforceable. In case of
deferred tax asset or liability; the same is adjusted if the income tax is levied by one tax authority
in both the cases. In present year the company has made a retrospective change in accordance
with AASB 108 accounting policies relating to the accounting treatment of intangible assets, i.e.
treating them as having an indefinite useful life for the purpose of evaluation of deferred tax
(Estia Health, 2017). Prior to this company followed the policy of for calculating deferred tax on
temporary difference raised due to an indefinite life of intangible assets based on tax which
would result in future same. However, now the company evaluates deferred tax on the basis of
the fact that tax which will arise due to the consequence of the use of the intangible asset.
Company Tax Rate Times of Firm Accounting Income
The tax expense of Estia Health Ltd. is same as the company rate tax applicable to accounting
income. The reason behind same is that the total accountable income is taxable in the hands of
company only; that is income relating to present as well as the previous year. According to the
opinion of Larrimore, Burkhauser, and Armour (2015), the difference in rate occurs only if
taxation on the part of income is paid by other person or entity. However, in case of Estia Health
Ltd, the tax liability of total income is to be paid by itself only. The company has appropriately
applied provisions of AASB 112 Income Taxes in an appropriate manner. The tax rates and laws
that are used for calculating the amount are the ones that are enacted by the provisions of the
reporting date.
Deferred Tax Asset or Liability
The deferred tax liability of the Company for the year 2017 was $ 64,482, and the same was
$30,538 in 2016 (Estia Health, 2017). The Company provides the deferred tax by employing the
liability method which is based on the variation between the tax rates of assets and liabilities and
their carrying amount. As per the opinion of Dagwell Wines and Lambert, (2015), the liabilities
for deferred income tax are recognized on the basis of these differences except the following
cases-
Paraphrase This Document
Need a fresh take? Get an instant paraphrase of this document with our AI Paraphraser
Asset or liability that does not account for any profit or loss at the time of the transaction
and is not a part of the business combination.
In cases of investment in the joint venture and subsidiaries and associates.
In cases where the reversal of temporary difference is controllable, and the Company is
certain that the reversal will not occur in new future.
In accordance with Warren and Jones (2018), the current assets related to deferring taxes are also
recognized at temporary differences and the unused tax credits are carrying forwarded along with
any losses in the same. The Deferred tax assets are recognized to the limit where it is possible
that the taxable profit will will be sufficient to set off against the temporary difference. The
deferred tax assets’ carrying amount is reviewed every year, and changes are reflected if
required. The deferred tax assets are measured at tax rates prevailing in the year in which the
asset or liability is settled.
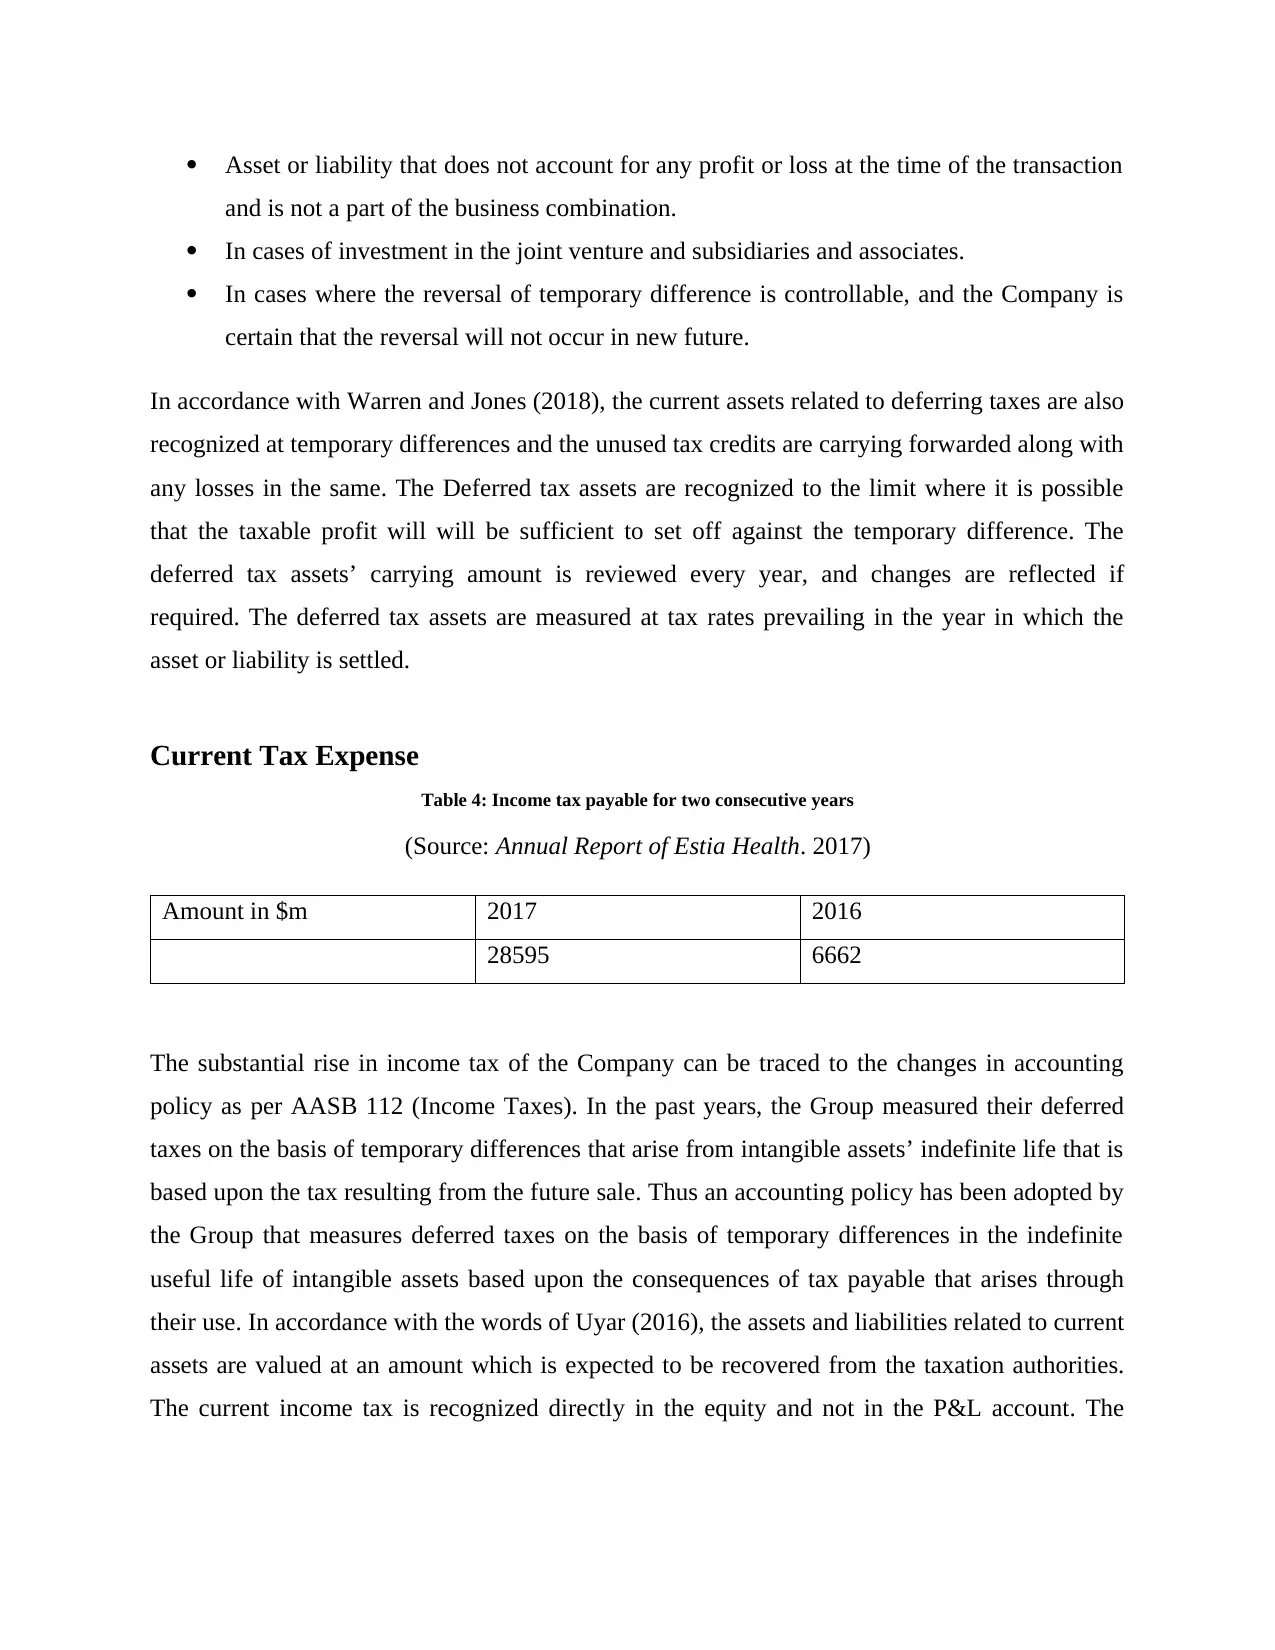
Current Tax Expense
Table 4: Income tax payable for two consecutive years
(Source: Annual Report of Estia Health. 2017)
Amount in $m 2017 2016
28595 6662
The substantial rise in income tax of the Company can be traced to the changes in accounting
policy as per AASB 112 (Income Taxes). In the past years, the Group measured their deferred
taxes on the basis of temporary differences that arise from intangible assets’ indefinite life that is
based upon the tax resulting from the future sale. Thus an accounting policy has been adopted by
the Group that measures deferred taxes on the basis of temporary differences in the indefinite
useful life of intangible assets based upon the consequences of tax payable that arises through
their use. In accordance with the words of Uyar (2016), the assets and liabilities related to current
assets are valued at an amount which is expected to be recovered from the taxation authorities.
The current income tax is recognized directly in the equity and not in the P&L account. The
and is not a part of the business combination.
In cases of investment in the joint venture and subsidiaries and associates.
In cases where the reversal of temporary difference is controllable, and the Company is
certain that the reversal will not occur in new future.
In accordance with Warren and Jones (2018), the current assets related to deferring taxes are also
recognized at temporary differences and the unused tax credits are carrying forwarded along with
any losses in the same. The Deferred tax assets are recognized to the limit where it is possible
that the taxable profit will will be sufficient to set off against the temporary difference. The
deferred tax assets’ carrying amount is reviewed every year, and changes are reflected if
required. The deferred tax assets are measured at tax rates prevailing in the year in which the
asset or liability is settled.
Current Tax Expense
Table 4: Income tax payable for two consecutive years
(Source: Annual Report of Estia Health. 2017)
Amount in $m 2017 2016
28595 6662
The substantial rise in income tax of the Company can be traced to the changes in accounting
policy as per AASB 112 (Income Taxes). In the past years, the Group measured their deferred
taxes on the basis of temporary differences that arise from intangible assets’ indefinite life that is
based upon the tax resulting from the future sale. Thus an accounting policy has been adopted by
the Group that measures deferred taxes on the basis of temporary differences in the indefinite
useful life of intangible assets based upon the consequences of tax payable that arises through
their use. In accordance with the words of Uyar (2016), the assets and liabilities related to current
assets are valued at an amount which is expected to be recovered from the taxation authorities.
The current income tax is recognized directly in the equity and not in the P&L account. The
management regularly reviews the applicable tax regulations to ensure that the accounting is
done as per the norms.
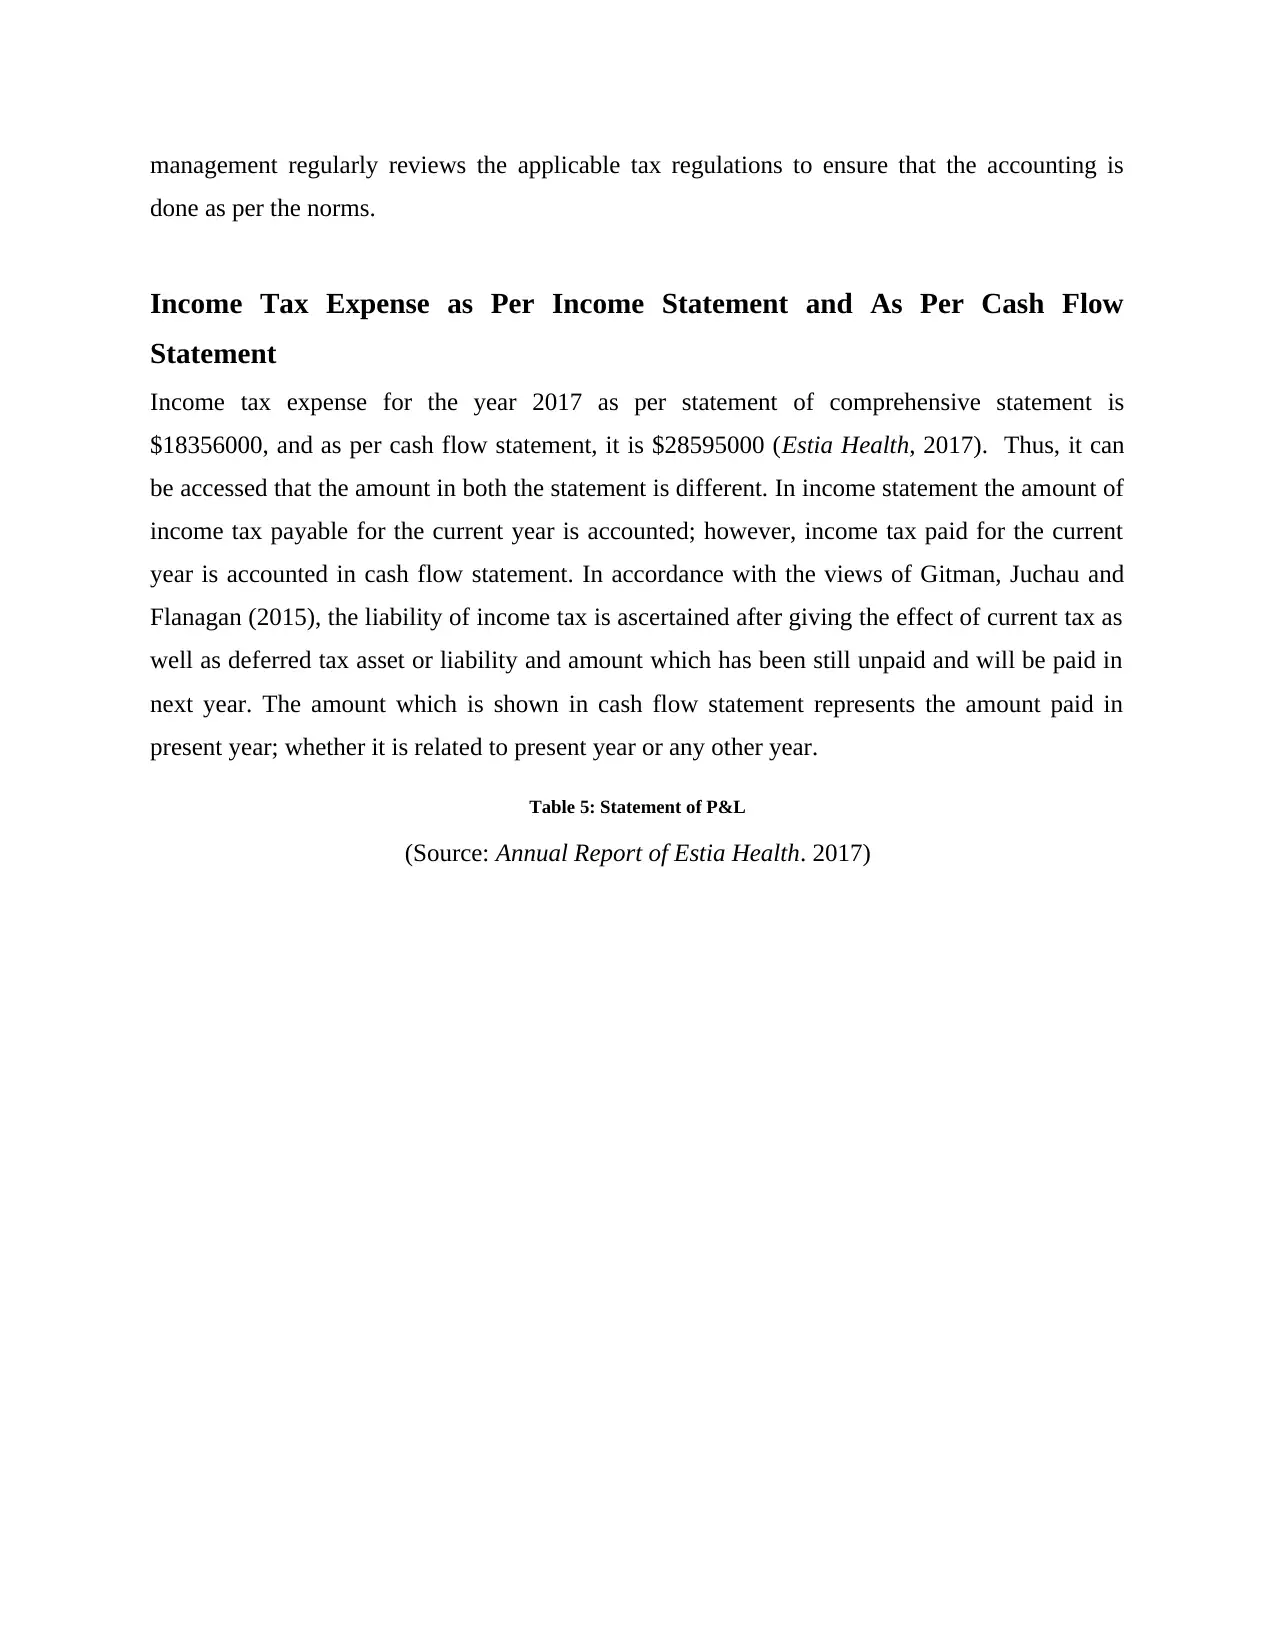
Income Tax Expense as Per Income Statement and As Per Cash Flow
Statement
Income tax expense for the year 2017 as per statement of comprehensive statement is
$18356000, and as per cash flow statement, it is $28595000 (Estia Health, 2017). Thus, it can
be accessed that the amount in both the statement is different. In income statement the amount of
income tax payable for the current year is accounted; however, income tax paid for the current
year is accounted in cash flow statement. In accordance with the views of Gitman, Juchau and
Flanagan (2015), the liability of income tax is ascertained after giving the effect of current tax as
well as deferred tax asset or liability and amount which has been still unpaid and will be paid in
next year. The amount which is shown in cash flow statement represents the amount paid in
present year; whether it is related to present year or any other year.
Table 5: Statement of P&L
(Source: Annual Report of Estia Health. 2017)
done as per the norms.
Income Tax Expense as Per Income Statement and As Per Cash Flow
Statement
Income tax expense for the year 2017 as per statement of comprehensive statement is
$18356000, and as per cash flow statement, it is $28595000 (Estia Health, 2017). Thus, it can
be accessed that the amount in both the statement is different. In income statement the amount of
income tax payable for the current year is accounted; however, income tax paid for the current
year is accounted in cash flow statement. In accordance with the views of Gitman, Juchau and
Flanagan (2015), the liability of income tax is ascertained after giving the effect of current tax as
well as deferred tax asset or liability and amount which has been still unpaid and will be paid in
next year. The amount which is shown in cash flow statement represents the amount paid in
present year; whether it is related to present year or any other year.
Table 5: Statement of P&L
(Source: Annual Report of Estia Health. 2017)
⊘ This is a preview!⊘
Do you want full access?
Subscribe today to unlock all pages.
Trusted by 1+ million students worldwide
1 out of 19
Related Documents


Your All-in-One AI-Powered Toolkit for Academic Success.
+13062052269
info@desklib.com
Available 24*7 on WhatsApp / Email
![[object Object]](/_next/static/media/star-bottom.7253800d.svg)
Unlock your academic potential
Copyright © 2020–2026 A2Z Services. All Rights Reserved. Developed and managed by ZUCOL.