ETT Infrastructure Upgrade: Managerial Finance Report Analysis

Verified

Added on  2023/03/23

|4
|1634
|36
Report
AI Summary
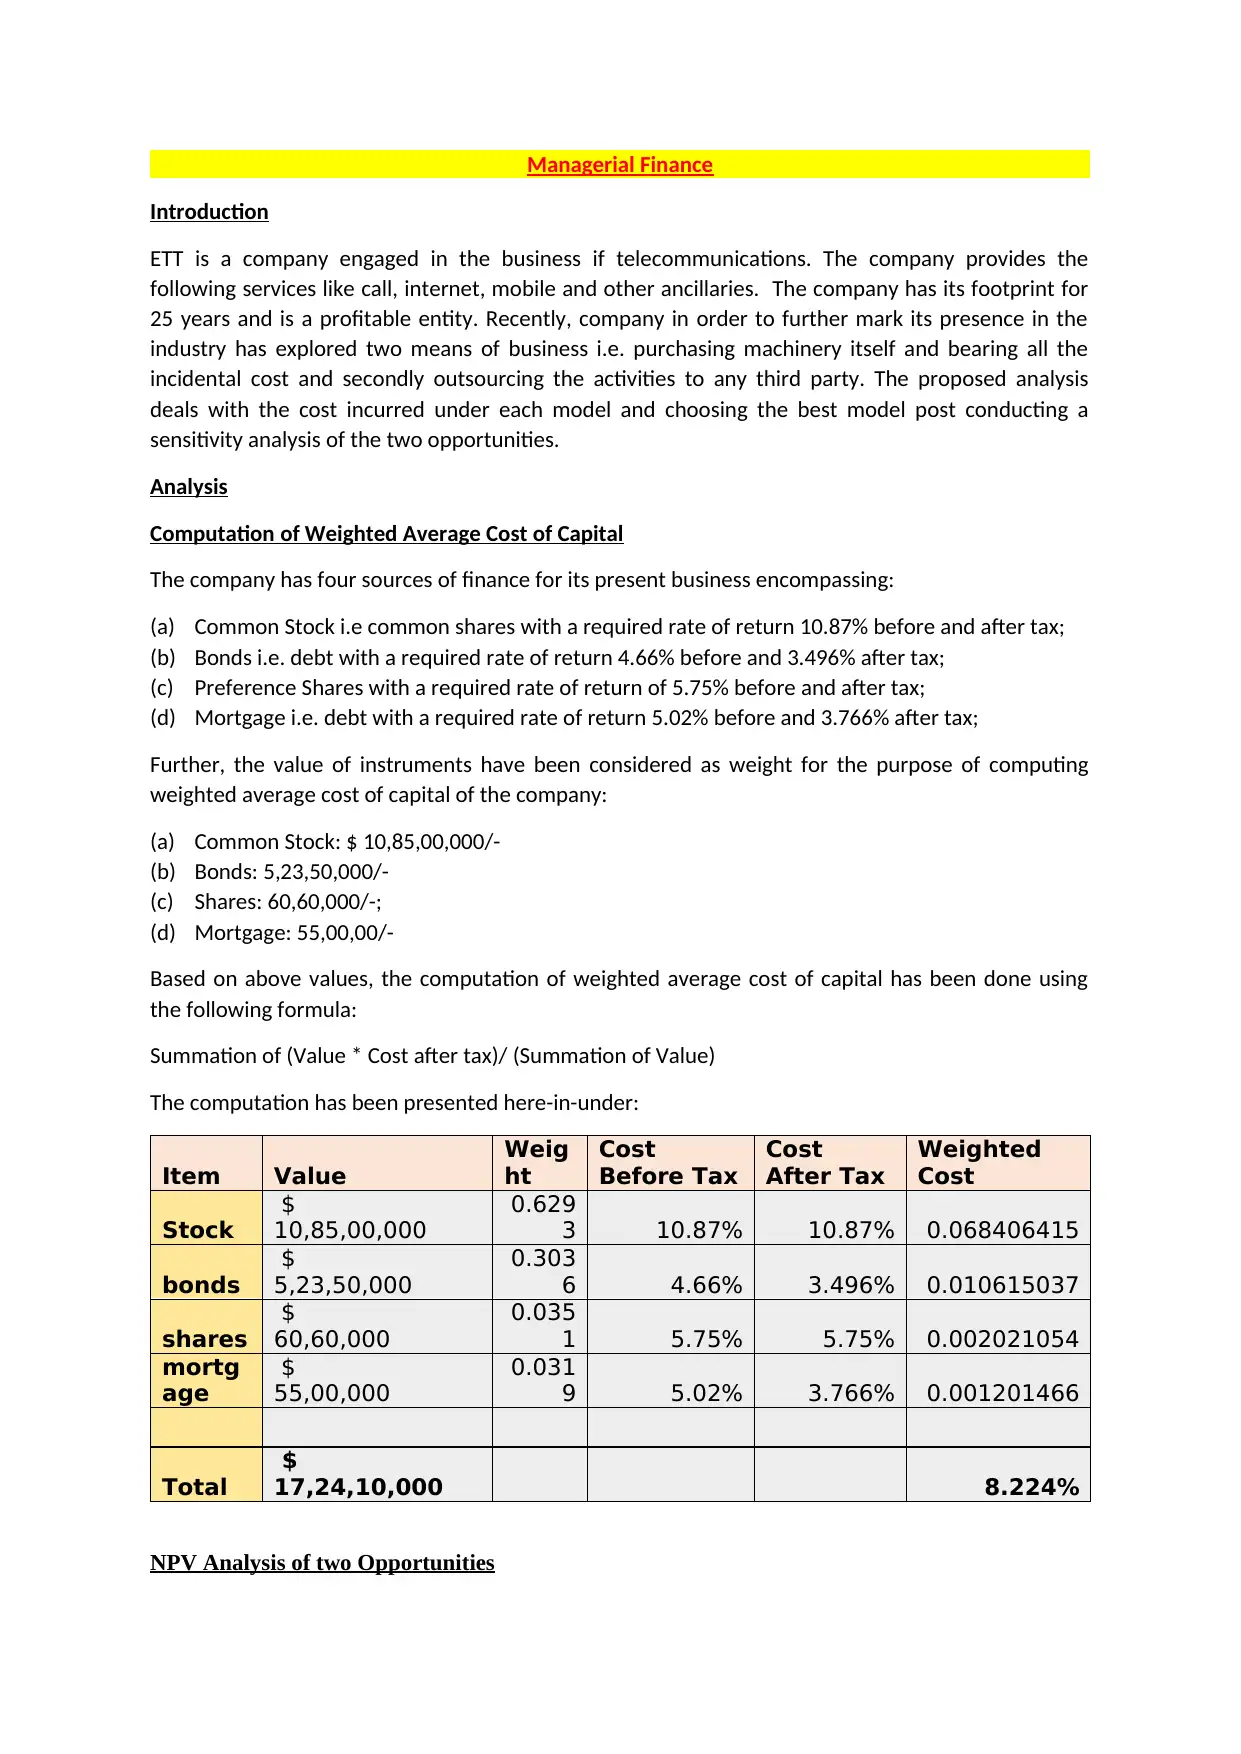
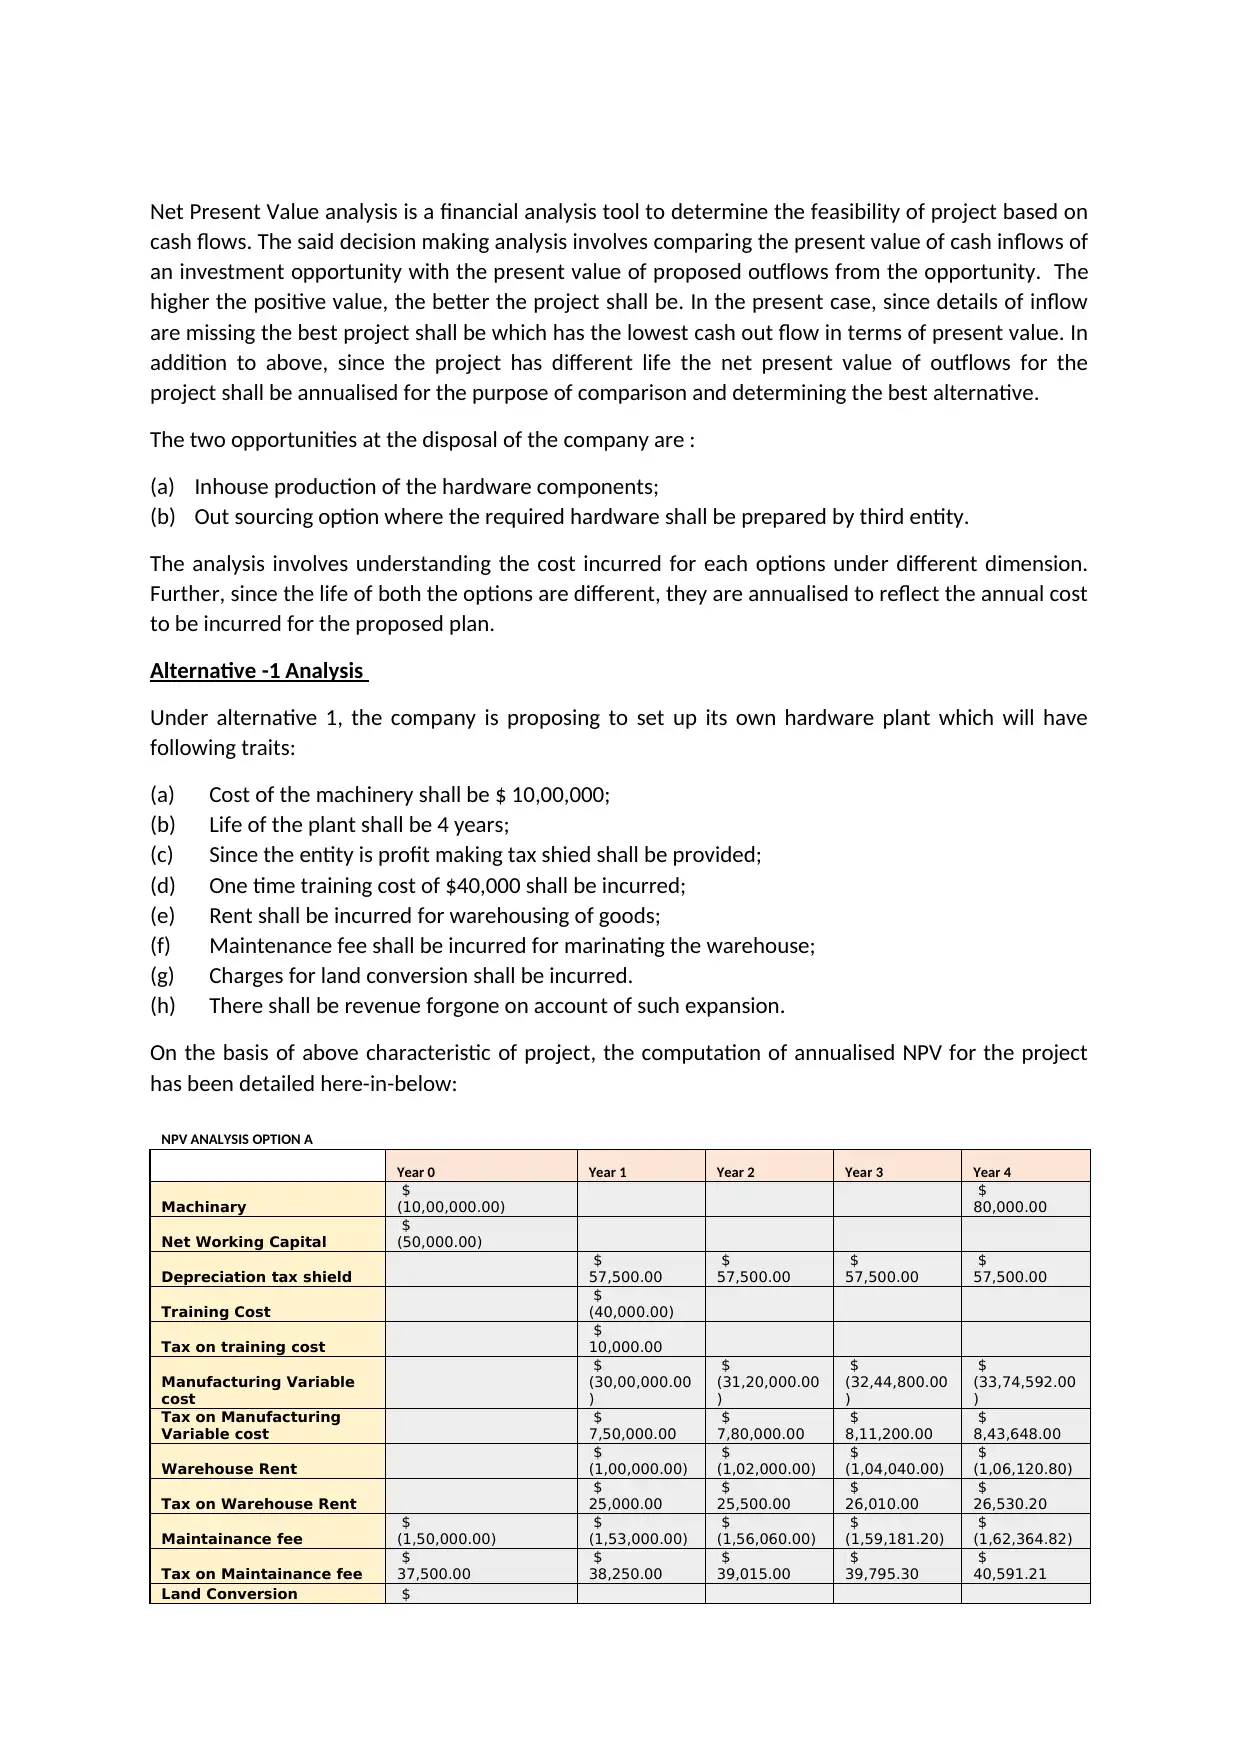
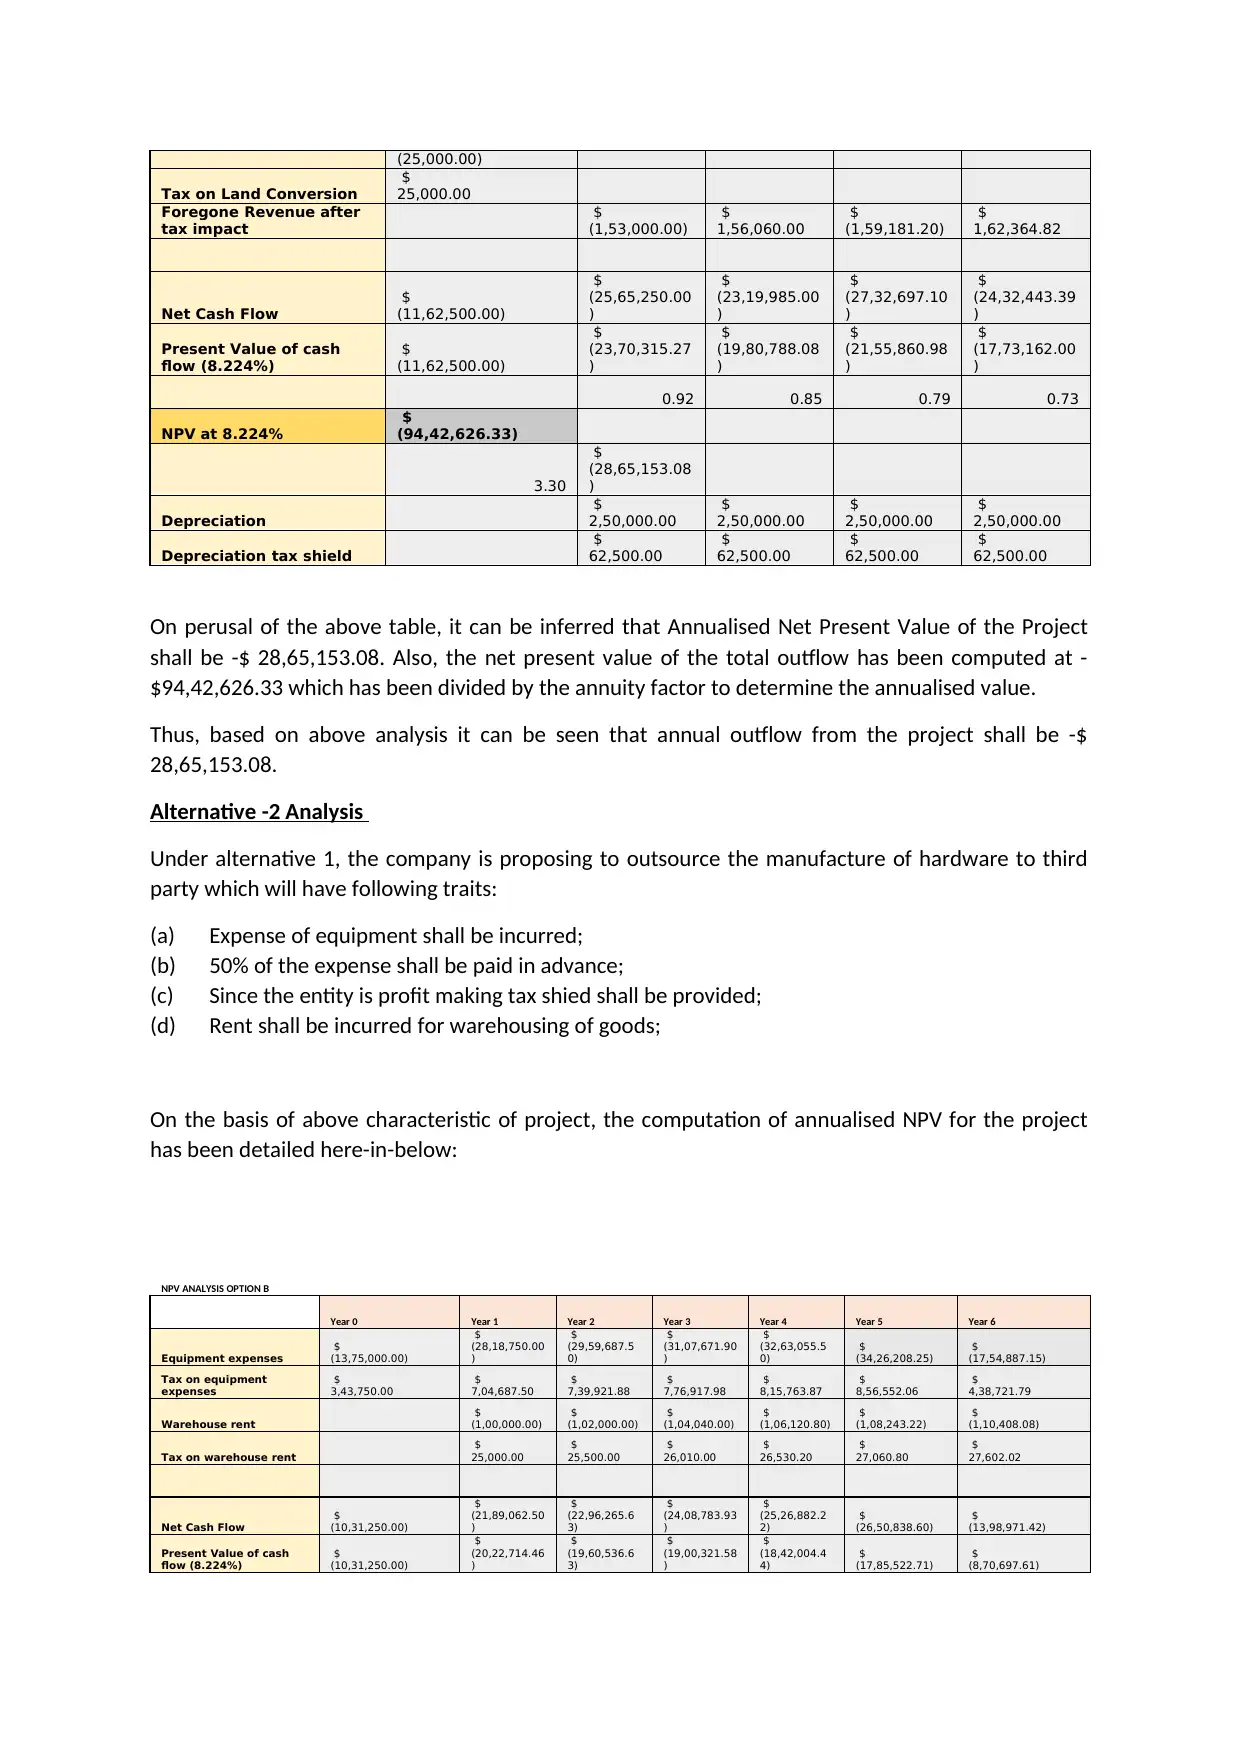
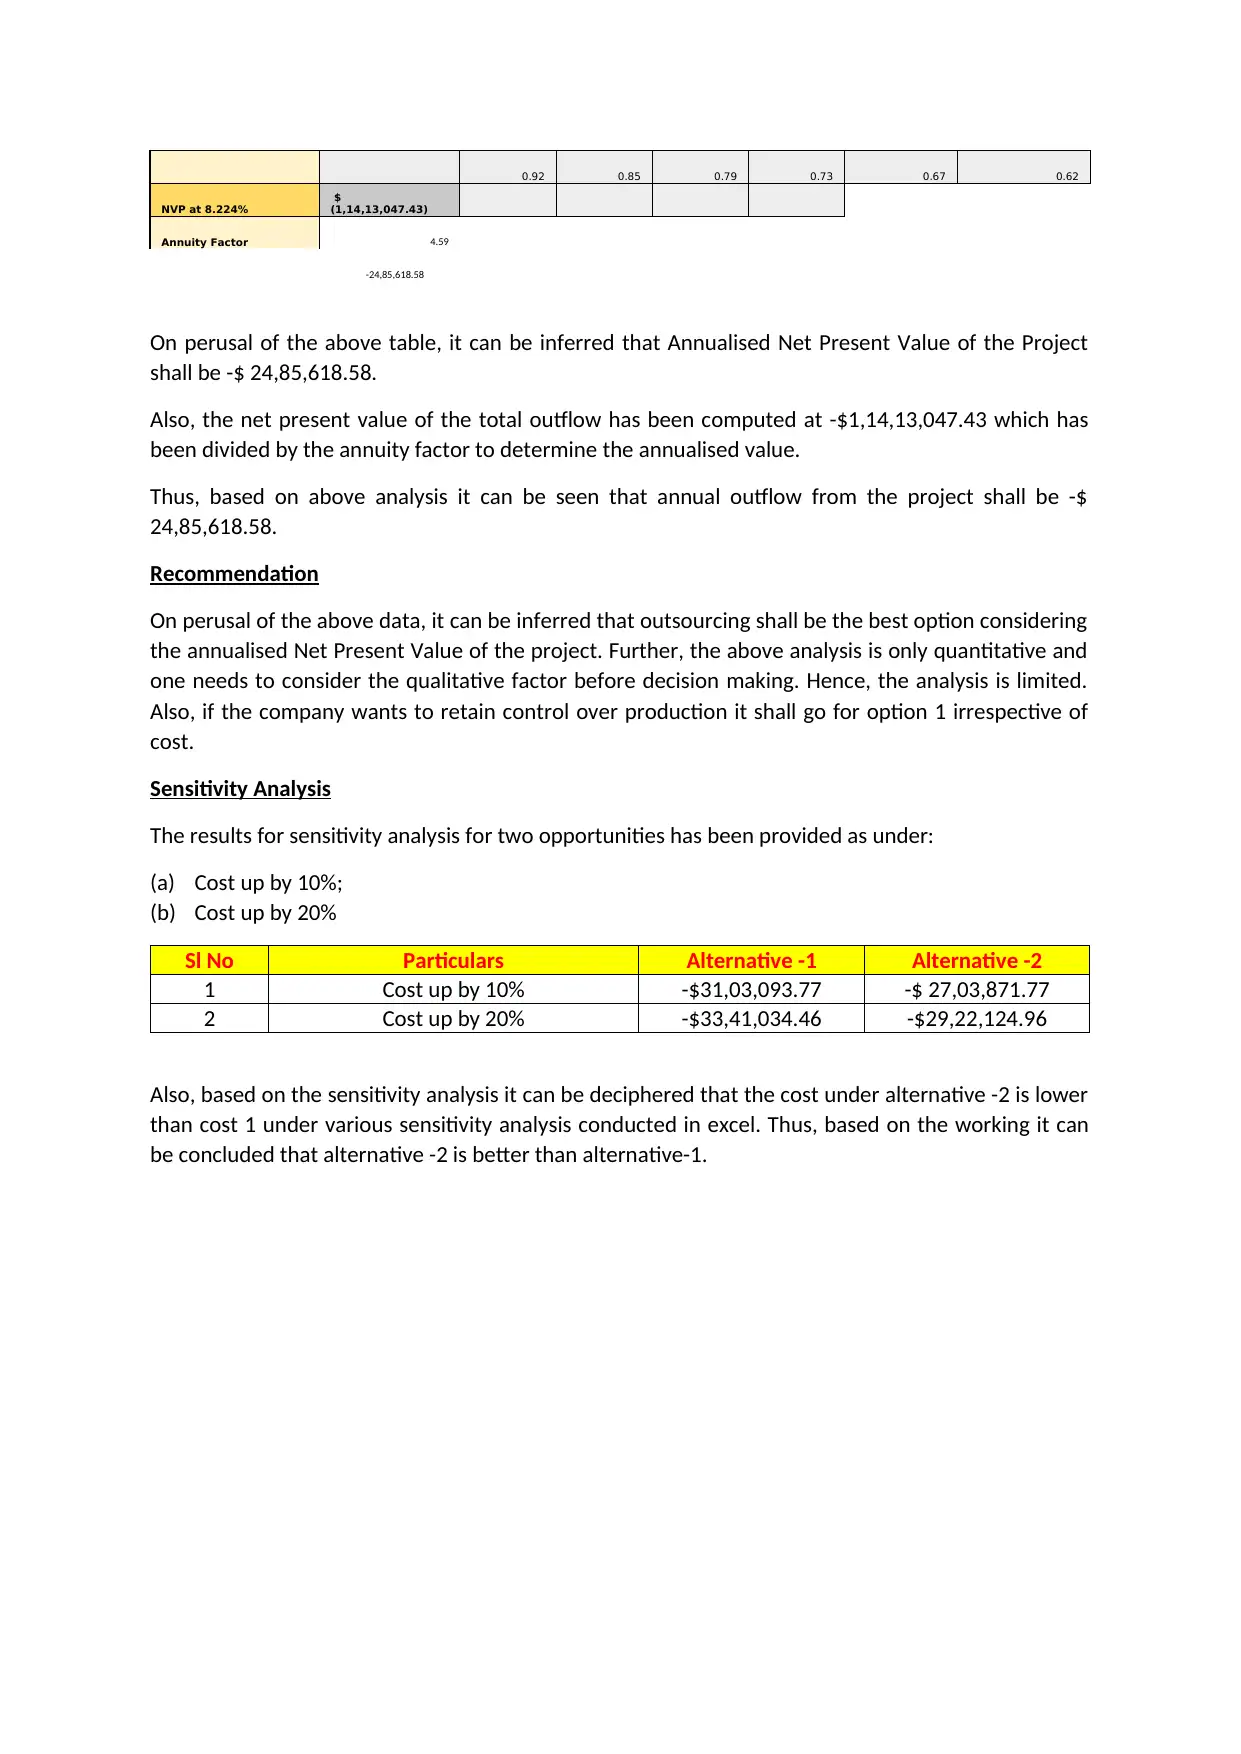
This report analyzes the financial aspects of Excellent Telecommunication Technologies Limited (ETT)'s infrastructure upgrade, comparing two options: in-house production of hardware components and outsourcing to a third party. The analysis includes the computation of ETT's Weighted Average Cost of Capital (WACC), using the values of common stock, bonds, preference shares, and mortgage. The core of the report is a Net Present Value (NPV) analysis, which evaluates the costs associated with each option over their respective lifespans, considering factors like machinery costs, training, variable costs, warehouse rent, and tax implications. Sensitivity analysis is conducted to assess the impact of cost variations on the financial outcomes. The report concludes with a recommendation based on the annualised NPV, suggesting the preferred option, and acknowledges the limitations of a purely quantitative analysis, emphasizing the importance of qualitative factors and control considerations. The analysis reveals that outsourcing appears to be the better option.
Document Page
Managerial Finance
Introduction
ETT is a company engaged in the business if telecommunications. The company provides the
following services like call, internet, mobile and other ancillaries. The company has its footprint for
25 years and is a profitable entity. Recently, company in order to further mark its presence in the
industry has explored two means of business i.e. purchasing machinery itself and bearing all the
incidental cost and secondly outsourcing the activities to any third party. The proposed analysis
deals with the cost incurred under each model and choosing the best model post conducting a
sensitivity analysis of the two opportunities.
Analysis
Computation of Weighted Average Cost of Capital
The company has four sources of finance for its present business encompassing:
(a) Common Stock i.e common shares with a required rate of return 10.87% before and after tax;
(b) Bonds i.e. debt with a required rate of return 4.66% before and 3.496% after tax;
(c) Preference Shares with a required rate of return of 5.75% before and after tax;
(d) Mortgage i.e. debt with a required rate of return 5.02% before and 3.766% after tax;
Further, the value of instruments have been considered as weight for the purpose of computing
weighted average cost of capital of the company:
(a) Common Stock: $ 10,85,00,000/-
(b) Bonds: 5,23,50,000/-
(c) Shares: 60,60,000/-;
(d) Mortgage: 55,00,00/-
Based on above values, the computation of weighted average cost of capital has been done using
the following formula:
Summation of (Value * Cost after tax)/ (Summation of Value)
The computation has been presented here-in-under:
Item Value
Weig
ht
Cost
Before Tax
Cost
After Tax
Weighted
Cost
Stock
$
10,85,00,000
0.629
3 10.87% 10.87% 0.068406415
bonds
$
5,23,50,000
0.303
6 4.66% 3.496% 0.010615037
shares
$
60,60,000
0.035
1 5.75% 5.75% 0.002021054
mortg
age
$
55,00,000
0.031
9 5.02% 3.766% 0.001201466
Total
$
17,24,10,000 8.224%
NPV Analysis of two Opportunities
tabler-icon-diamond-filled.svg

Secure Best Marks with AI Grader

Need help grading? Try our AI Grader for instant feedback on your assignments.
Document Page
Net Present Value analysis is a financial analysis tool to determine the feasibility of project based on
cash flows. The said decision making analysis involves comparing the present value of cash inflows of
an investment opportunity with the present value of proposed outflows from the opportunity. The
higher the positive value, the better the project shall be. In the present case, since details of inflow
are missing the best project shall be which has the lowest cash out flow in terms of present value. In
addition to above, since the project has different life the net present value of outflows for the
project shall be annualised for the purpose of comparison and determining the best alternative.
The two opportunities at the disposal of the company are :
(a) Inhouse production of the hardware components;
(b) Out sourcing option where the required hardware shall be prepared by third entity.
The analysis involves understanding the cost incurred for each options under different dimension.
Further, since the life of both the options are different, they are annualised to reflect the annual cost
to be incurred for the proposed plan.
Alternative -1 Analysis
Under alternative 1, the company is proposing to set up its own hardware plant which will have
following traits:
(a) Cost of the machinery shall be $ 10,00,000;
(b) Life of the plant shall be 4 years;
(c) Since the entity is profit making tax shied shall be provided;
(d) One time training cost of $40,000 shall be incurred;
(e) Rent shall be incurred for warehousing of goods;
(f) Maintenance fee shall be incurred for marinating the warehouse;
(g) Charges for land conversion shall be incurred.
(h) There shall be revenue forgone on account of such expansion.
On the basis of above characteristic of project, the computation of annualised NPV for the project
has been detailed here-in-below:
NPV ANALYSIS OPTION A
Year 0 Year 1 Year 2 Year 3 Year 4
Machinary
$
(10,00,000.00)
$
80,000.00
Net Working Capital
$
(50,000.00)
Depreciation tax shield
$
57,500.00
$
57,500.00
$
57,500.00
$
57,500.00
Training Cost
$
(40,000.00)
Tax on training cost
$
10,000.00
Manufacturing Variable
cost
$
(30,00,000.00
)
$
(31,20,000.00
)
$
(32,44,800.00
)
$
(33,74,592.00
)
Tax on Manufacturing
Variable cost
$
7,50,000.00
$
7,80,000.00
$
8,11,200.00
$
8,43,648.00
Warehouse Rent
$
(1,00,000.00)
$
(1,02,000.00)
$
(1,04,040.00)
$
(1,06,120.80)
Tax on Warehouse Rent
$
25,000.00
$
25,500.00
$
26,010.00
$
26,530.20
Maintainance fee
$
(1,50,000.00)
$
(1,53,000.00)
$
(1,56,060.00)
$
(1,59,181.20)
$
(1,62,364.82)
Tax on Maintainance fee
$
37,500.00
$
38,250.00
$
39,015.00
$
39,795.30
$
40,591.21
Land Conversion $
Document Page
(25,000.00)
Tax on Land Conversion
$
25,000.00
Foregone Revenue after
tax impact
$
(1,53,000.00)
$
1,56,060.00
$
(1,59,181.20)
$
1,62,364.82
Net Cash Flow
$
(11,62,500.00)
$
(25,65,250.00
)
$
(23,19,985.00
)
$
(27,32,697.10
)
$
(24,32,443.39
)
Present Value of cash
flow (8.224%)
$
(11,62,500.00)
$
(23,70,315.27
)
$
(19,80,788.08
)
$
(21,55,860.98
)
$
(17,73,162.00
)
0.92 0.85 0.79 0.73
NPV at 8.224%
$
(94,42,626.33)
3.30
$
(28,65,153.08
)
Depreciation
$
2,50,000.00
$
2,50,000.00
$
2,50,000.00
$
2,50,000.00
Depreciation tax shield
$
62,500.00
$
62,500.00
$
62,500.00
$
62,500.00
On perusal of the above table, it can be inferred that Annualised Net Present Value of the Project
shall be -$ 28,65,153.08. Also, the net present value of the total outflow has been computed at -
$94,42,626.33 which has been divided by the annuity factor to determine the annualised value.
Thus, based on above analysis it can be seen that annual outflow from the project shall be -$
28,65,153.08.
Alternative -2 Analysis
Under alternative 1, the company is proposing to outsource the manufacture of hardware to third
party which will have following traits:
(a) Expense of equipment shall be incurred;
(b) 50% of the expense shall be paid in advance;
(c) Since the entity is profit making tax shied shall be provided;
(d) Rent shall be incurred for warehousing of goods;
On the basis of above characteristic of project, the computation of annualised NPV for the project
has been detailed here-in-below:
NPV ANALYSIS OPTION B
Year 0 Year 1 Year 2 Year 3 Year 4 Year 5 Year 6
Equipment expenses
$
(13,75,000.00)
$
(28,18,750.00
)
$
(29,59,687.5
0)
$
(31,07,671.90
)
$
(32,63,055.5
0)
$
(34,26,208.25)
$
(17,54,887.15)
Tax on equipment
expenses
$
3,43,750.00
$
7,04,687.50
$
7,39,921.88
$
7,76,917.98
$
8,15,763.87
$
8,56,552.06
$
4,38,721.79
Warehouse rent
$
(1,00,000.00)
$
(1,02,000.00)
$
(1,04,040.00)
$
(1,06,120.80)
$
(1,08,243.22)
$
(1,10,408.08)
Tax on warehouse rent
$
25,000.00
$
25,500.00
$
26,010.00
$
26,530.20
$
27,060.80
$
27,602.02
Net Cash Flow
$
(10,31,250.00)
$
(21,89,062.50
)
$
(22,96,265.6
3)
$
(24,08,783.93
)
$
(25,26,882.2
2)
$
(26,50,838.60)
$
(13,98,971.42)
Present Value of cash
flow (8.224%)
$
(10,31,250.00)
$
(20,22,714.46
)
$
(19,60,536.6
3)
$
(19,00,321.58
)
$
(18,42,004.4
4)
$
(17,85,522.71)
$
(8,70,697.61)
Document Page
0.92 0.85 0.79 0.73 0.67 0.62
NVP at 8.224%
$
(1,14,13,047.43)
Annuity Factor 4.59
-24,85,618.58
On perusal of the above table, it can be inferred that Annualised Net Present Value of the Project
shall be -$ 24,85,618.58.
Also, the net present value of the total outflow has been computed at -$1,14,13,047.43 which has
been divided by the annuity factor to determine the annualised value.
Thus, based on above analysis it can be seen that annual outflow from the project shall be -$
24,85,618.58.
Recommendation
On perusal of the above data, it can be inferred that outsourcing shall be the best option considering
the annualised Net Present Value of the project. Further, the above analysis is only quantitative and
one needs to consider the qualitative factor before decision making. Hence, the analysis is limited.
Also, if the company wants to retain control over production it shall go for option 1 irrespective of
cost.
Sensitivity Analysis
The results for sensitivity analysis for two opportunities has been provided as under:
(a) Cost up by 10%;
(b) Cost up by 20%
Sl No Particulars Alternative -1 Alternative -2
1 Cost up by 10% -$31,03,093.77 -$ 27,03,871.77
2 Cost up by 20% -$33,41,034.46 -$29,22,124.96
Also, based on the sensitivity analysis it can be deciphered that the cost under alternative -2 is lower
than cost 1 under various sensitivity analysis conducted in excel. Thus, based on the working it can
be concluded that alternative -2 is better than alternative-1.
chevron_up_icon
1 out of 4
circle_padding
hide_on_mobile
zoom_out_icon
logo.png

Your All-in-One AI-Powered Toolkit for Academic Success.

Available 24*7 on WhatsApp / Email

[object Object]