Evaluating Murray Goulburn's Financial Standing-Financial Reports

Verified

Added on  2023/06/12

|5
|833
|418
Report
AI Summary
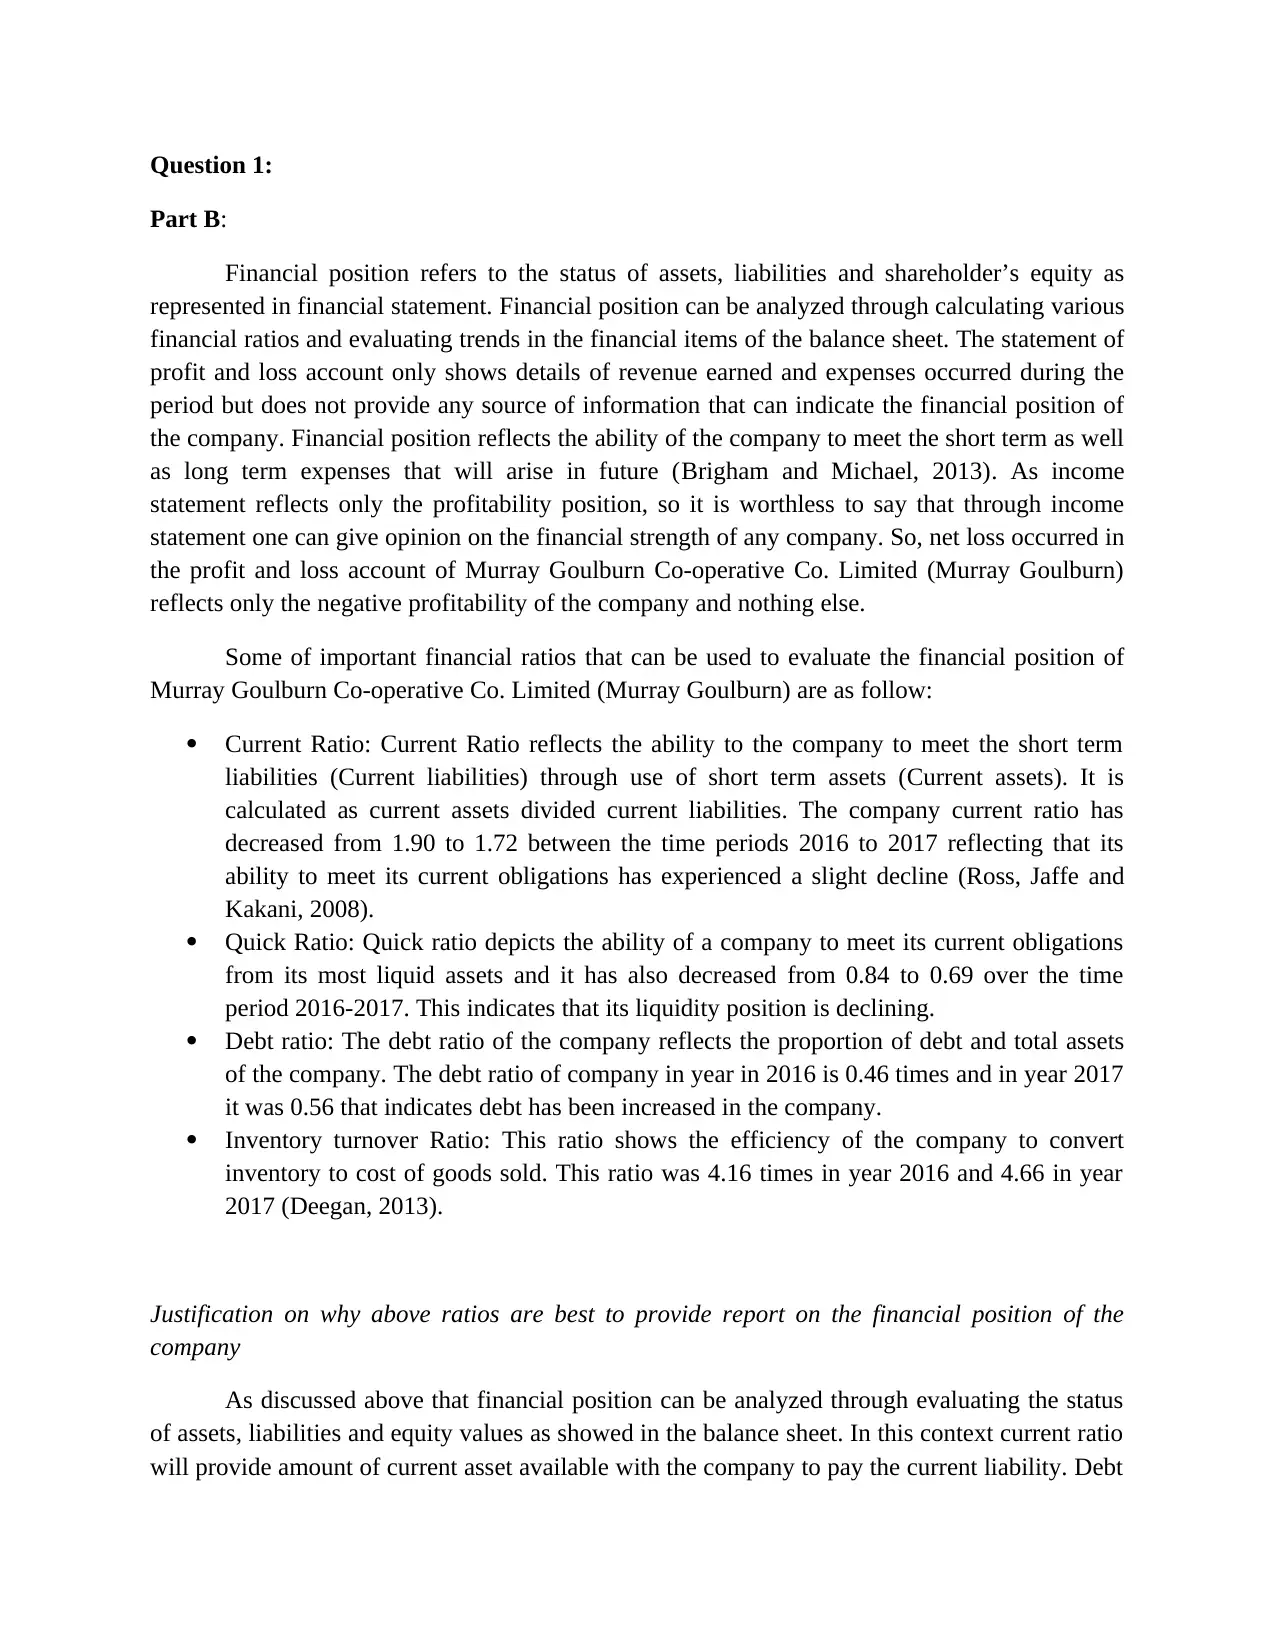
This report analyzes the financial position of Murray Goulburn Co-operative Co. Limited using financial ratios. It discusses the limitations of using only the profit and loss account to assess financial health, emphasizing the importance of balance sheet analysis. Key ratios like current ratio, quick ratio, debt ratio, and inventory turnover ratio are calculated and interpreted to evaluate the company's liquidity, debt levels, and efficiency in managing inventory. The report justifies the selection of these ratios based on their relevance in assessing assets, liabilities, and equity, providing insights into the company's ability to meet short-term obligations and overall financial stability. Desklib offers a platform to explore similar financial reports and solved assignments for students.
tabler-icon-diamond-filled.svg

Contribute Materials

Your contribution can guide someone’s learning journey. Share your documents today.
Document Page
Question 1:
Part B:
Financial position refers to the status of assets, liabilities and shareholder’s equity as
represented in financial statement. Financial position can be analyzed through calculating various
financial ratios and evaluating trends in the financial items of the balance sheet. The statement of
profit and loss account only shows details of revenue earned and expenses occurred during the
period but does not provide any source of information that can indicate the financial position of
the company. Financial position reflects the ability of the company to meet the short term as well
as long term expenses that will arise in future (Brigham and Michael, 2013). As income
statement reflects only the profitability position, so it is worthless to say that through income
statement one can give opinion on the financial strength of any company. So, net loss occurred in
the profit and loss account of Murray Goulburn Co-operative Co. Limited (Murray Goulburn)
reflects only the negative profitability of the company and nothing else.
Some of important financial ratios that can be used to evaluate the financial position of
Murray Goulburn Co-operative Co. Limited (Murray Goulburn) are as follow:
Current Ratio: Current Ratio reflects the ability to the company to meet the short term
liabilities (Current liabilities) through use of short term assets (Current assets). It is
calculated as current assets divided current liabilities. The company current ratio has
decreased from 1.90 to 1.72 between the time periods 2016 to 2017 reflecting that its
ability to meet its current obligations has experienced a slight decline (Ross, Jaffe and
Kakani, 2008).
Quick Ratio: Quick ratio depicts the ability of a company to meet its current obligations
from its most liquid assets and it has also decreased from 0.84 to 0.69 over the time
period 2016-2017. This indicates that its liquidity position is declining.
Debt ratio: The debt ratio of the company reflects the proportion of debt and total assets
of the company. The debt ratio of company in year in 2016 is 0.46 times and in year 2017
it was 0.56 that indicates debt has been increased in the company.
Inventory turnover Ratio: This ratio shows the efficiency of the company to convert
inventory to cost of goods sold. This ratio was 4.16 times in year 2016 and 4.66 in year
2017 (Deegan, 2013).
Justification on why above ratios are best to provide report on the financial position of the
company
As discussed above that financial position can be analyzed through evaluating the status
of assets, liabilities and equity values as showed in the balance sheet. In this context current ratio
will provide amount of current asset available with the company to pay the current liability. Debt
tabler-icon-diamond-filled.svg

Secure Best Marks with AI Grader

Need help grading? Try our AI Grader for instant feedback on your assignments.
Document Page
ratio provides information on percentage of debt used by the company to finance the assets of the
company. Quick ratio confirms level of current assets that can be easily converted into cash and
cash equivalents to pay the current liabilities on time. Lastly inventory turnover ratio guides how
frequently company converts its inventory into cost of goods sold so that maximum revenue can
be earned. All these ratio provides information on liquidity and efficiency of company that is
important to evaluate in order to report in the financial position of the company (Arnold, 2013).
Document Page
References
Arnold, G., 2013. Corporate financial management. Pearson Higher Ed.
Brigham, F., and Michael C. 2013. Financial management: Theory & practice. Cengage
Learning.
Deegan, C., 2013. Financial accounting theory. McGraw-Hill Education Australia.
Ross, A., Jaffe, J. and Kakani, R.K. 2008. Corporate Finance. Pearson.
Document Page
Appendix
Current Ratio: The formula for calculation of current ratio is as follows:
Current Ratio=Current Assets/Current Liabilities
Current ratio of the company for the year 2016 & 2017 is calculated as follows:
For Year 2016:
Current Ratio=1011751/531516=1.90
For year 2017:
Current Ratio=782840/456305
Current Ratio=1.72
Quick Ratio: The formula for calculation of quick ratio is as follows:
Quick Ratio=Quick Assets/Current Liabilities
For Year 2016:
Quick Ratio=443091/531516
Quick Ratio=0.84
For year 2017:
Quick Ratio=318308/456305
Quick Ratio=0.69
Debt ratio: The formula for calculation of DEBT ratio is as follows:
Debt Ratio=Total Liabilities/Total Assets
For Year 2016:
Debt Ratio= 1,002,139/ 2,177,833
Debt Ratio=0.46
For Year 2017:
Debt Ratio= 940,218/ 1,675,609
Debt Ratio=0.56
tabler-icon-diamond-filled.svg

Secure Best Marks with AI Grader

Need help grading? Try our AI Grader for instant feedback on your assignments.
Document Page
Inventory turnover Ratio: The formula for calculation of inventory turnover ratio is as follows:
Inventory turnover Ratio=Cost of Goods Sold/Average Inventory
For Year 2016:
Inventory turnover Ratio= 2,366,640/ 568,660
Inventory turnover Ratio=4.16
For Year 2017:
Inventory turnover Ratio= 2,169,224/ 464,532
Inventory turnover Ratio=4.66
chevron_up_icon
1 out of 5
circle_padding
hide_on_mobile
zoom_out_icon
logo.png

Your All-in-One AI-Powered Toolkit for Academic Success.

Available 24*7 on WhatsApp / Email

[object Object]