Report: Evaluating the Economic Relationship Between USA and Australia
VerifiedAdded on 2020/04/07
|15
|3565
|31
Report
AI Summary
This report offers a detailed analysis of the economic relationship between the USA and Australia, evaluating the impact of the USA's economy on Australia. The study examines real GDP growth trends, trade balances, exchange rate movements, and foreign investment dynamics between the two countries from 1975 to 2016. The report explores the influence of the USA's economic fluctuations on Australia, particularly considering the Great Recession. The analysis includes data on export, import, and net export trends, as well as the flow of foreign investment. The findings suggest an ambiguous relationship, with no clear correlation found between the volatility of the Australian dollar and corresponding interest rate fluctuations, indicating that the impact of the USA economy on Australia is not always straightforward. The report concludes with an assessment of the overall economic interdependence and its implications for both nations.
Running head: ECONOMIC ASSIGNMENT
Economic Assignment
Name of the Student
Name of the University
Author note
Economic Assignment
Name of the Student
Name of the University
Author note
Paraphrase This Document
Need a fresh take? Get an instant paraphrase of this document with our AI Paraphraser
1ECONOMIC ASSIGNMENT
Executive Summary
The report attempts to make a critical evaluation of the relative impact of USA economy on the
economy of Australia. Both USA and Australia are listed in among the developed nations of the
world. They are good trade and investment partners as well. For this, policymakers often are of
belief that fluctuation in real GDP of USA affects economic scenario of Australia. To validate
the statement movement of real GDP for a considerable long period (1975-2016) is analyzed.
Related to GDP, FDI flows and net export t6rend is also reviewed. No common fluctuation point
is found between volatility of Australian dollar with respect to US dollar and the corresponding
fluctuation in interest rates. There is not much significant impact of Great recession of USA on
Australian economy indicating an ambiguous relationship between the two nations.
2ECONOMIC ASSIGNMENT
Table of Contents
Introduction......................................................................................................................................3
Australia and USA; nature and extent of international relation......................................................3
Critical Evaluation...........................................................................................................................4
Real GDP of USA and Australia.................................................................................................5
Net export and Trade balance......................................................................................................6
Exchange rate movement.............................................................................................................8
Evaluation of Investment Dynamics............................................................................................8
Conclusion.....................................................................................................................................12
References......................................................................................................................................13
⊘ This is a preview!⊘
Do you want full access?
Subscribe today to unlock all pages.
Trusted by 1+ million students worldwide
3ECONOMIC ASSIGNMENT
Introduction
In today’s integrated world, international relationship becomes an important aspect for
any economy. International relationship is defined not only in terms of trade relation but also it
includes any unilateral transfer payment or assistance, investment made in foreign country or any
capital payment between nations. Global integration initially starts with bilateral or multilateral
trade relation. Country’s export goods those are advantageous for them to produce and import
goods for which it faces a higher relative cost of production. The net earnings from trade are one
of the vital components of gross domestic product of nations. The interconnection among nations
implies any shocks in one nation have a likely impact on the other nation as well.
The paper examines the extent of international relationship between USA and Australia.
Both the countries shared a good international relationship in their bilateral trade and foreign
investment as well. Viewing this, some commentators draw assertion that fluctuation in real
GDP in USA can be claimed responsible for economic expansion or contraction in Australia.
The main rational for this assertion is that USA has a considerable large size of economy as
compared to Australia. The paper examines whether this assertion is correct or not.
Australia and USA; nature and extent of international relation
Cross-border transaction of goods and services explains the extent of global trade. When
different nations interact on international platform then some nations gain more because of their
dominating economic power while weak nations accept the terms of trade determined by the
large nation. Whatever be the case, trades are generally mutually beneficial. Australia and USA
signed Free Trade Agreement that comes into effect from 2005. Australia provides a large
market for USA exported goods. In 2015, the goods and services traded from USA to Australia
is was totaled to approximately $65 billion with a trade surplus for USA amounted to $29
billion(Beeson and Zeng 2016.). Depending on exported goods to Australia 250,000 jobs are
supported in USA. The major sectors in USA those are flourishing with USA export relation are
industrial goods, financial service and different consumer goods. Australia exports industrial
material and supplies, foods and beverages items and travel and business services.
Apart from trade, there are bilateral investment relation between USA and Australia.
Invested fund amounts to more than $ 1 trillion. Among the investment that Australia made
abroad, the highest amount recorded in USA. Australian investment in USA is amounted to $440
billion, 30 percent of total investment made abroad. USA invests $650 billion in different
Australia ventures. Most lucrative sectors for USA investment are insurance, finance and mining.
In Australian stock market more than 30 percent share belong to USA (Jennings 2013).
Therefore, a good relation between Australia and USA exits in terms of their visible and invisible
trade and investment.
Other than trade and investment, other economic benefits are shared between the two
nations. Australia ranked 12 in the list of developed nations. It maintains a steady economic
growth for a long period. In terms of per capita income, Australia is sixth. Because of a favorable
business environment, US firms continued their business operation in Australia for more than
Paraphrase This Document
Need a fresh take? Get an instant paraphrase of this document with our AI Paraphraser
4ECONOMIC ASSIGNMENT
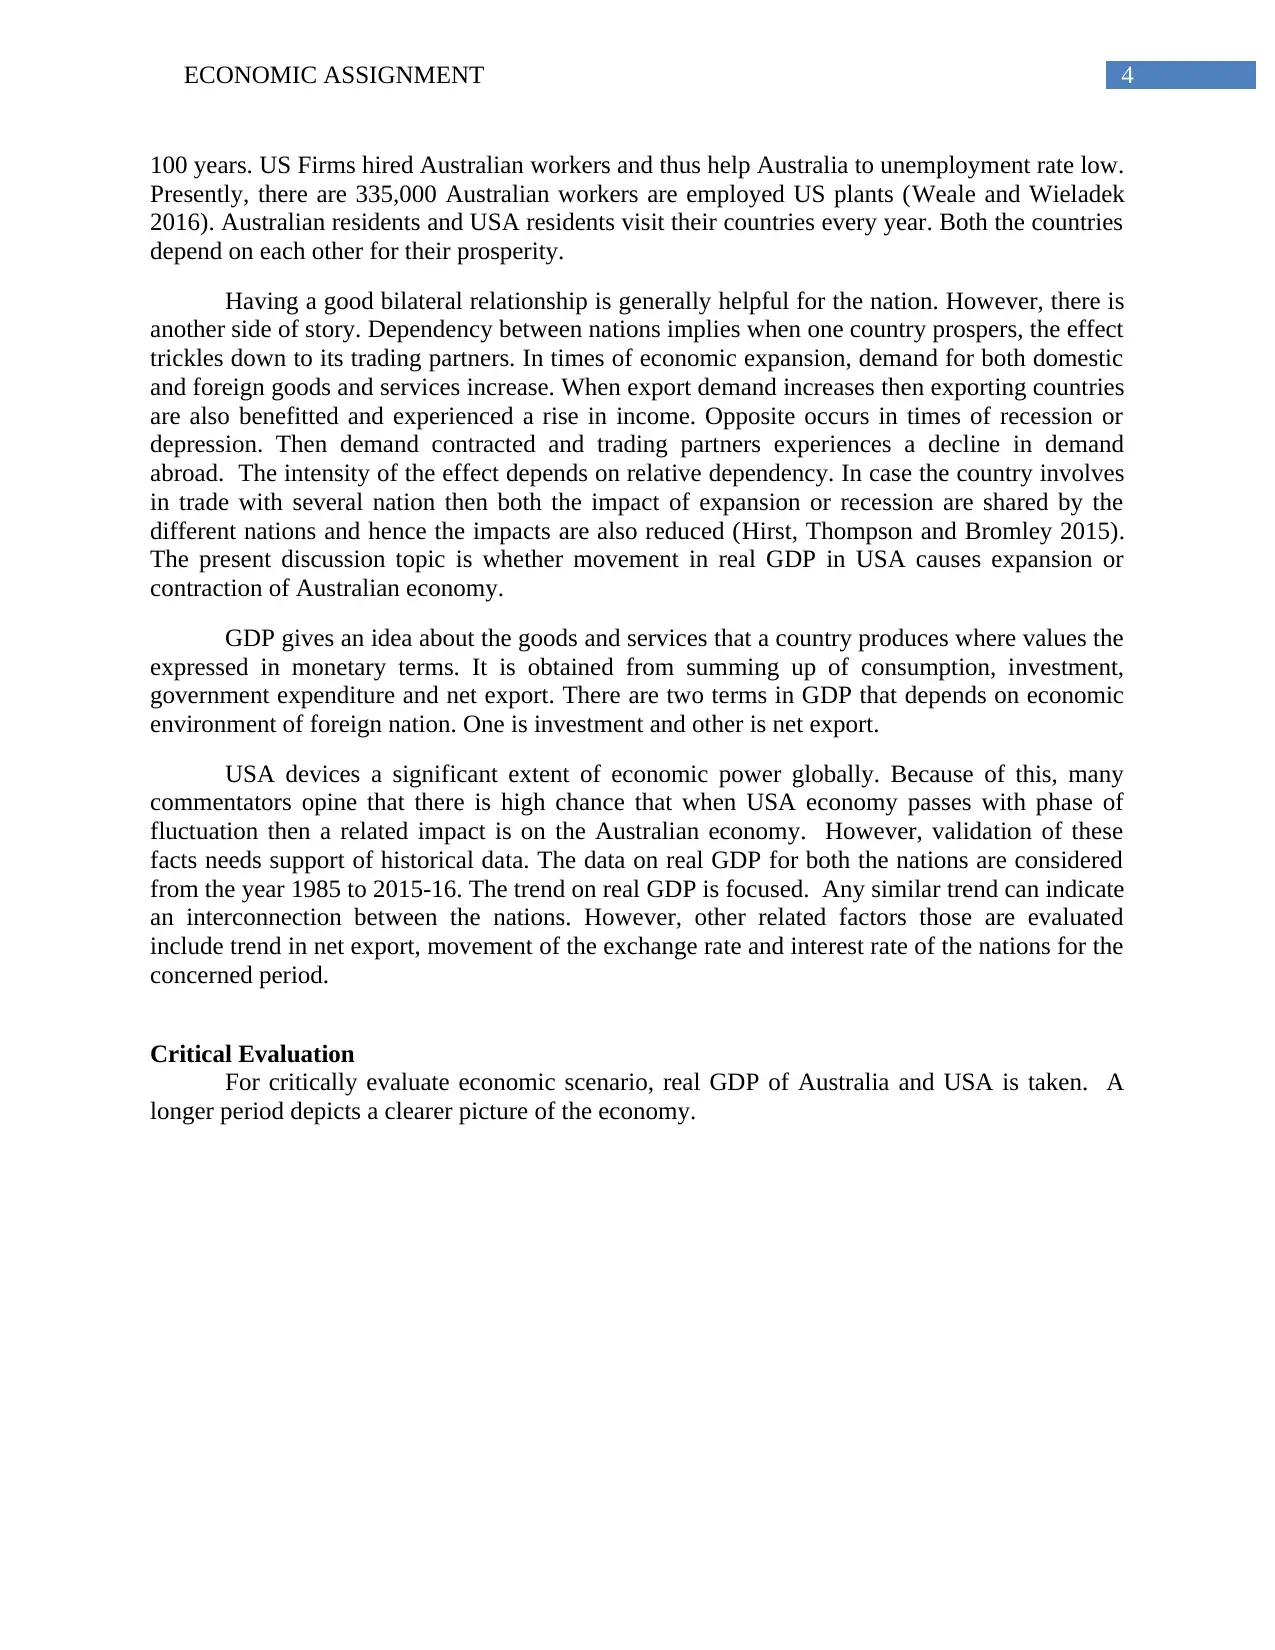
100 years. US Firms hired Australian workers and thus help Australia to unemployment rate low.
Presently, there are 335,000 Australian workers are employed US plants (Weale and Wieladek
2016). Australian residents and USA residents visit their countries every year. Both the countries
depend on each other for their prosperity.
Having a good bilateral relationship is generally helpful for the nation. However, there is
another side of story. Dependency between nations implies when one country prospers, the effect
trickles down to its trading partners. In times of economic expansion, demand for both domestic
and foreign goods and services increase. When export demand increases then exporting countries
are also benefitted and experienced a rise in income. Opposite occurs in times of recession or
depression. Then demand contracted and trading partners experiences a decline in demand
abroad. The intensity of the effect depends on relative dependency. In case the country involves
in trade with several nation then both the impact of expansion or recession are shared by the
different nations and hence the impacts are also reduced (Hirst, Thompson and Bromley 2015).
The present discussion topic is whether movement in real GDP in USA causes expansion or
contraction of Australian economy.
GDP gives an idea about the goods and services that a country produces where values the
expressed in monetary terms. It is obtained from summing up of consumption, investment,
government expenditure and net export. There are two terms in GDP that depends on economic
environment of foreign nation. One is investment and other is net export.
USA devices a significant extent of economic power globally. Because of this, many
commentators opine that there is high chance that when USA economy passes with phase of
fluctuation then a related impact is on the Australian economy. However, validation of these
facts needs support of historical data. The data on real GDP for both the nations are considered
from the year 1985 to 2015-16. The trend on real GDP is focused. Any similar trend can indicate
an interconnection between the nations. However, other related factors those are evaluated
include trend in net export, movement of the exchange rate and interest rate of the nations for the
concerned period.
Critical Evaluation
For critically evaluate economic scenario, real GDP of Australia and USA is taken. A
longer period depicts a clearer picture of the economy.
5ECONOMIC ASSIGNMENT
Real GDP of USA and Australia
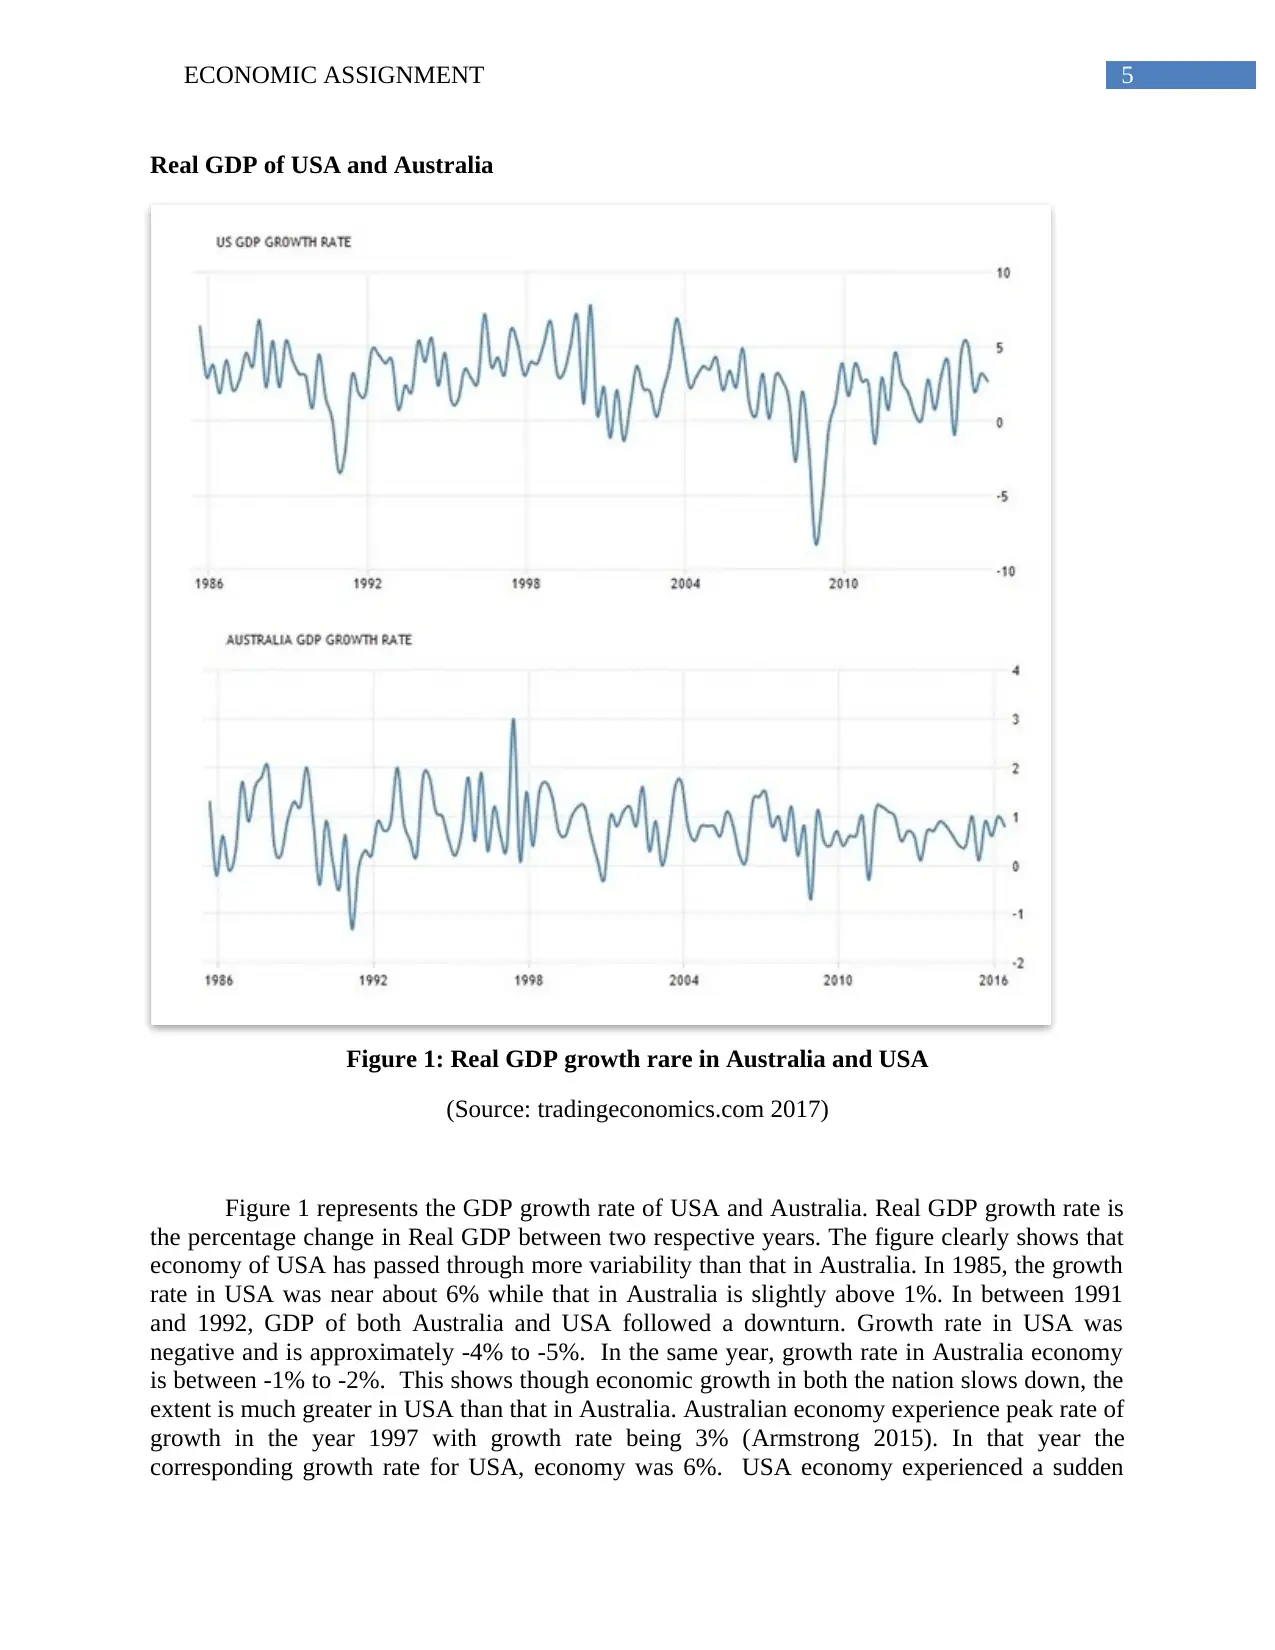
Figure 1: Real GDP growth rare in Australia and USA
(Source: tradingeconomics.com 2017)
Figure 1 represents the GDP growth rate of USA and Australia. Real GDP growth rate is
the percentage change in Real GDP between two respective years. The figure clearly shows that
economy of USA has passed through more variability than that in Australia. In 1985, the growth
rate in USA was near about 6% while that in Australia is slightly above 1%. In between 1991
and 1992, GDP of both Australia and USA followed a downturn. Growth rate in USA was
negative and is approximately -4% to -5%. In the same year, growth rate in Australia economy
is between -1% to -2%. This shows though economic growth in both the nation slows down, the
extent is much greater in USA than that in Australia. Australian economy experience peak rate of
growth in the year 1997 with growth rate being 3% (Armstrong 2015). In that year the
corresponding growth rate for USA, economy was 6%. USA economy experienced a sudden
Real GDP of USA and Australia
Figure 1: Real GDP growth rare in Australia and USA
(Source: tradingeconomics.com 2017)
Figure 1 represents the GDP growth rate of USA and Australia. Real GDP growth rate is
the percentage change in Real GDP between two respective years. The figure clearly shows that
economy of USA has passed through more variability than that in Australia. In 1985, the growth
rate in USA was near about 6% while that in Australia is slightly above 1%. In between 1991
and 1992, GDP of both Australia and USA followed a downturn. Growth rate in USA was
negative and is approximately -4% to -5%. In the same year, growth rate in Australia economy
is between -1% to -2%. This shows though economic growth in both the nation slows down, the
extent is much greater in USA than that in Australia. Australian economy experience peak rate of
growth in the year 1997 with growth rate being 3% (Armstrong 2015). In that year the
corresponding growth rate for USA, economy was 6%. USA economy experienced a sudden
⊘ This is a preview!⊘
Do you want full access?
Subscribe today to unlock all pages.
Trusted by 1+ million students worldwide
6ECONOMIC ASSIGNMENT
downfall in the growth rate in 2008-2009. This is obvious as that year USA has faced the great
recession .This time, growth rate is even much lower than previous decline. The growth rate
sharply declined to 8%-9%. The growth rate in Australia in that year slightly slows down with
growth rate lie somewhere between 0 to -1%. After 2010, the growth rate trend remains more or
less same for both the nations.
The analysis of real GDP shows that there are some similarity of fluctuation of real GDP
growth trend between USA and Australia. In times of economic prosperity, growth rate in USA
is much higher as compared to Australia. Similarly, the extent of downturn in real GDP in USA
is also greater than Australia (Thorpe and Leitão 2014). This explains the relatively large size of
USA economy. The common points of fluctuation between two nations are not enough for
drawing any conclusion. The additional aspects are evaluated for a more detailed analysis.
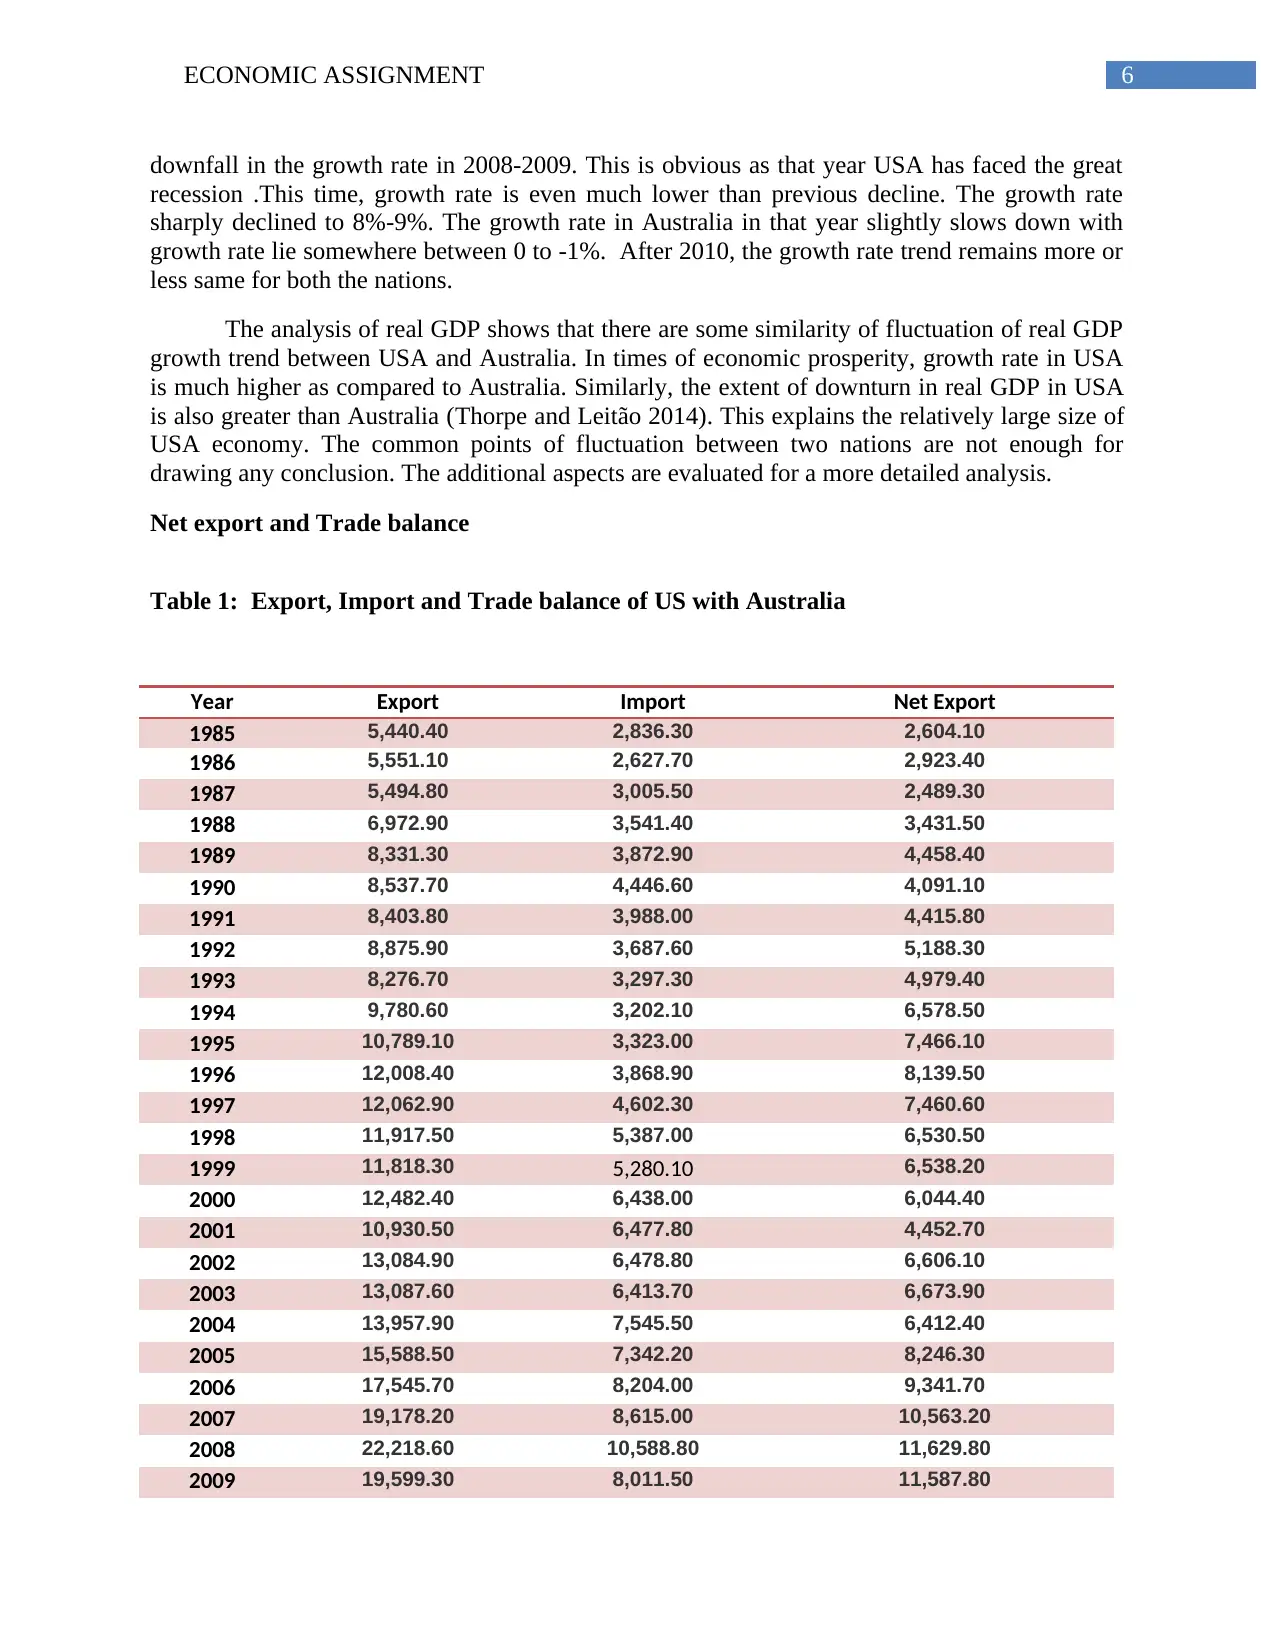
Net export and Trade balance
Table 1: Export, Import and Trade balance of US with Australia
Year Export Import Net Export
1985 5,440.40 2,836.30 2,604.10
1986 5,551.10 2,627.70 2,923.40
1987 5,494.80 3,005.50 2,489.30
1988 6,972.90 3,541.40 3,431.50
1989 8,331.30 3,872.90 4,458.40
1990 8,537.70 4,446.60 4,091.10
1991 8,403.80 3,988.00 4,415.80
1992 8,875.90 3,687.60 5,188.30
1993 8,276.70 3,297.30 4,979.40
1994 9,780.60 3,202.10 6,578.50
1995 10,789.10 3,323.00 7,466.10
1996 12,008.40 3,868.90 8,139.50
1997 12,062.90 4,602.30 7,460.60
1998 11,917.50 5,387.00 6,530.50
1999 11,818.30 5,280.10 6,538.20
2000 12,482.40 6,438.00 6,044.40
2001 10,930.50 6,477.80 4,452.70
2002 13,084.90 6,478.80 6,606.10
2003 13,087.60 6,413.70 6,673.90
2004 13,957.90 7,545.50 6,412.40
2005 15,588.50 7,342.20 8,246.30
2006 17,545.70 8,204.00 9,341.70
2007 19,178.20 8,615.00 10,563.20
2008 22,218.60 10,588.80 11,629.80
2009 19,599.30 8,011.50 11,587.80
downfall in the growth rate in 2008-2009. This is obvious as that year USA has faced the great
recession .This time, growth rate is even much lower than previous decline. The growth rate
sharply declined to 8%-9%. The growth rate in Australia in that year slightly slows down with
growth rate lie somewhere between 0 to -1%. After 2010, the growth rate trend remains more or
less same for both the nations.
The analysis of real GDP shows that there are some similarity of fluctuation of real GDP
growth trend between USA and Australia. In times of economic prosperity, growth rate in USA
is much higher as compared to Australia. Similarly, the extent of downturn in real GDP in USA
is also greater than Australia (Thorpe and Leitão 2014). This explains the relatively large size of
USA economy. The common points of fluctuation between two nations are not enough for
drawing any conclusion. The additional aspects are evaluated for a more detailed analysis.
Net export and Trade balance
Table 1: Export, Import and Trade balance of US with Australia
Year Export Import Net Export
1985 5,440.40 2,836.30 2,604.10
1986 5,551.10 2,627.70 2,923.40
1987 5,494.80 3,005.50 2,489.30
1988 6,972.90 3,541.40 3,431.50
1989 8,331.30 3,872.90 4,458.40
1990 8,537.70 4,446.60 4,091.10
1991 8,403.80 3,988.00 4,415.80
1992 8,875.90 3,687.60 5,188.30
1993 8,276.70 3,297.30 4,979.40
1994 9,780.60 3,202.10 6,578.50
1995 10,789.10 3,323.00 7,466.10
1996 12,008.40 3,868.90 8,139.50
1997 12,062.90 4,602.30 7,460.60
1998 11,917.50 5,387.00 6,530.50
1999 11,818.30 5,280.10 6,538.20
2000 12,482.40 6,438.00 6,044.40
2001 10,930.50 6,477.80 4,452.70
2002 13,084.90 6,478.80 6,606.10
2003 13,087.60 6,413.70 6,673.90
2004 13,957.90 7,545.50 6,412.40
2005 15,588.50 7,342.20 8,246.30
2006 17,545.70 8,204.00 9,341.70
2007 19,178.20 8,615.00 10,563.20
2008 22,218.60 10,588.80 11,629.80
2009 19,599.30 8,011.50 11,587.80
Paraphrase This Document
Need a fresh take? Get an instant paraphrase of this document with our AI Paraphraser
7ECONOMIC ASSIGNMENT
2010 21,804.60 8,582.90 13,221.70
2011 27,626.20 10,242.90 17,383.30
2012 31,161.40 9,566.80 21,594.60
2013 26,123.70 9,272.60 16,851.10
2014 26,681.70 10,697.30 15,984.40
2015 25,034.10 10,883.50 14,150.60
2016 22,159.70 9,509.90 12,649.80
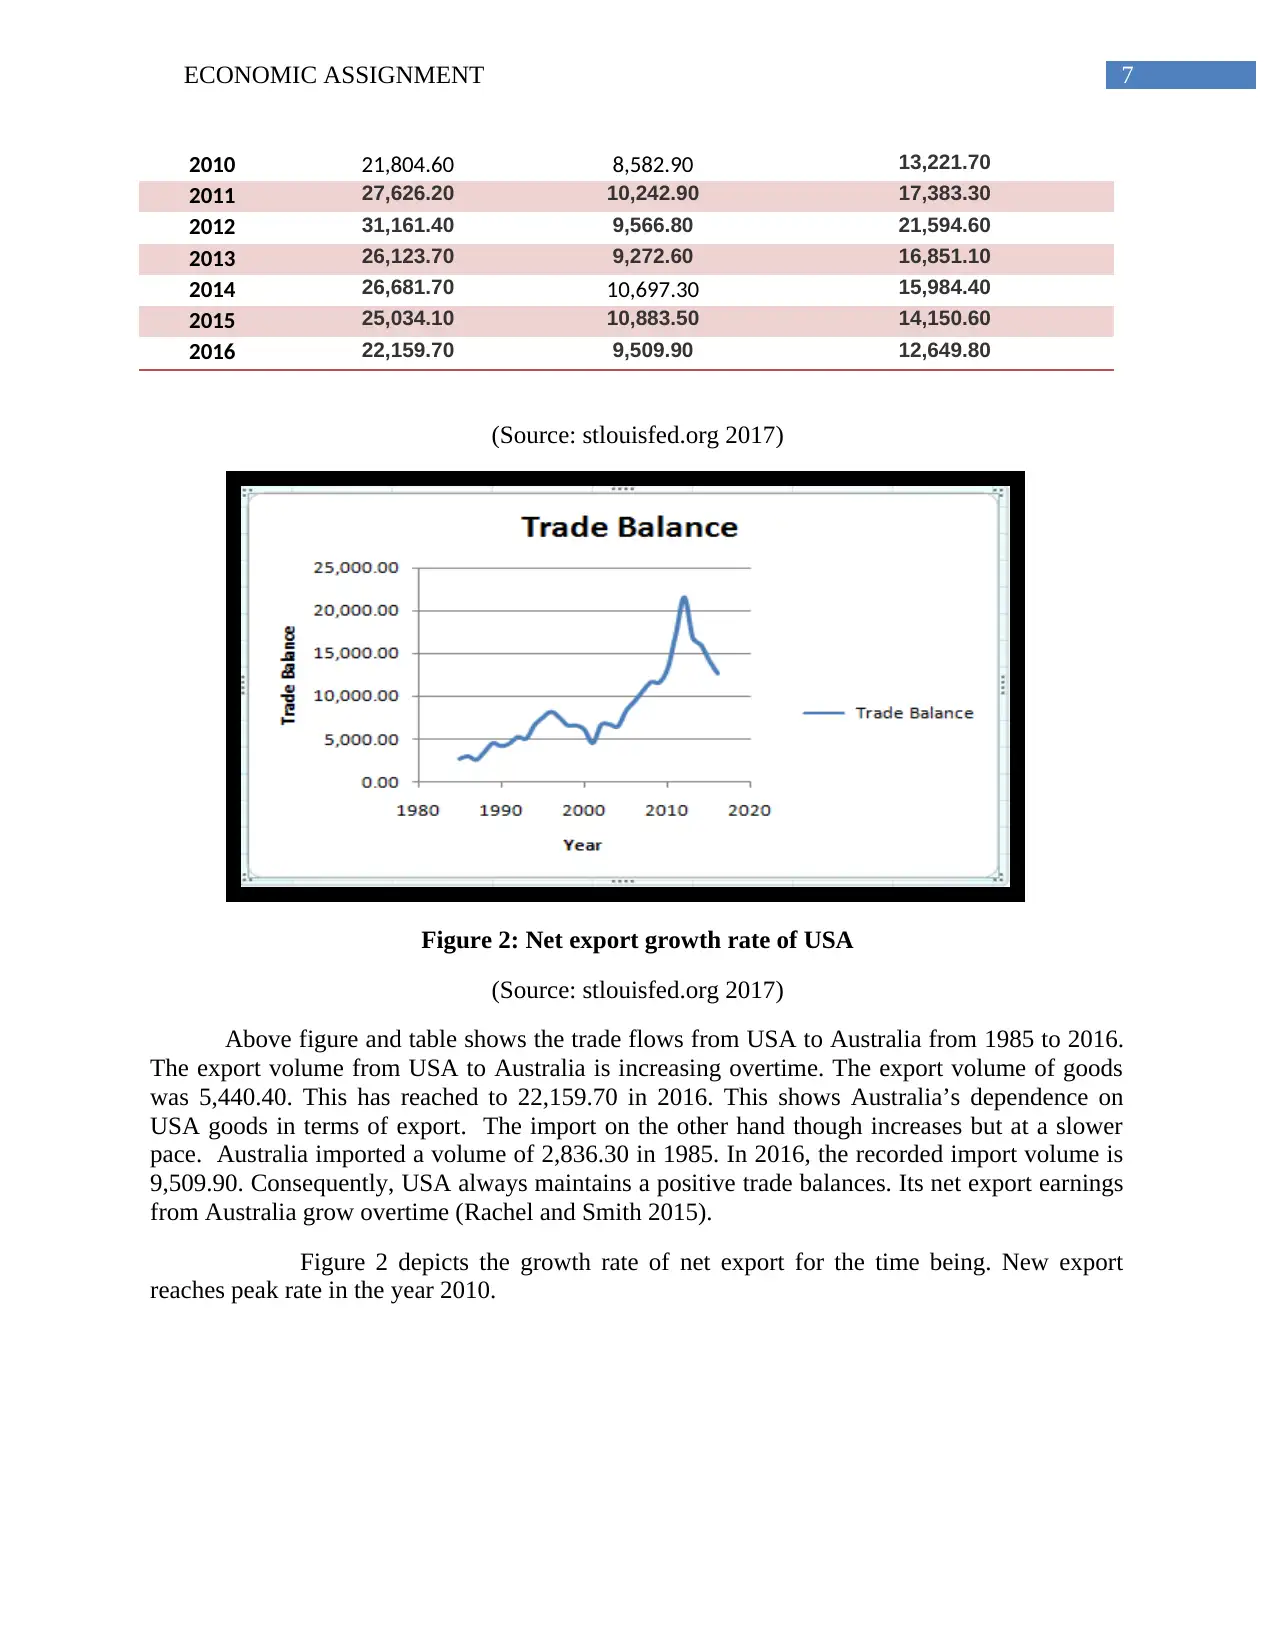
(Source: stlouisfed.org 2017)
Figure 2: Net export growth rate of USA
(Source: stlouisfed.org 2017)
Above figure and table shows the trade flows from USA to Australia from 1985 to 2016.
The export volume from USA to Australia is increasing overtime. The export volume of goods
was 5,440.40. This has reached to 22,159.70 in 2016. This shows Australia’s dependence on
USA goods in terms of export. The import on the other hand though increases but at a slower
pace. Australia imported a volume of 2,836.30 in 1985. In 2016, the recorded import volume is
9,509.90. Consequently, USA always maintains a positive trade balances. Its net export earnings
from Australia grow overtime (Rachel and Smith 2015).
Figure 2 depicts the growth rate of net export for the time being. New export
reaches peak rate in the year 2010.
2010 21,804.60 8,582.90 13,221.70
2011 27,626.20 10,242.90 17,383.30
2012 31,161.40 9,566.80 21,594.60
2013 26,123.70 9,272.60 16,851.10
2014 26,681.70 10,697.30 15,984.40
2015 25,034.10 10,883.50 14,150.60
2016 22,159.70 9,509.90 12,649.80
(Source: stlouisfed.org 2017)
Figure 2: Net export growth rate of USA
(Source: stlouisfed.org 2017)
Above figure and table shows the trade flows from USA to Australia from 1985 to 2016.
The export volume from USA to Australia is increasing overtime. The export volume of goods
was 5,440.40. This has reached to 22,159.70 in 2016. This shows Australia’s dependence on
USA goods in terms of export. The import on the other hand though increases but at a slower
pace. Australia imported a volume of 2,836.30 in 1985. In 2016, the recorded import volume is
9,509.90. Consequently, USA always maintains a positive trade balances. Its net export earnings
from Australia grow overtime (Rachel and Smith 2015).
Figure 2 depicts the growth rate of net export for the time being. New export
reaches peak rate in the year 2010.
8ECONOMIC ASSIGNMENT
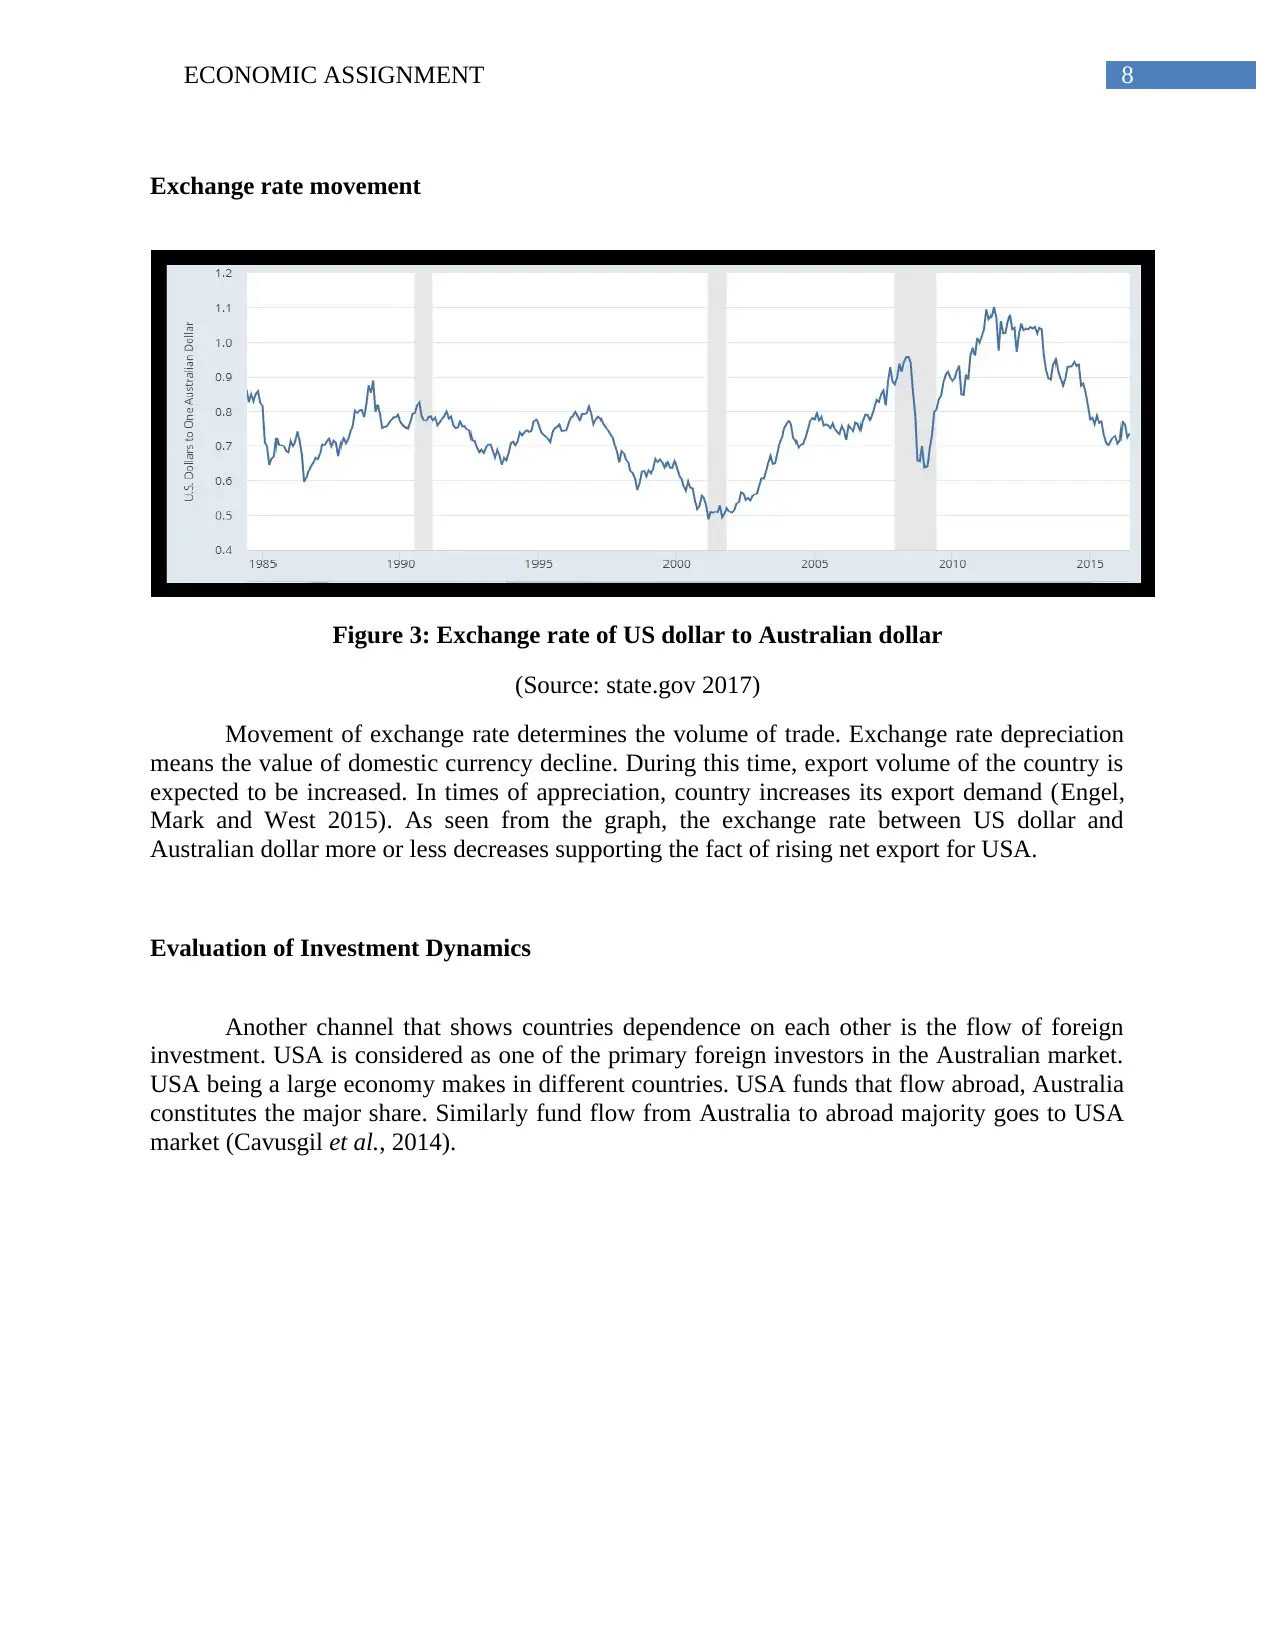
Exchange rate movement
Figure 3: Exchange rate of US dollar to Australian dollar
(Source: state.gov 2017)
Movement of exchange rate determines the volume of trade. Exchange rate depreciation
means the value of domestic currency decline. During this time, export volume of the country is
expected to be increased. In times of appreciation, country increases its export demand (Engel,
Mark and West 2015). As seen from the graph, the exchange rate between US dollar and
Australian dollar more or less decreases supporting the fact of rising net export for USA.
Evaluation of Investment Dynamics
Another channel that shows countries dependence on each other is the flow of foreign
investment. USA is considered as one of the primary foreign investors in the Australian market.
USA being a large economy makes in different countries. USA funds that flow abroad, Australia
constitutes the major share. Similarly fund flow from Australia to abroad majority goes to USA
market (Cavusgil et al., 2014).
⊘ This is a preview!⊘
Do you want full access?
Subscribe today to unlock all pages.
Trusted by 1+ million students worldwide
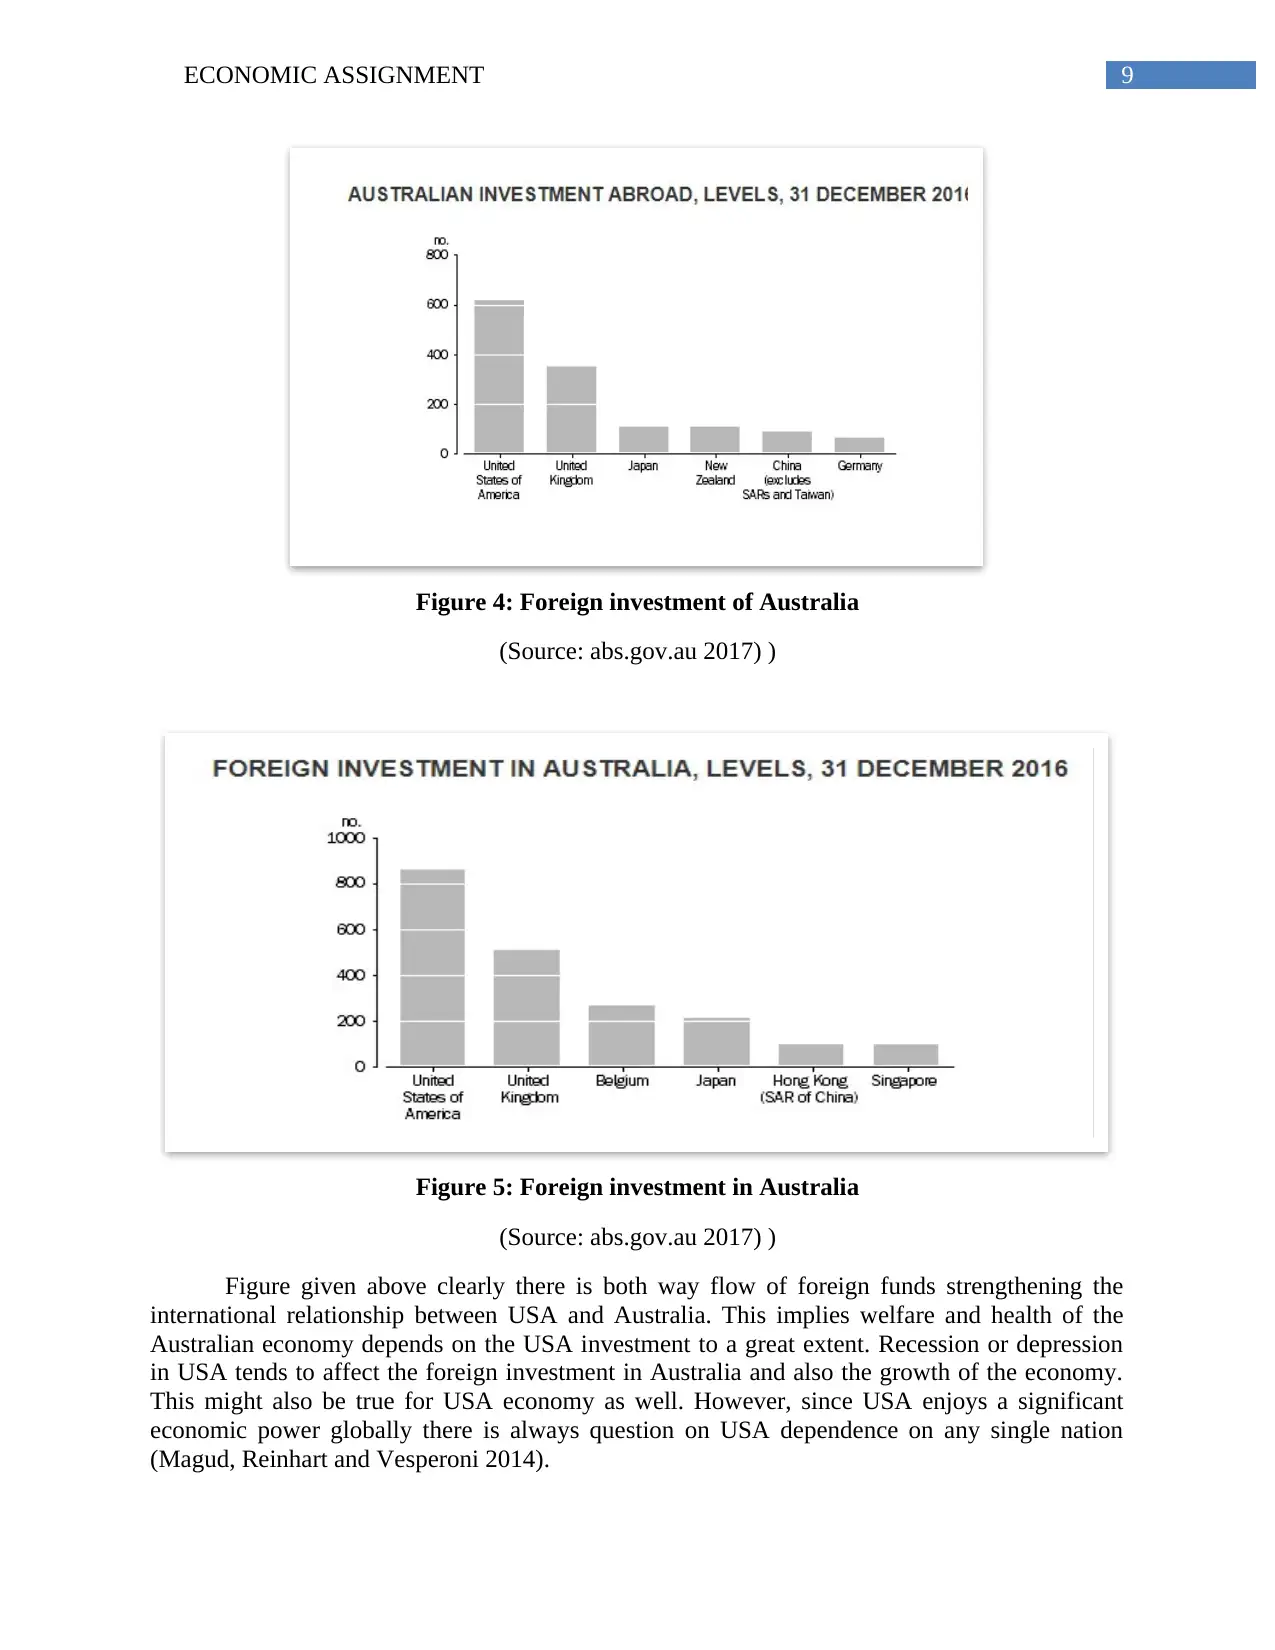
9ECONOMIC ASSIGNMENT
Figure 4: Foreign investment of Australia
(Source: abs.gov.au 2017) )
Figure 5: Foreign investment in Australia
(Source: abs.gov.au 2017) )
Figure given above clearly there is both way flow of foreign funds strengthening the
international relationship between USA and Australia. This implies welfare and health of the
Australian economy depends on the USA investment to a great extent. Recession or depression
in USA tends to affect the foreign investment in Australia and also the growth of the economy.
This might also be true for USA economy as well. However, since USA enjoys a significant
economic power globally there is always question on USA dependence on any single nation
(Magud, Reinhart and Vesperoni 2014).
Paraphrase This Document
Need a fresh take? Get an instant paraphrase of this document with our AI Paraphraser
10ECONOMIC ASSIGNMENT
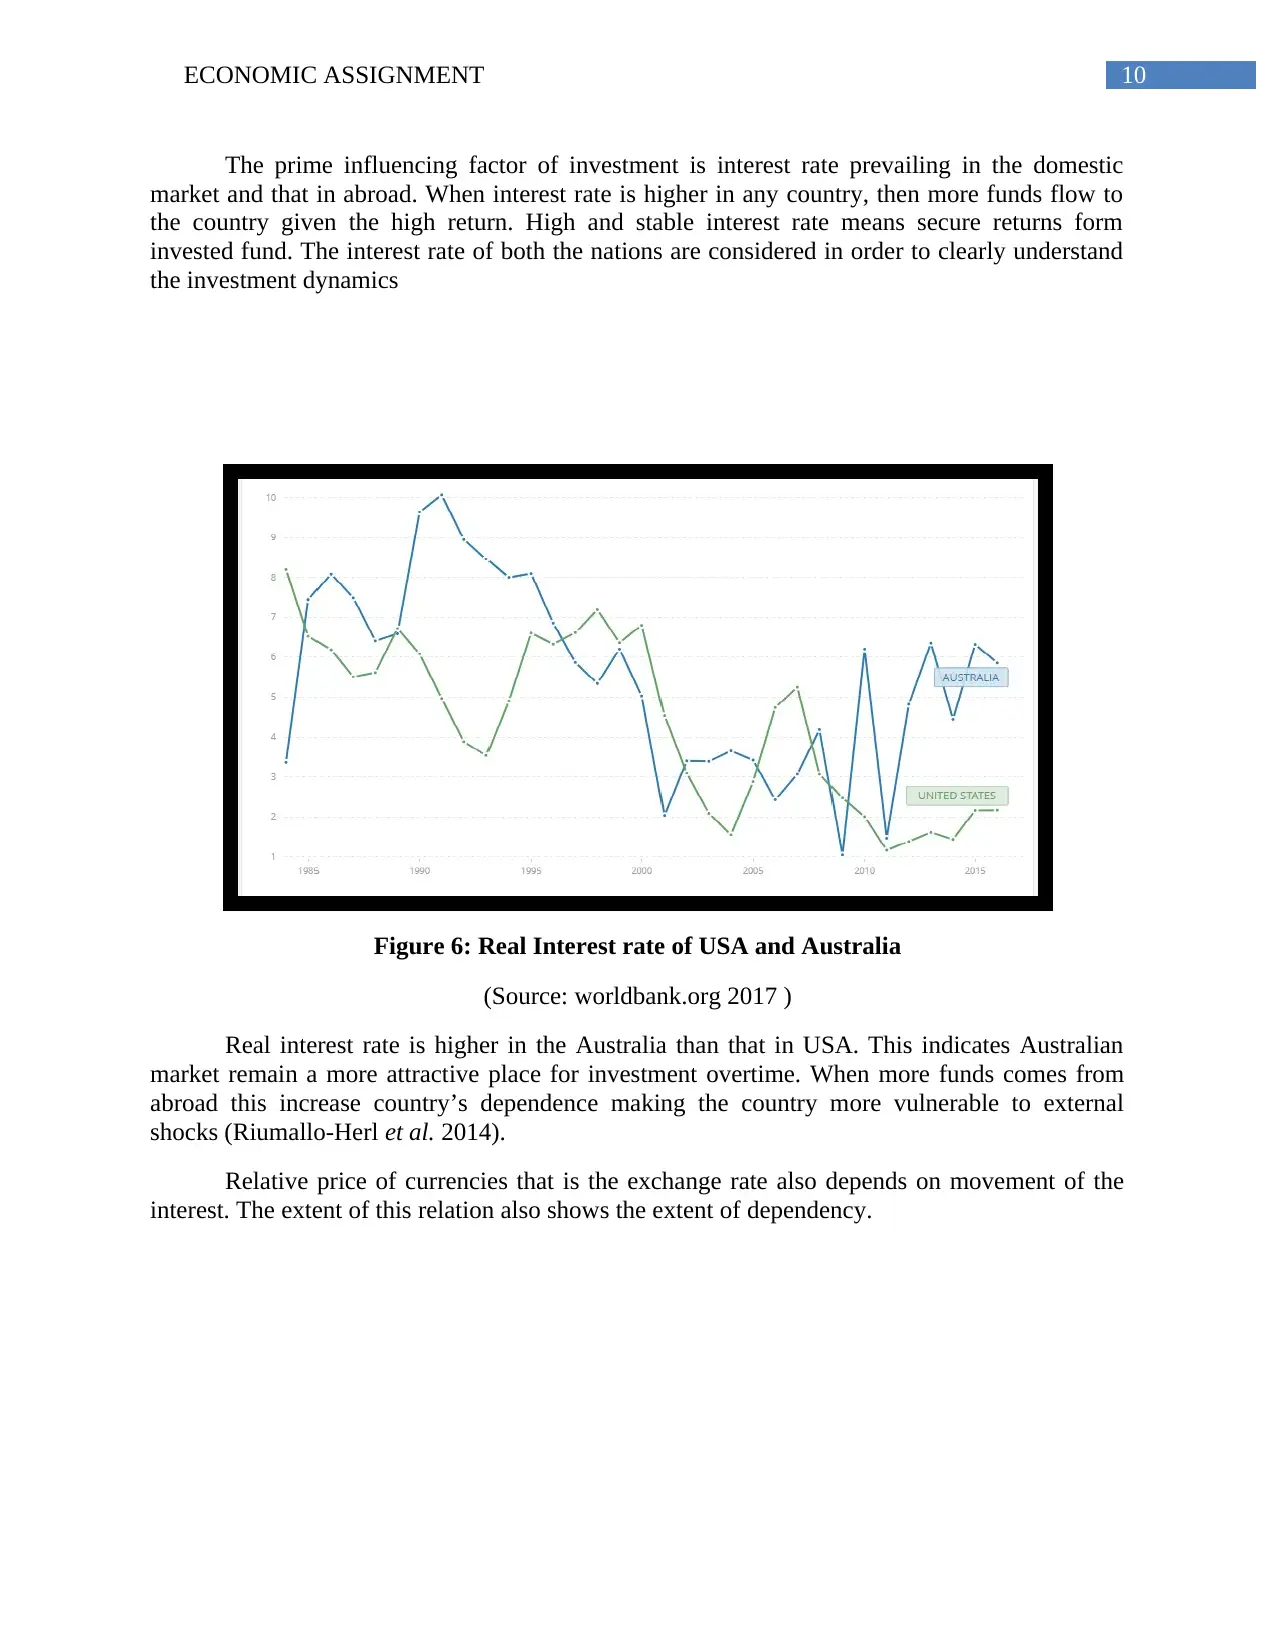
The prime influencing factor of investment is interest rate prevailing in the domestic
market and that in abroad. When interest rate is higher in any country, then more funds flow to
the country given the high return. High and stable interest rate means secure returns form
invested fund. The interest rate of both the nations are considered in order to clearly understand
the investment dynamics
Figure 6: Real Interest rate of USA and Australia
(Source: worldbank.org 2017 )
Real interest rate is higher in the Australia than that in USA. This indicates Australian
market remain a more attractive place for investment overtime. When more funds comes from
abroad this increase country’s dependence making the country more vulnerable to external
shocks (Riumallo-Herl et al. 2014).
Relative price of currencies that is the exchange rate also depends on movement of the
interest. The extent of this relation also shows the extent of dependency.
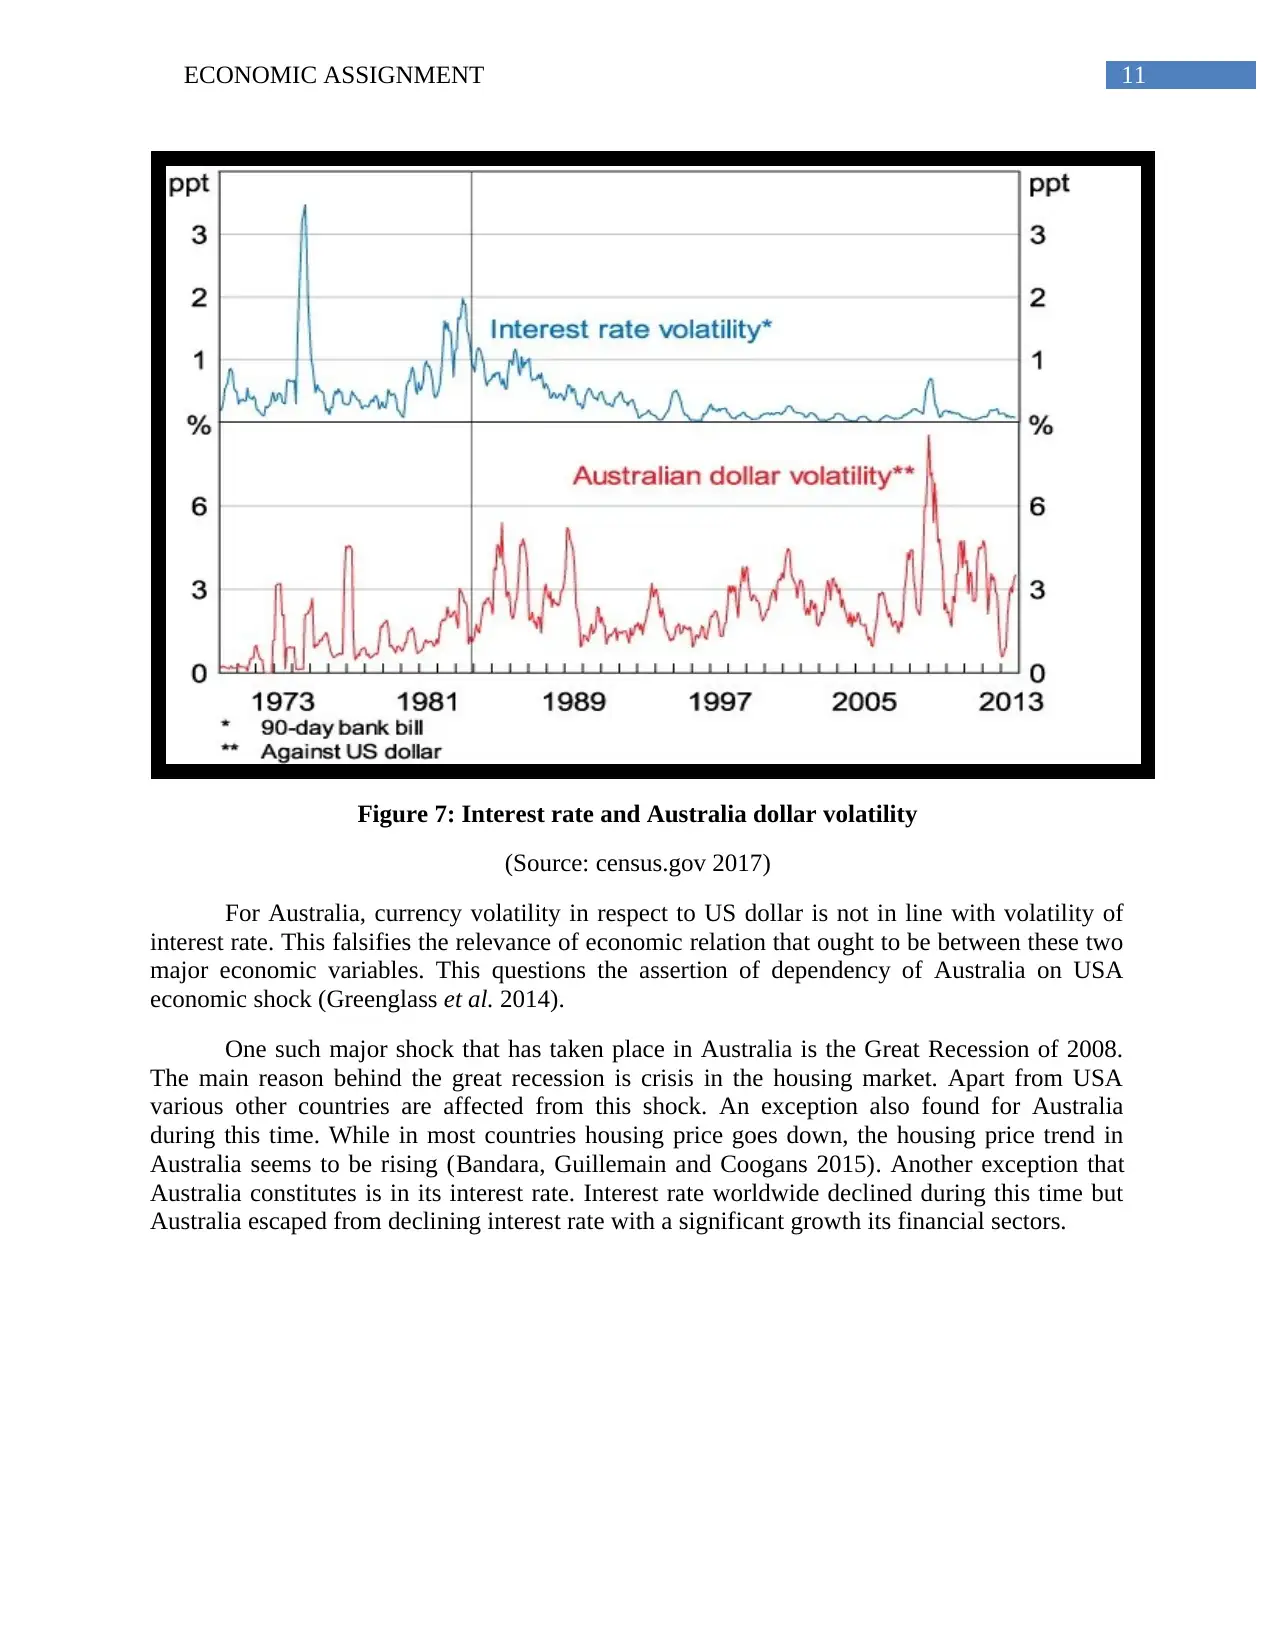
11ECONOMIC ASSIGNMENT
Figure 7: Interest rate and Australia dollar volatility
(Source: census.gov 2017)
For Australia, currency volatility in respect to US dollar is not in line with volatility of
interest rate. This falsifies the relevance of economic relation that ought to be between these two
major economic variables. This questions the assertion of dependency of Australia on USA
economic shock (Greenglass et al. 2014).
One such major shock that has taken place in Australia is the Great Recession of 2008.
The main reason behind the great recession is crisis in the housing market. Apart from USA
various other countries are affected from this shock. An exception also found for Australia
during this time. While in most countries housing price goes down, the housing price trend in
Australia seems to be rising (Bandara, Guillemain and Coogans 2015). Another exception that
Australia constitutes is in its interest rate. Interest rate worldwide declined during this time but
Australia escaped from declining interest rate with a significant growth its financial sectors.
⊘ This is a preview!⊘
Do you want full access?
Subscribe today to unlock all pages.
Trusted by 1+ million students worldwide
1 out of 15
Related Documents


Your All-in-One AI-Powered Toolkit for Academic Success.
+13062052269
info@desklib.com
Available 24*7 on WhatsApp / Email
![[object Object]](/_next/static/media/star-bottom.7253800d.svg)
Unlock your academic potential
Copyright © 2020–2026 A2Z Services. All Rights Reserved. Developed and managed by ZUCOL.