Mechanical Engineering Project: Evaporative Cooling System Analysis
VerifiedAdded on 2022/09/27
|15
|2187
|30
Project
AI Summary
This project provides a comprehensive analysis of an evaporative cooling system, focusing on its functioning and control strategies. It begins with a block diagram of the system and details the equipment specifications, including temperature monitoring devices, vibration monitoring devices, speed monitoring devices, automatic synchronizing components, and various electrical measurement transducers. The project then delves into the existing and proposed control strategies, comparing a throttle-type control valve strategy with a variable speed control strategy. Laboratory calculations for both strategies are presented, along with a comparative curve illustrating the performance differences. Furthermore, the project evaluates the viability of solar PV operation with one-day autonomy for the system, calculating power production based on solar data for both dry and wet years. The analysis covers component lifetime and module efficiency to determine the system's output power. The project concludes by highlighting the improvements achieved through the proposed control strategy and assesses the potential for sustainable energy integration.
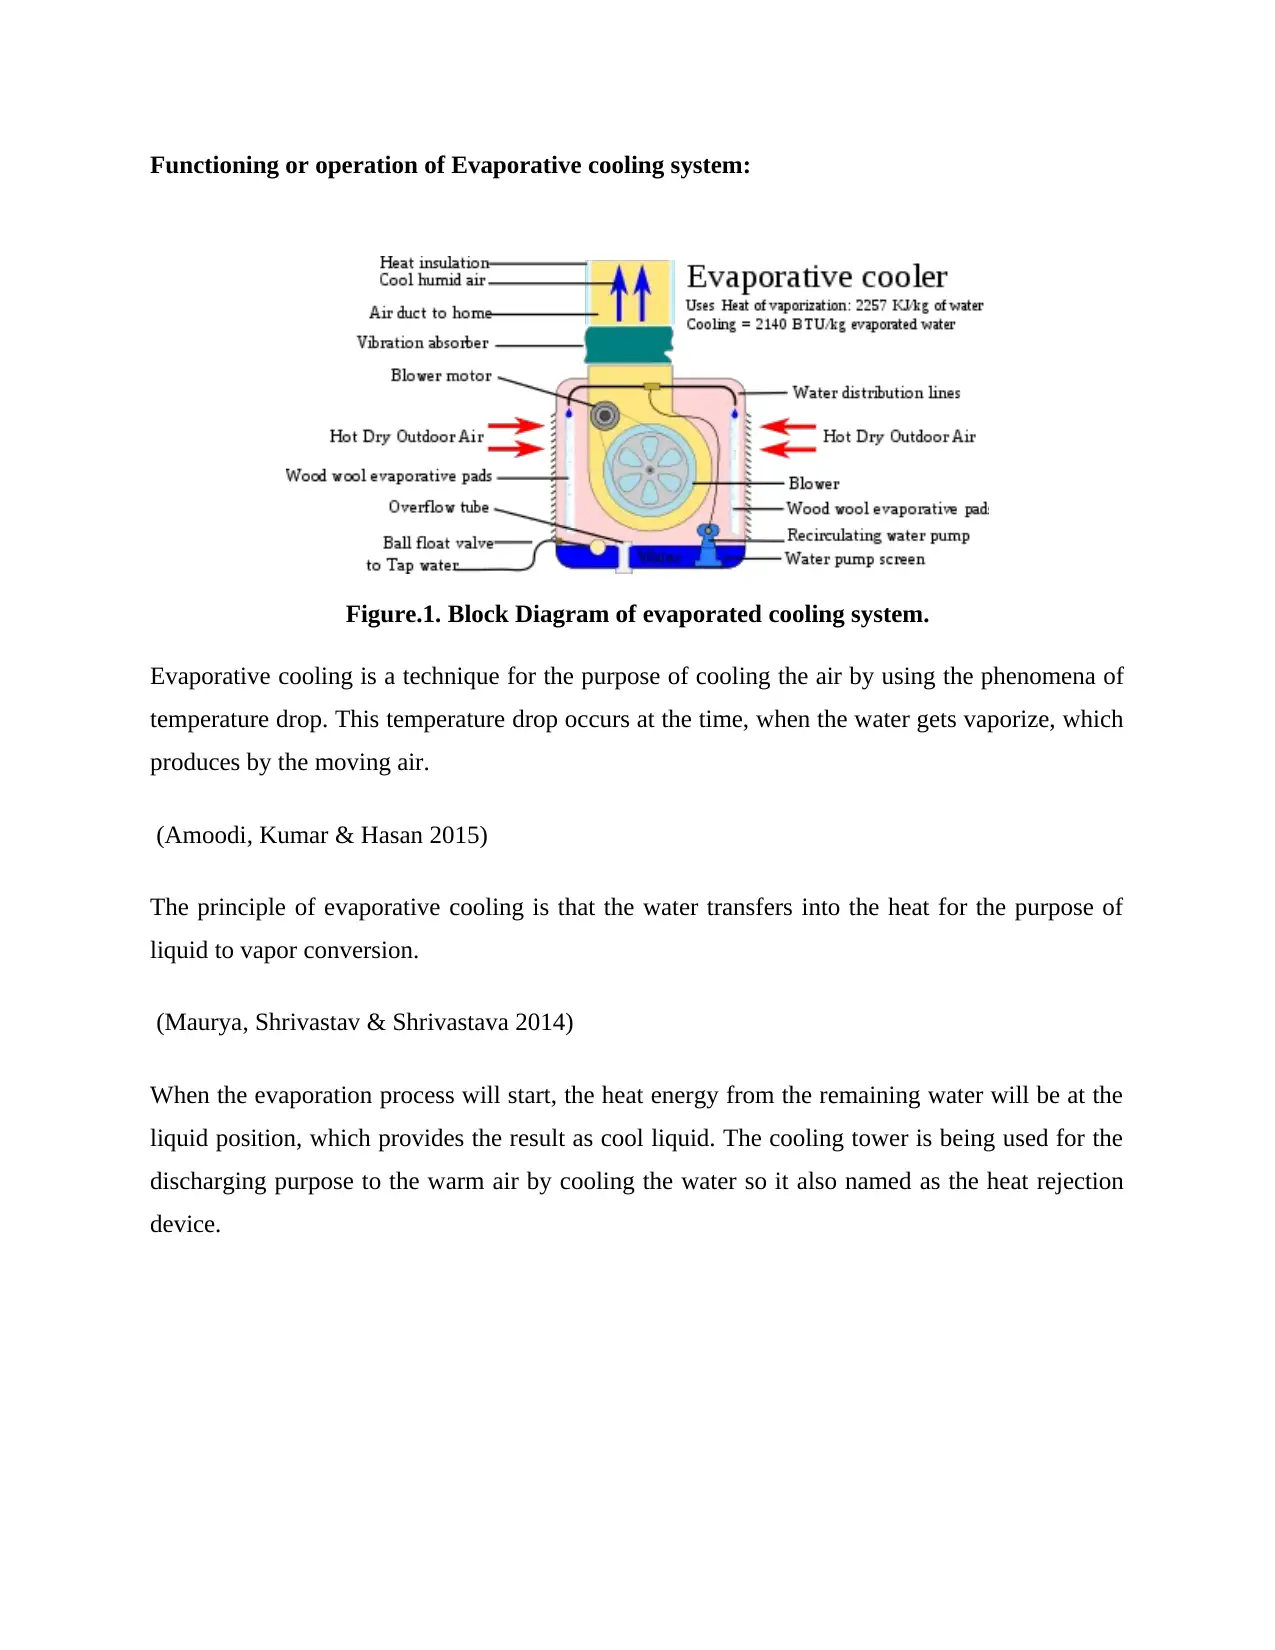
Functioning or operation of Evaporative cooling system:
Figure.1. Block Diagram of evaporated cooling system.
Evaporative cooling is a technique for the purpose of cooling the air by using the phenomena of
temperature drop. This temperature drop occurs at the time, when the water gets vaporize, which
produces by the moving air.
(Amoodi, Kumar & Hasan 2015)
The principle of evaporative cooling is that the water transfers into the heat for the purpose of
liquid to vapor conversion.
(Maurya, Shrivastav & Shrivastava 2014)
When the evaporation process will start, the heat energy from the remaining water will be at the
liquid position, which provides the result as cool liquid. The cooling tower is being used for the
discharging purpose to the warm air by cooling the water so it also named as the heat rejection
device.
Paraphrase This Document
Need a fresh take? Get an instant paraphrase of this document with our AI Paraphraser
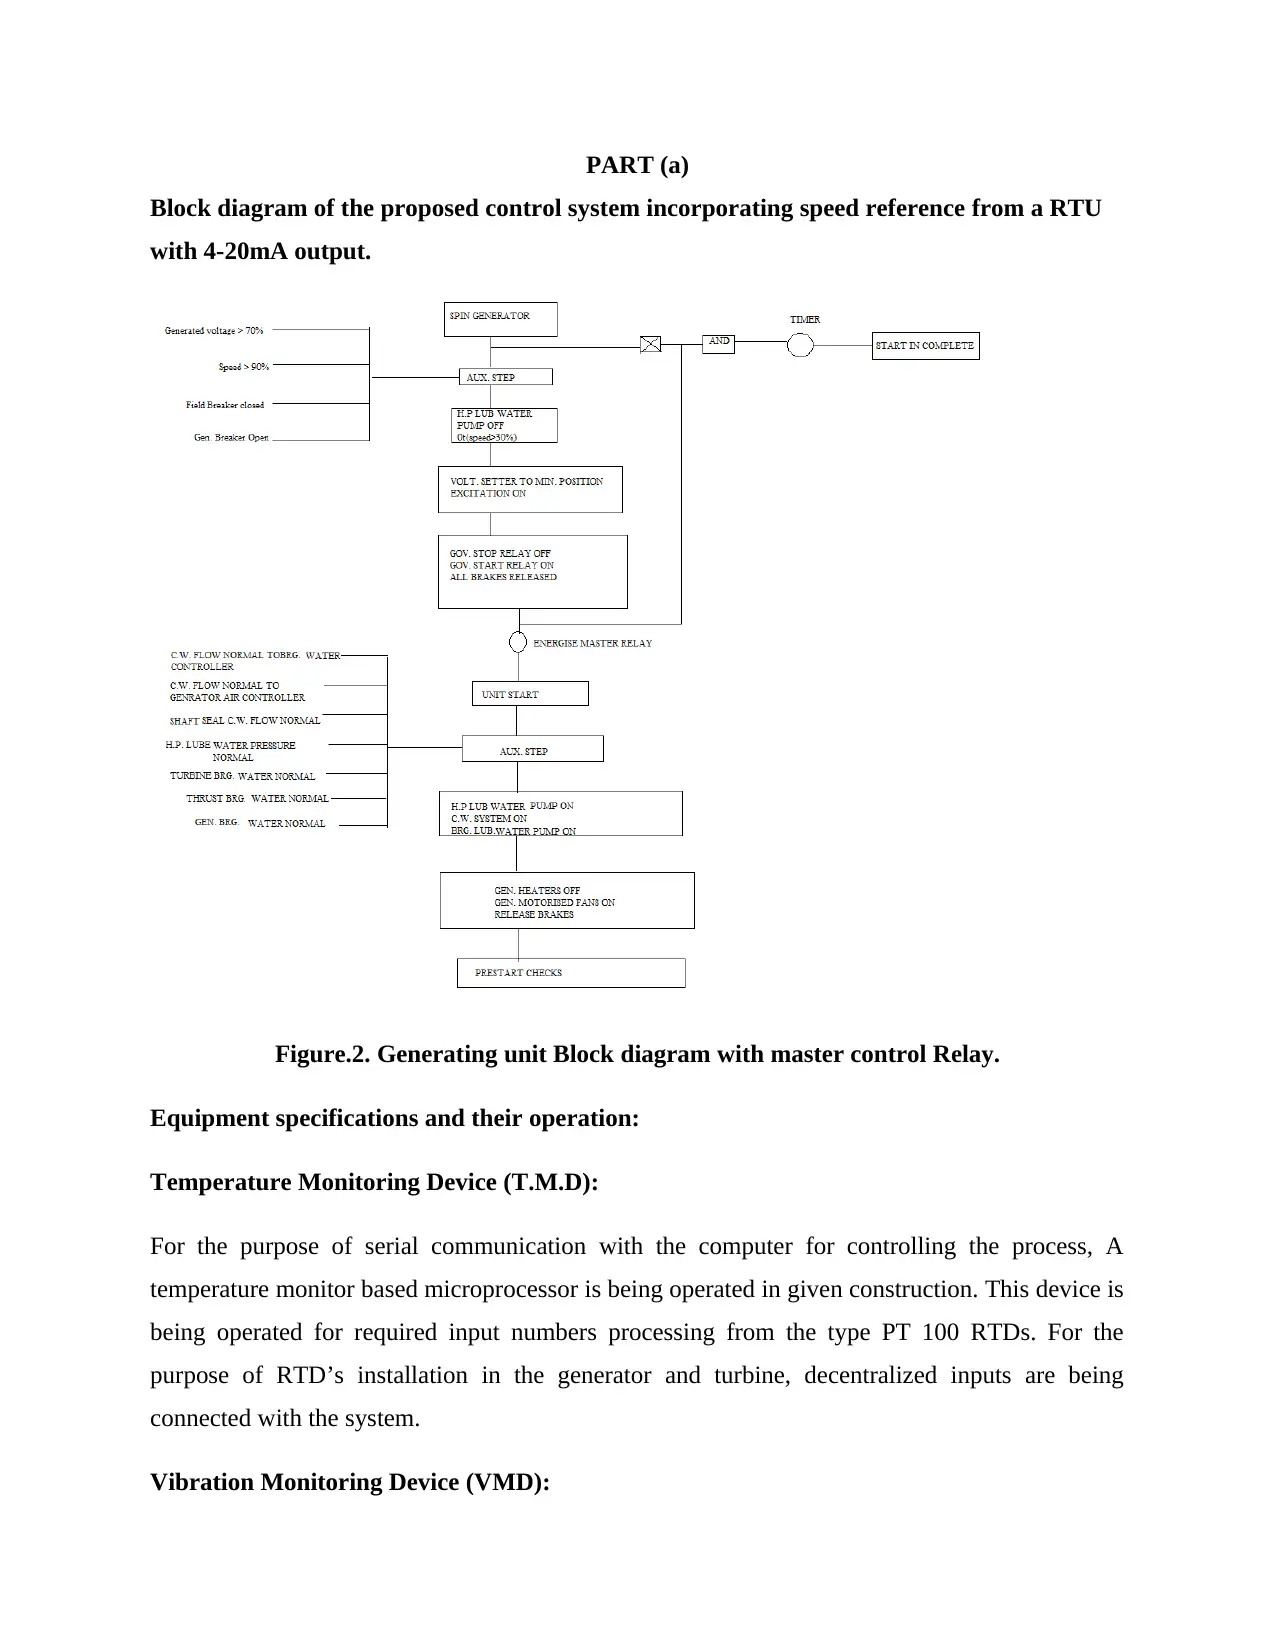
PART (a)
Block diagram of the proposed control system incorporating speed reference from a RTU
with 4-20mA output.
Figure.2. Generating unit Block diagram with master control Relay.
Equipment specifications and their operation:
Temperature Monitoring Device (T.M.D):
For the purpose of serial communication with the computer for controlling the process, A
temperature monitor based microprocessor is being operated in given construction. This device is
being operated for required input numbers processing from the type PT 100 RTDs. For the
purpose of RTD’s installation in the generator and turbine, decentralized inputs are being
connected with the system.
Vibration Monitoring Device (VMD):
VMD is able to communicate with computer by serial interface technique for the purpose of
process control. It is a microprocessor based device equipped with 6 channels for the purpose of
monitor the detector, which specification is being provided by the turbine.
SMD or Speed Monitoring Device:
This device is being specified for the installation purpose of turbine parameters. The sensor of
this system is being mounted at the shaft of generator for providing the output valued as 4 to
20ma.
ASC or Automatic Synchronizing component:
The Automatic synchronization is being made by using the automatic synchronizer unit. The unit
of synchronizing check relay is being provided in the system.
EMT or Electrical measurement transducers:
The EMT are used in various function measurement such as: cosØ, MVar, HZ,3 phase current
and MVarh.
Digital status and Alarm inputs:
The system controller should be able to connect the sixty contact inputs which show the status
and alarm. The controller input modules should be strippable. So that it can allow any contact
input for shutting down the hardware and for stopping the relay.
DC analog inputs:
The system controller should have the ability to accept the analog signals such as: 0-5v, 1-5v
DC, 0-1ma, and 4-20ma analog signals. And it might also be possible to measure Dc signal for
the value of 5V as common mode signals and the differential inputs.
AC current inputs:
The accurate value of AC current input at 0-6.25 amp should be provided to the controller.it
should have the continuous signal value at 10 amp and 50 amp/sec.
⊘ This is a preview!⊘
Do you want full access?
Subscribe today to unlock all pages.
Trusted by 1+ million students worldwide
AC input Voltage:
The accurate value of AC input voltage at 80-150Vac should be measured by the controller.
Control outputs:
The controller provides the control relay, which is being used in the operation of circuit breakers,
Voltage regulators and other components. The contacts of DPDT must be rated as 125VDC,
0.5A.
RTD Inputs:
The RTD is being connected with the controller and its reading is accurate at the value of
+0.250C.The temperature range should be at 0-1600C. the controller should have 8 number of
inputs for RTD at the different values such as: 10, 100, 120 ohms. And the controller must have
the ability to read the temperature for all RTD’s numbered as 8.
Analog Outputs:
The controller output must be at 4-20ma for the calculation of signal in various forms such as:
Voltage, Current, Power factor, KVar, KW etc. The isolated output signal should have the ability
to perform 1000 common mode voltages. And the output accuracy must be more than 25%.
Alarm outputs (Normal):
The controller should have the ability for controlling the alarm output, which is being generated
internally. The rating for this alarm contact should be at 1 amp on the voltage at 120 VDC.
Electrical Transducers:
The controller should have the ability for deriving the transducer’s components such as:
Generator frequency, Generator power factor, generator Watts, VARS etc. and these transducers
should be connected with the potential and current transformer.
Paraphrase This Document
Need a fresh take? Get an instant paraphrase of this document with our AI Paraphraser

Electronic Turbine Governor:
The electronic turbine governor should be installed and integrated with the UCB. And this device
should also have the serial interface with the computer for process control communication.
Digital excitation control:
This component should be installed and integrated with UCB.
Status Switchboard:
The status switchboard should contain the graphic-visual indication, net station recorders at
megawatts and mega vars with various data displays etc.
Alarms and the Annunciation:
There are several devices which exist into it.
Audio-Video Signals:
The annunciation system provides both of the audio and video signals.
a. Audio signals:
Horn is being used mostly in the system for the purpose of audio signal processing devices.
b. Visual Signals:
In the annunciator, the lighted lettered window panel component is being used to provide the
visual signal to the controller.
Annunciator:
The annunciator system should be designed for 110 volt DC system. The annunciator circuit
system is being separated from the dc circuit.
Field Contact Control
Pushbutton or
Switch
Alarm lights Horn Auxiliary or
Repeater
contacts
NORMAL -- OFF OFF OFF
ABNORMAL -- FLASHING ON ON
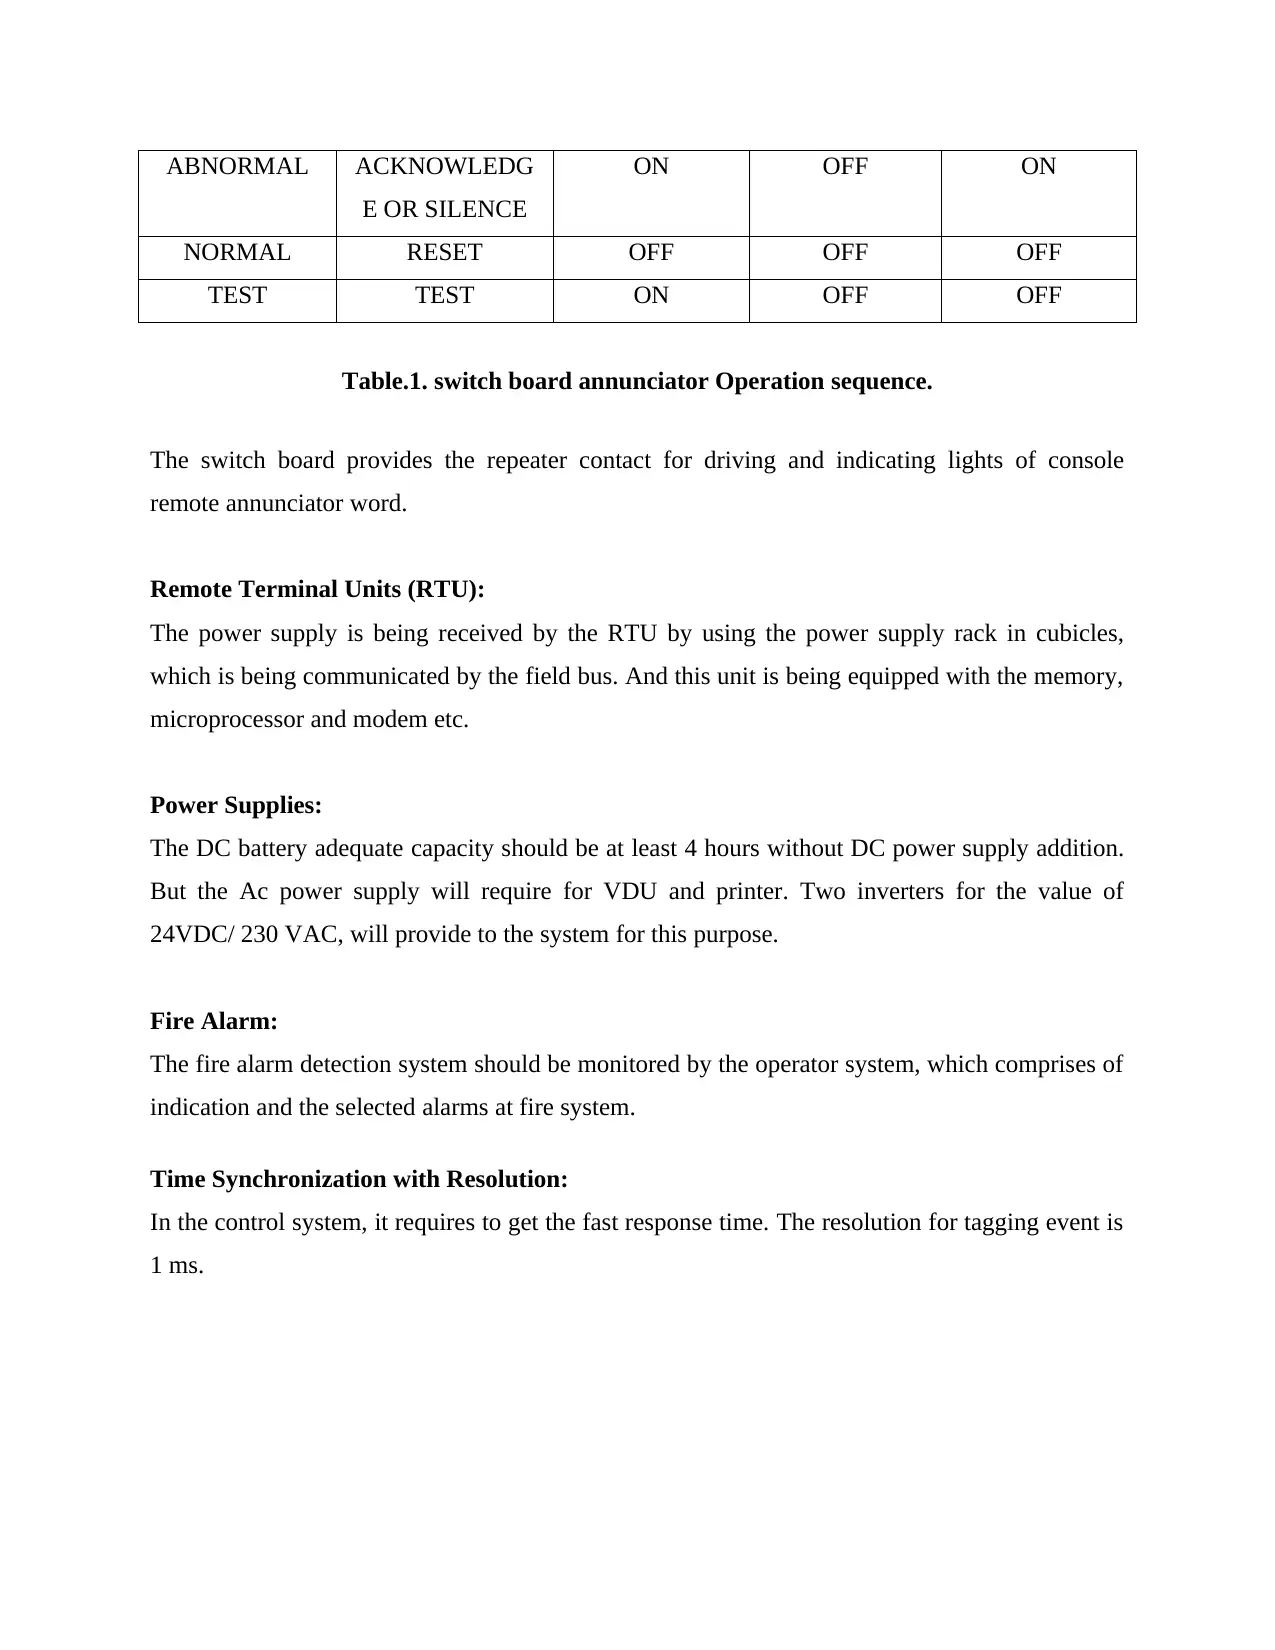
ABNORMAL ACKNOWLEDG
E OR SILENCE
ON OFF ON
NORMAL RESET OFF OFF OFF
TEST TEST ON OFF OFF
Table.1. switch board annunciator Operation sequence.
The switch board provides the repeater contact for driving and indicating lights of console
remote annunciator word.
Remote Terminal Units (RTU):
The power supply is being received by the RTU by using the power supply rack in cubicles,
which is being communicated by the field bus. And this unit is being equipped with the memory,
microprocessor and modem etc.
Power Supplies:
The DC battery adequate capacity should be at least 4 hours without DC power supply addition.
But the Ac power supply will require for VDU and printer. Two inverters for the value of
24VDC/ 230 VAC, will provide to the system for this purpose.
Fire Alarm:
The fire alarm detection system should be monitored by the operator system, which comprises of
indication and the selected alarms at fire system.
Time Synchronization with Resolution:
In the control system, it requires to get the fast response time. The resolution for tagging event is
1 ms.
⊘ This is a preview!⊘
Do you want full access?
Subscribe today to unlock all pages.
Trusted by 1+ million students worldwide
PART (b)
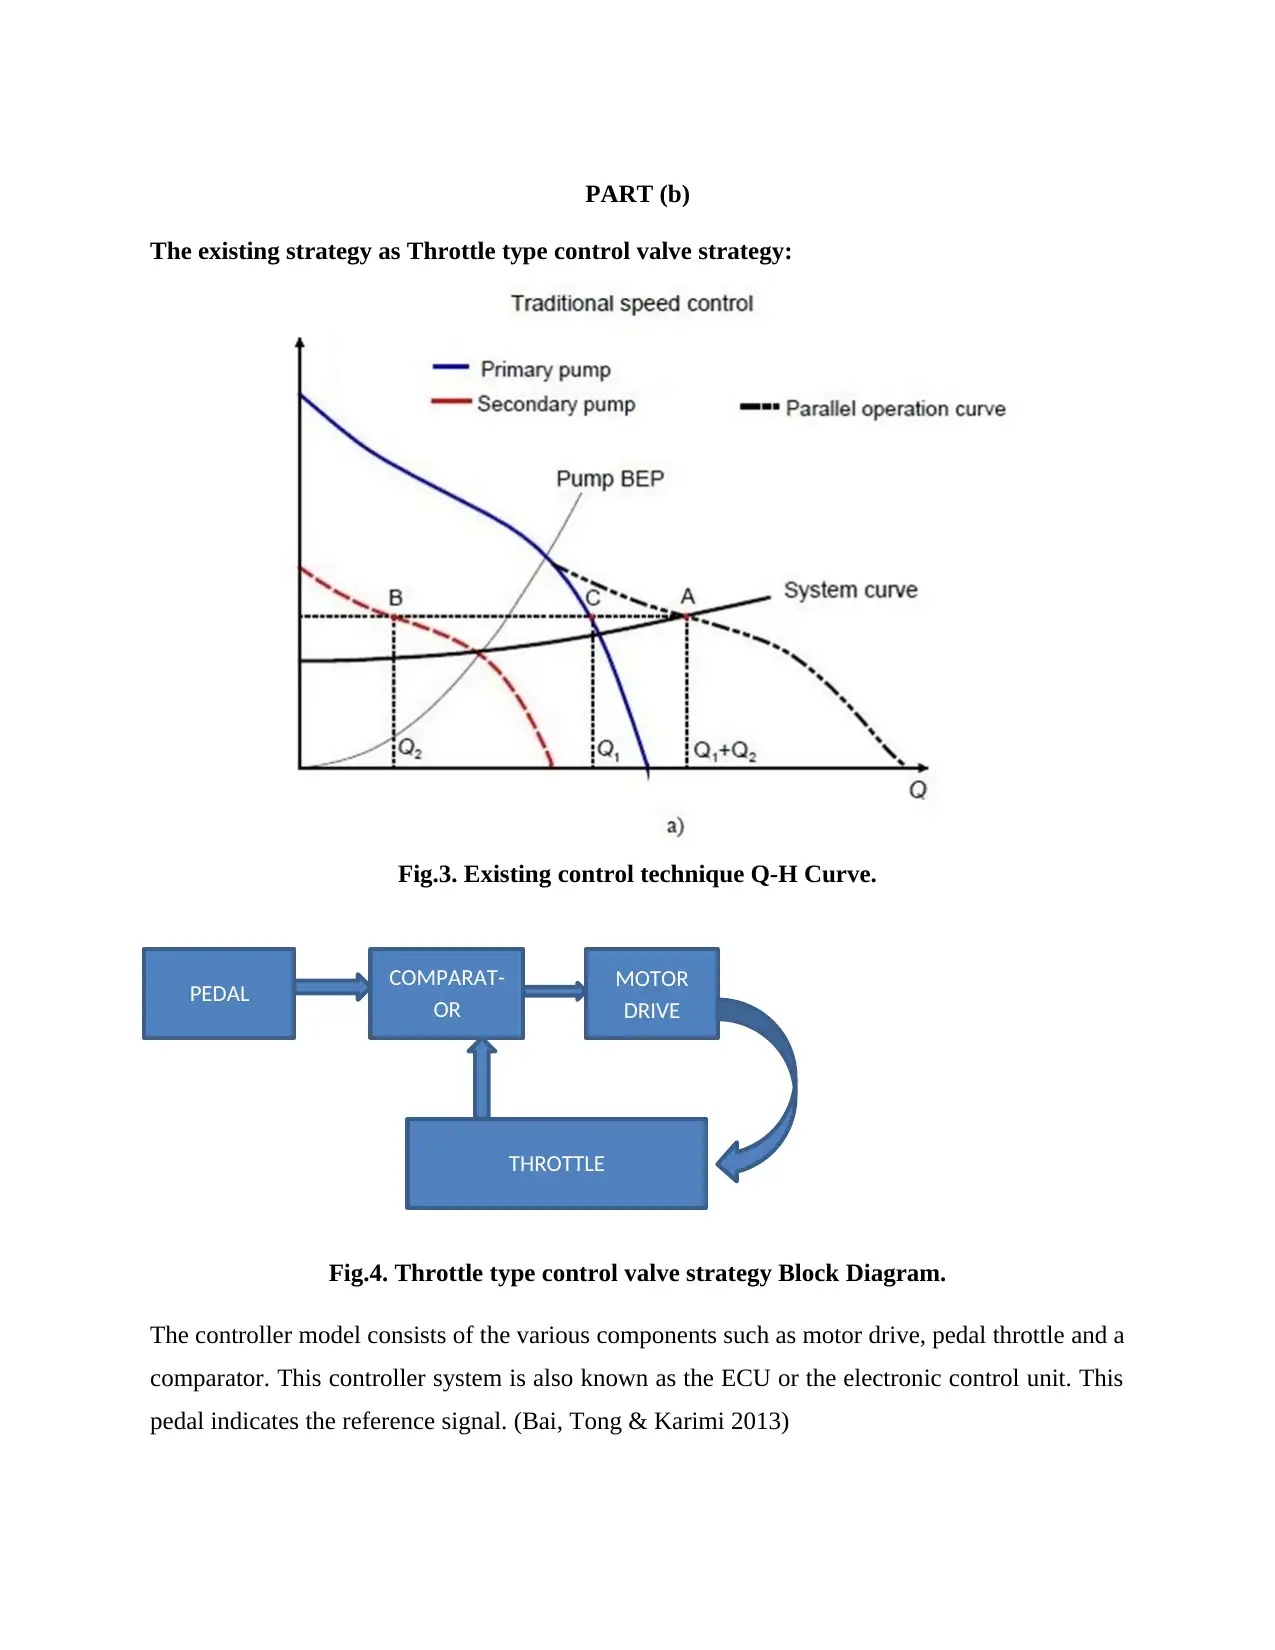
The existing strategy as Throttle type control valve strategy:
Fig.3. Existing control technique Q-H Curve.
Fig.4. Throttle type control valve strategy Block Diagram.
The controller model consists of the various components such as motor drive, pedal throttle and a
comparator. This controller system is also known as the ECU or the electronic control unit. This
pedal indicates the reference signal. (Bai, Tong & Karimi 2013)
PEDAL COMPARAT-
OR
MOTOR
DRIVE
THROTTLE
Paraphrase This Document
Need a fresh take? Get an instant paraphrase of this document with our AI Paraphraser
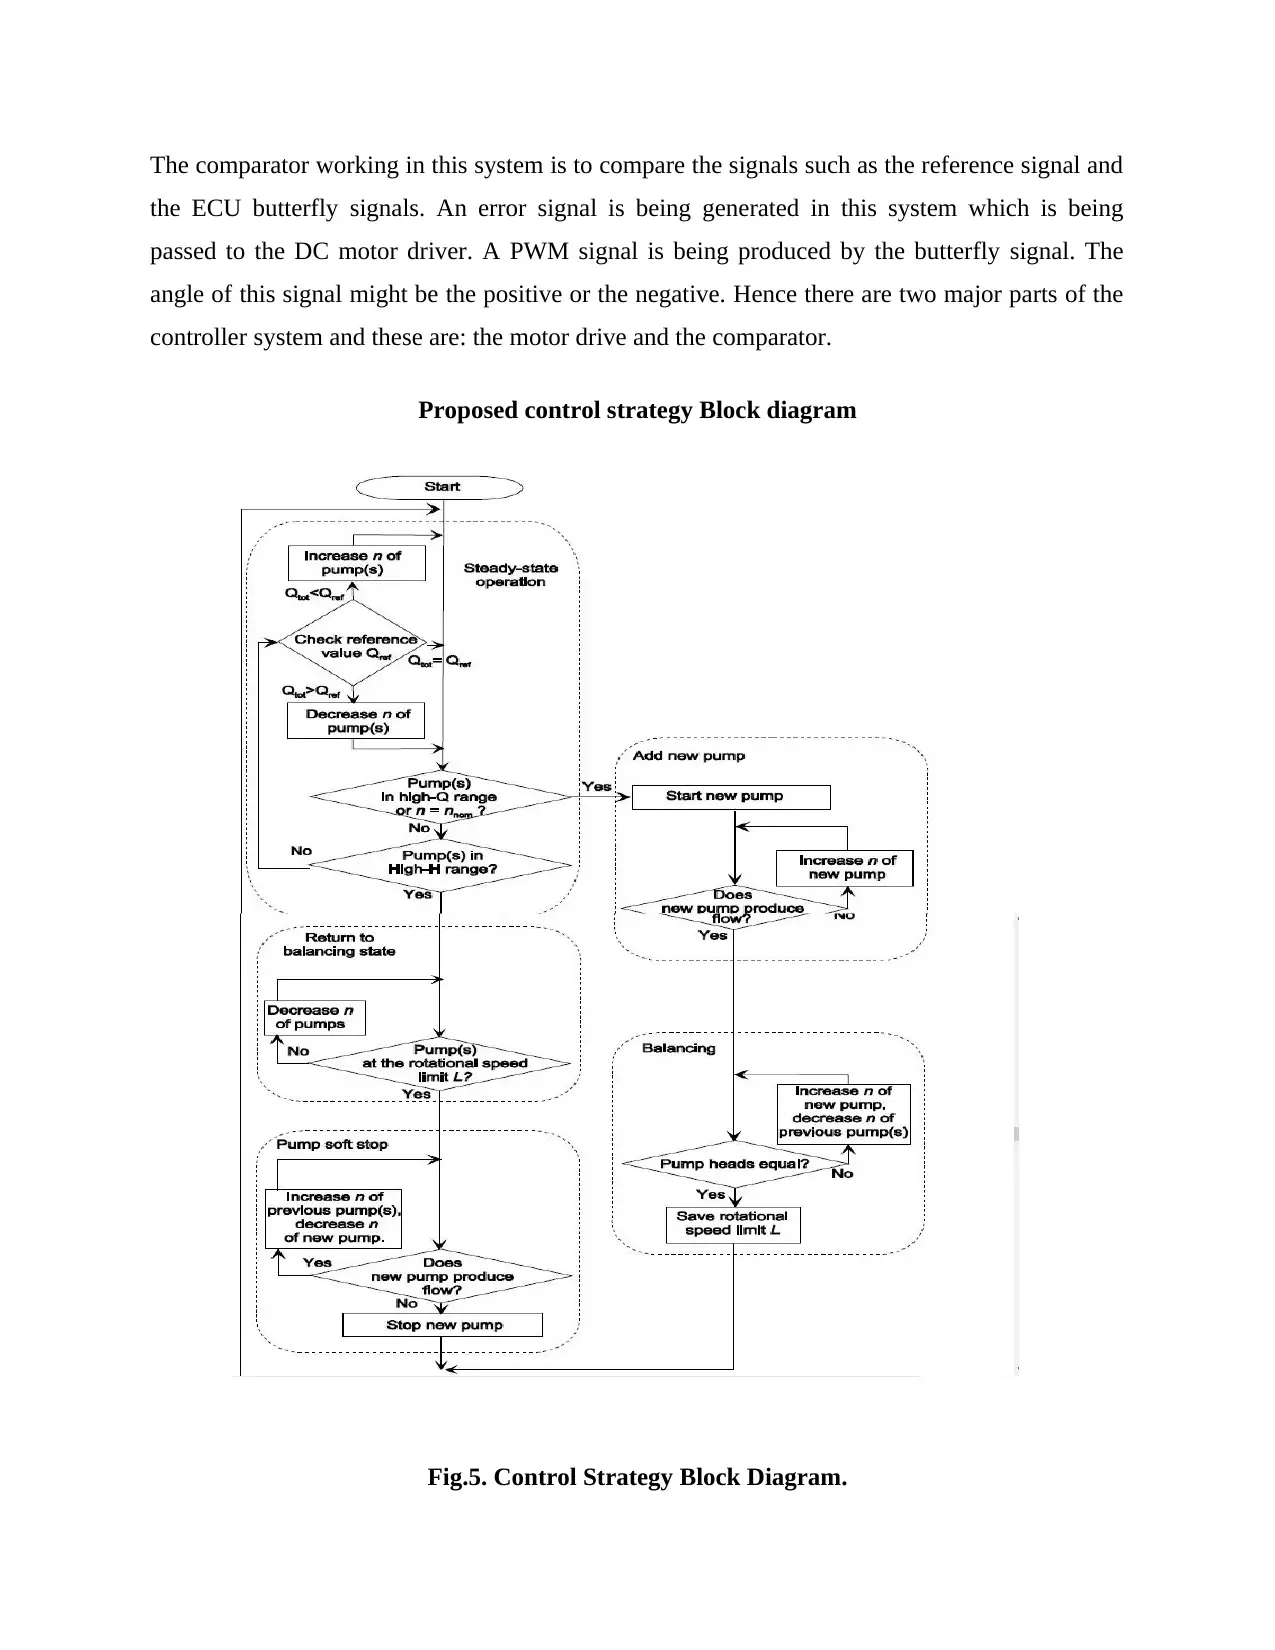
The comparator working in this system is to compare the signals such as the reference signal and
the ECU butterfly signals. An error signal is being generated in this system which is being
passed to the DC motor driver. A PWM signal is being produced by the butterfly signal. The
angle of this signal might be the positive or the negative. Hence there are two major parts of the
controller system and these are: the motor drive and the comparator.
Proposed control strategy Block diagram
Fig.5. Control Strategy Block Diagram.
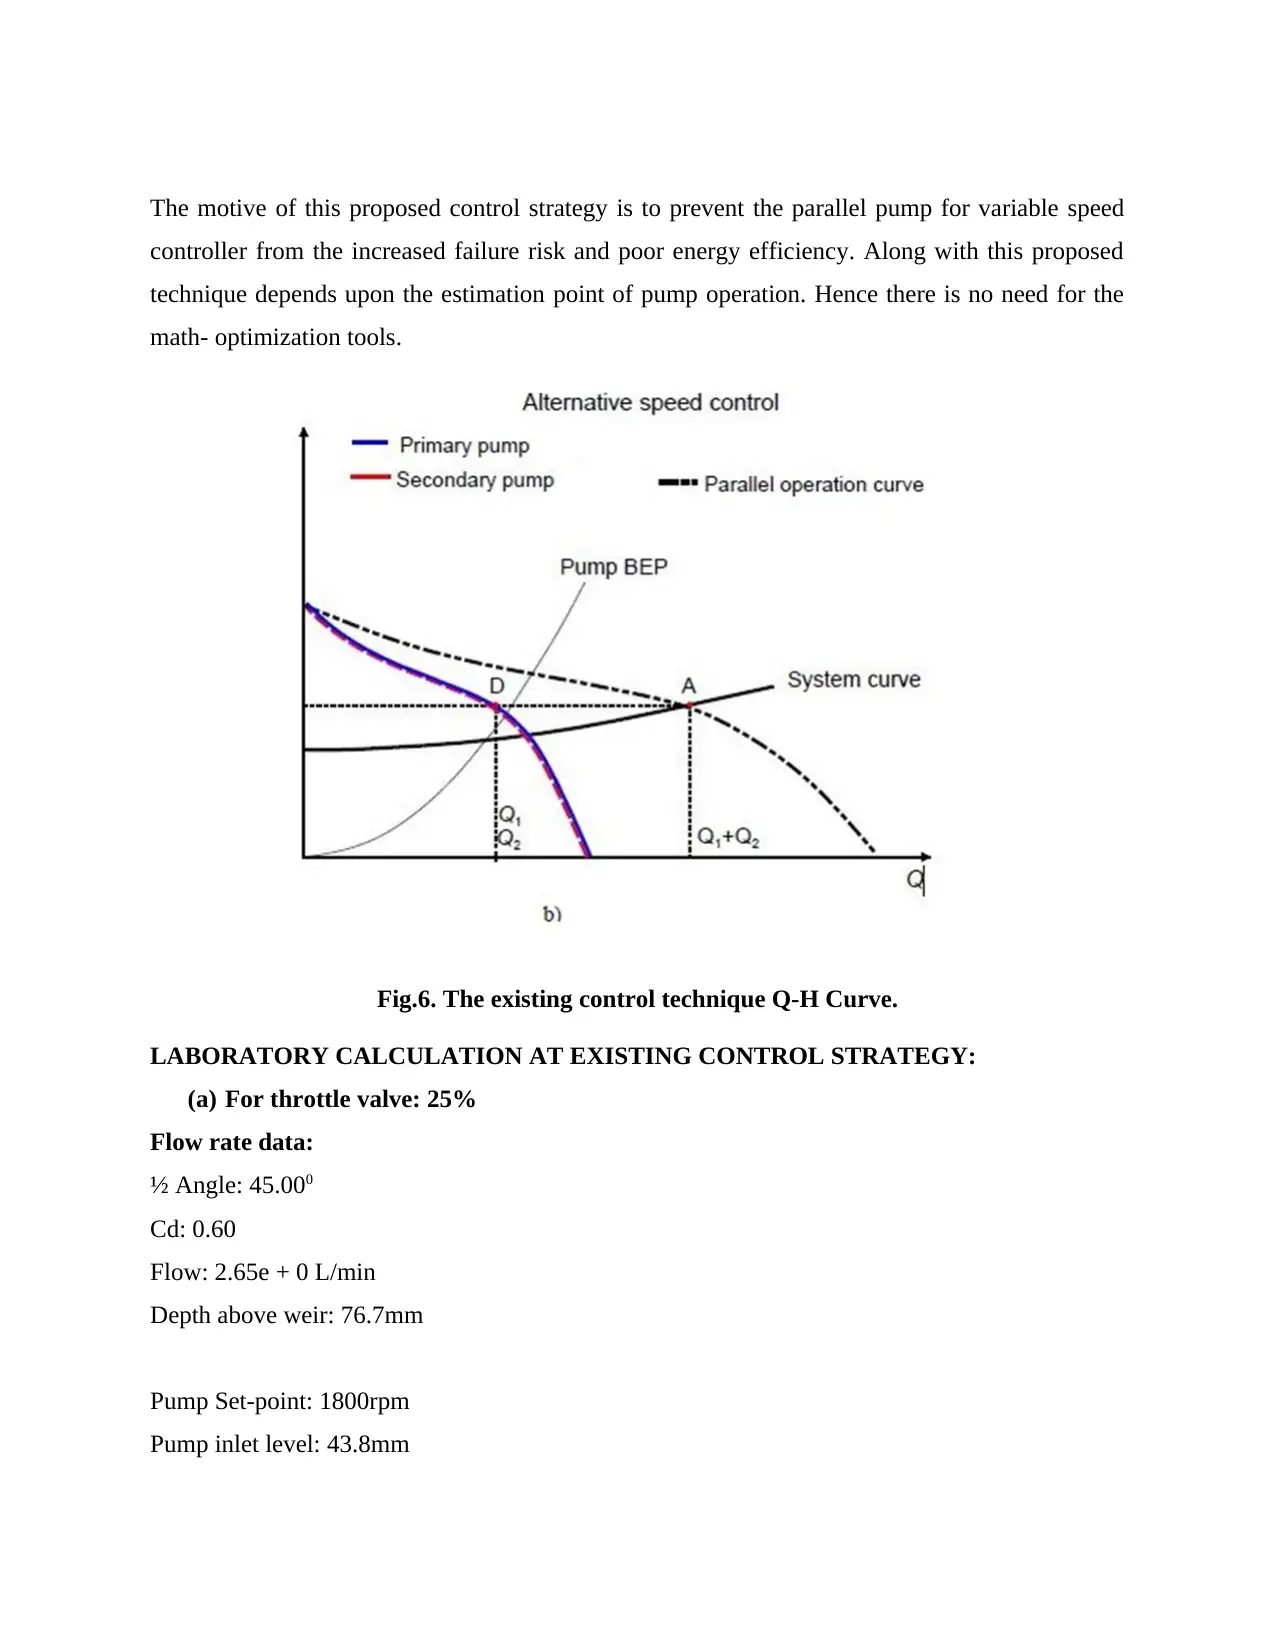
The motive of this proposed control strategy is to prevent the parallel pump for variable speed
controller from the increased failure risk and poor energy efficiency. Along with this proposed
technique depends upon the estimation point of pump operation. Hence there is no need for the
math- optimization tools.
Fig.6. The existing control technique Q-H Curve.
LABORATORY CALCULATION AT EXISTING CONTROL STRATEGY:
(a) For throttle valve: 25%
Flow rate data:
½ Angle: 45.000
Cd: 0.60
Flow: 2.65e + 0 L/min
Depth above weir: 76.7mm
Pump Set-point: 1800rpm
Pump inlet level: 43.8mm
⊘ This is a preview!⊘
Do you want full access?
Subscribe today to unlock all pages.
Trusted by 1+ million students worldwide
Motor Torque: 112.8Nm
Motor Speed: 1925 rpm
Pump outlet: 3e+05 Kpa
Pump Flow: 2e + 06 L/min
(b) For throttle valve: 50%
Flow rate data:
½ Angle: 45.000
Cd: 0.60
Flow: 1.50e + 0 L/min
Depth above weir: 87.5mm
Pump Set-point: 1800rpm
Pump inlet level: 39.8mm
Motor Torque: 115.6Nm
Motor Speed: 1845 rpm
Pump outlet: 5e-1 Kpa
Pump Flow: 2e + 06 L/min
LABORATORY CALCULATION AT PROPOSED CONTROL TECHNIQUE:
(a) For throttle valve: 50%
Flow rate Calculation: 0.2780 m3/ min.
Depth above weir: 101.3mm
Inlet level: 8.7mm
Pump Speed: 2800rpm
Motor output Torque: 2.49Nm
Pump outlet pressure: 8.60m
Pump outlet pressure: 84.4kpa.
(b) For throttle valve: 25%
Flow rate Calculation: 0.1343 m3/ min.
Paraphrase This Document
Need a fresh take? Get an instant paraphrase of this document with our AI Paraphraser
Depth above weir: 75.7mm
Inlet level: 43.4mm
Pump Speed: 2800rpm
Motor output Torque: 1.81Nm
Pump outlet pressure: 17.95m
Pump outlet pressure: 176.1kpa.
(c) For throttle valve: 25%
Flow rate Calculation: 0.0968 m3/ min.
Depth above weir: 66.4mm
Inlet level: 56.7mm
Pump Speed: 2000rpm
Motor output Torque: 0.87Nm
Pump outlet pressure: 9.22m
Pump outlet pressure: 90.4kpa.
(d) For throttle valve: 25%
Flow rate Calculation: 0.0555 m3/ min.
Depth above weir: 53.2mm
Inlet level: 75.2mm
Pump Speed: 1200rpm
Motor output Torque: 0.35Nm
Pump outlet pressure: 3.33m
Pump outlet pressure: 32.7kpa.
(e) For throttle valve: 50%
Flow rate Calculation: 0.1125 m3/ min.
Depth above weir: 70.6mm
Inlet level: 50.3mm
Pump Speed: 1200rpm
Motor output Torque: 0.45Nm
Pump outlet pressure: 1.72m
Pump outlet pressure: 1.68kpa.
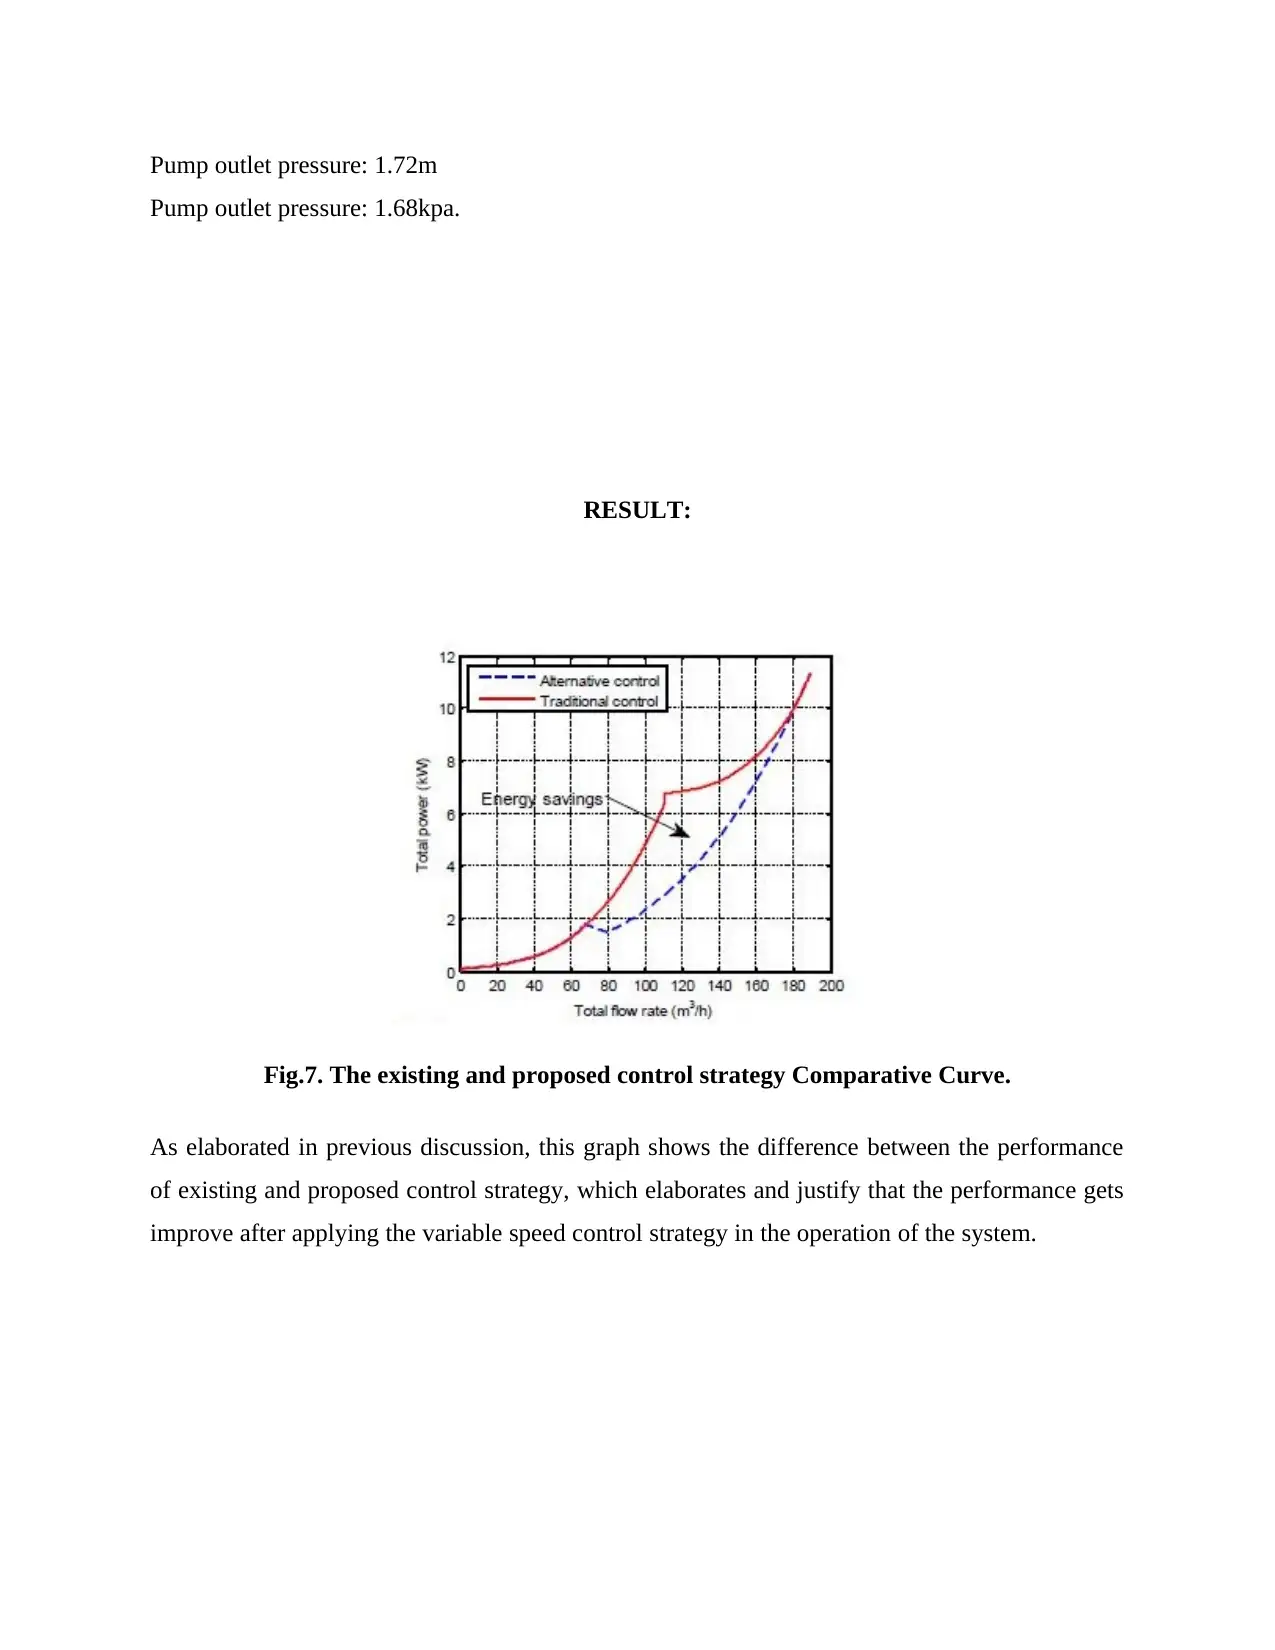
RESULT:
Fig.7. The existing and proposed control strategy Comparative Curve.
As elaborated in previous discussion, this graph shows the difference between the performance
of existing and proposed control strategy, which elaborates and justify that the performance gets
improve after applying the variable speed control strategy in the operation of the system.
Pump outlet pressure: 1.68kpa.
RESULT:
Fig.7. The existing and proposed control strategy Comparative Curve.
As elaborated in previous discussion, this graph shows the difference between the performance
of existing and proposed control strategy, which elaborates and justify that the performance gets
improve after applying the variable speed control strategy in the operation of the system.
⊘ This is a preview!⊘
Do you want full access?
Subscribe today to unlock all pages.
Trusted by 1+ million students worldwide
1 out of 15
Your All-in-One AI-Powered Toolkit for Academic Success.
+13062052269
info@desklib.com
Available 24*7 on WhatsApp / Email
![[object Object]](/_next/static/media/star-bottom.7253800d.svg)
Unlock your academic potential
Copyright © 2020–2026 A2Z Services. All Rights Reserved. Developed and managed by ZUCOL.