Everpia London: Comprehensive Business Data and Financial Report
VerifiedAdded on 2021/01/22
|17
|3111
|429
Report
AI Summary
This report presents a comprehensive analysis of Everpia London, addressing key aspects of its business operations. Task 1 focuses on data collection, differentiating between primary and secondary sources, outlining survey methods, sampling techniques, and questionnaire design. It details the process of collecting data and summarizing findings, including the use of mean, median, and mode. Task 2 delves into financial statements, explaining the four main types: statement of financial position, income statement, cash flow statement, and statement of changes in equity. It compares different formats of financial statements and their appropriateness for various business types. Task 3 applies management accounting techniques, classifying and calculating costs, and preparing budgets. Task 4 supports decision-making by using accounting techniques, including pricing and investment decisions, budget analysis, unit cost calculations, investment appraisal techniques, and identifying sources of finance. The report provides a detailed overview of Everpia London's financial performance and strategic considerations for business expansion.
Contents
Introduction................................................................................................................................................2
TASK 1.......................................................................................................................................................2
1.1. Create a plan to collect primary and secondary data...............................................................2
1.2. Choose appropriate survey methods, sampling techniques and questionnaires.................3
1.3. Collect data using your plan and sampling methods................................................................4
1.4. Produce a report summarizing your findings, rationale and conclusions..............................6
Task 2.........................................................................................................................................................7
2.1: Explain the main financial statements........................................................................................7
2.2. Comparison of different formats of financial statements and their appropriateness for
different types of business...................................................................................................................9
Task 3.......................................................................................................................................................13
3.1. Explain and apply management accounting techniques to classify and calculate costs
and prepare budgets for an organization of your choice. In your response, you should classify
different types of cost, use different costing methods for your calculations, and select
appropriate budget methods in preparing a budget.......................................................................13
Task 4.......................................................................................................................................................16
4.1. Use appropriate accounting techniques to support decision-making, including pricing and
investment decisions. In so doing, you should analyses budgets, explain calculation of unit
costs, use selected investment appraisal techniques and identify the sources of finance
available to a business.......................................................................................................................16
Paraphrase This Document
Need a fresh take? Get an instant paraphrase of this document with our AI Paraphraser
Introduction
This assignment is based on the Everpia London which is one of the well reputed
companies in the London. The company is considering expanding the business. The
decisions making process by the managers of the company is based on evaluation of
different sources for the collection of the data.
TASK 1
1.1. Create a plan to collect primary and secondary data
The collection of the information and data is seen of the important responsibility for the
Evepia’s. There is differentness source are available to the company for collecting the
information and data but the main categories of the sources of the data are the primary
sources and the secondary sources.
Secondary data
The data which is collected from those resources including the data collected by other
researchers during the research is called secondary data. In the context of the Everpia
the secondary data is collected in the following way:
The data regarding the location of the Everpia is collected on the basic of geographical
location of each province. 50km could be localize by the company Lupton and then in
the Atlas Geography of London or searching on Google.
The data and information regarding the evaluation of the suitable place for the
construction is collected considering the area of each province.
DPI website of every province is use for collecting the information a data regarding t
identification of province which have big concentration of small and medium textile
companies and the province which have more stringer and attractive economic position
in contrast to other provinces.
The criteria provided by the Everpia could be evaluated by the first two criteria with the
help of eth secondary data collected above by selecting three different cities.
Primary data
The primary data will be collected by selecting the operating textile companies in very
province and the main purpose of the collection of the data through the primary source
is to evaluate the behavior and the production capacity of the company (Bpp, 2004, p7).
Primary source of the information is those resources which are carrying out by the
researcher from the start and the information collected by the primary source is new.
The primary source which could be use includes the surveys and interviews.
1.2. Choose appropriate survey methods, sampling techniques and
questionnaires
Sampling frame is the list of companies operating in the selected cities. The sample
iselction is the next in the process and the sample is selected based on the behavior
and the production capacity. The research will be carry out by selecting one company
as sample and the sampling technique is use by the management to select some
companies form the available list of the companies in the industry. Stratified method is
considering as suitable method which will be use in the research.
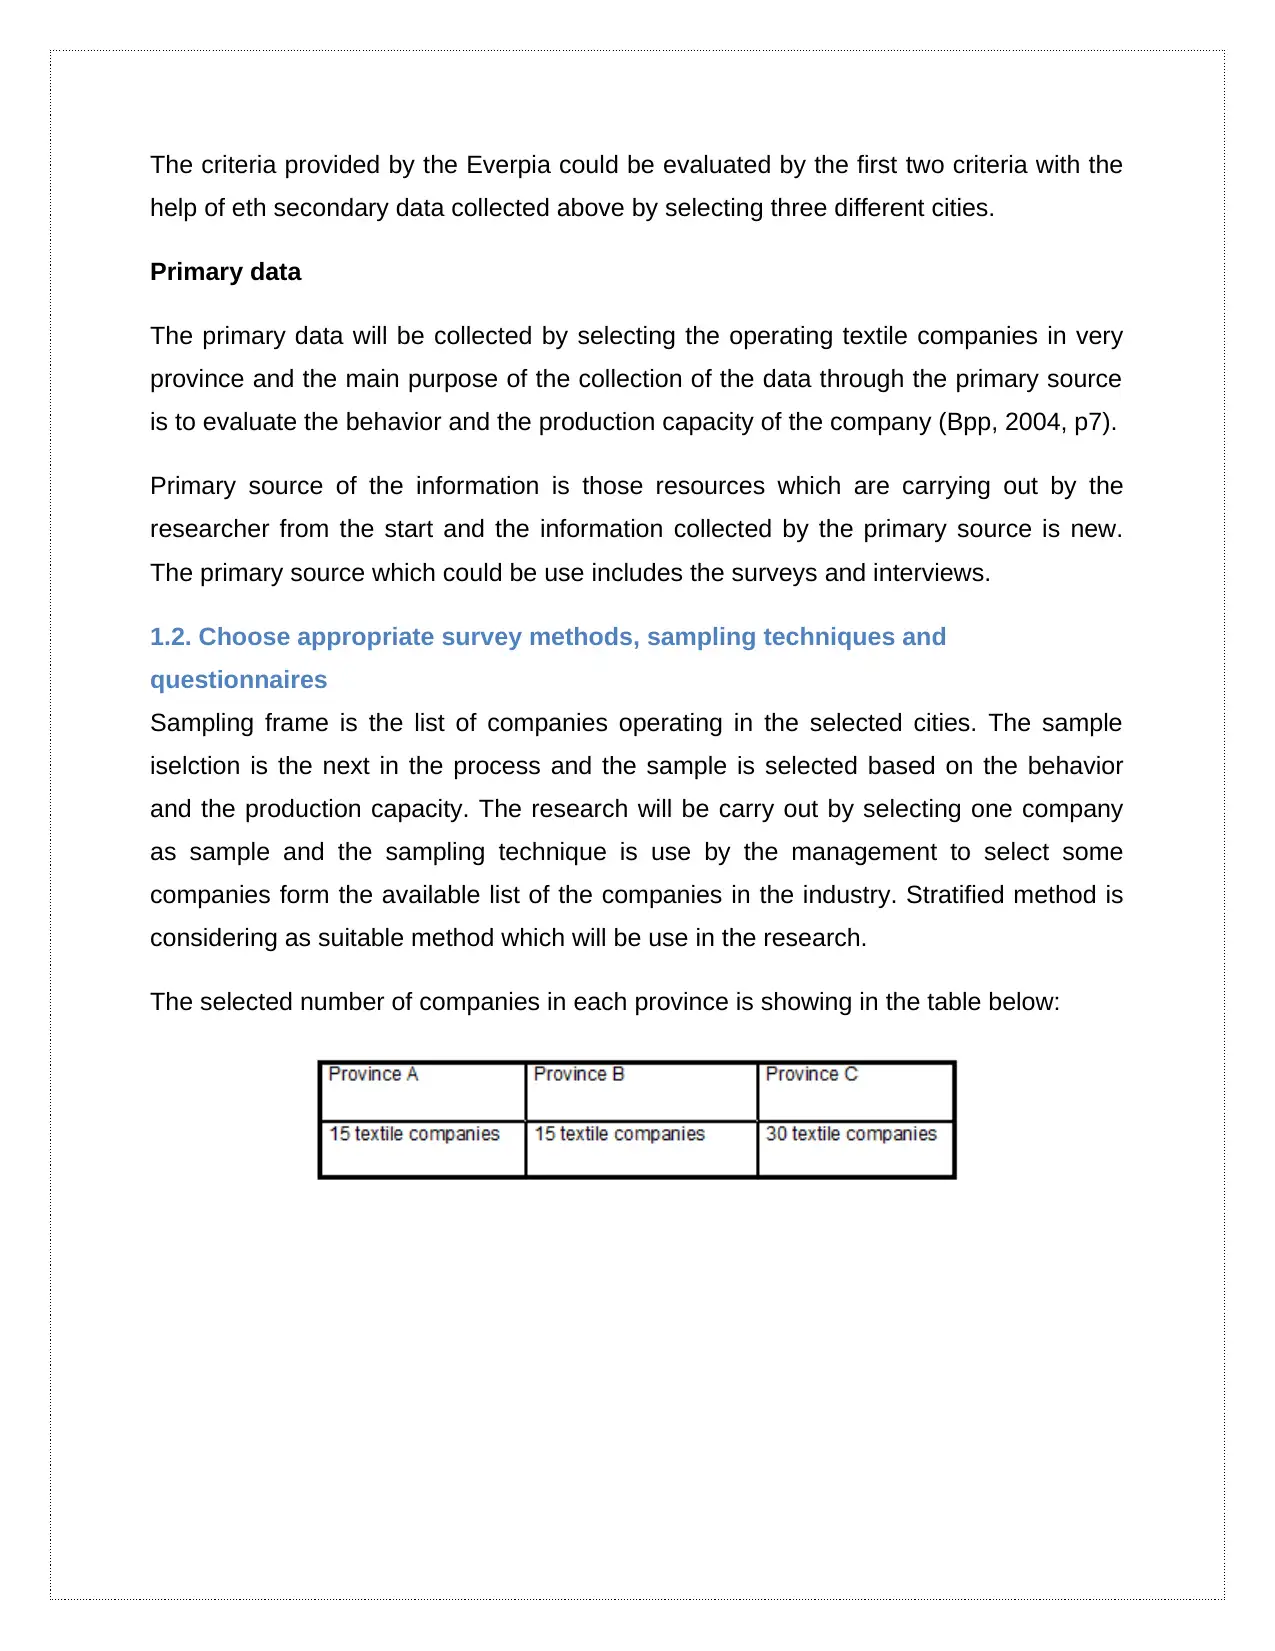
The selected number of companies in each province is showing in the table below:
help of eth secondary data collected above by selecting three different cities.
Primary data
The primary data will be collected by selecting the operating textile companies in very
province and the main purpose of the collection of the data through the primary source
is to evaluate the behavior and the production capacity of the company (Bpp, 2004, p7).
Primary source of the information is those resources which are carrying out by the
researcher from the start and the information collected by the primary source is new.
The primary source which could be use includes the surveys and interviews.
1.2. Choose appropriate survey methods, sampling techniques and
questionnaires
Sampling frame is the list of companies operating in the selected cities. The sample
iselction is the next in the process and the sample is selected based on the behavior
and the production capacity. The research will be carry out by selecting one company
as sample and the sampling technique is use by the management to select some
companies form the available list of the companies in the industry. Stratified method is
considering as suitable method which will be use in the research.
The selected number of companies in each province is showing in the table below:
⊘ This is a preview!⊘
Do you want full access?
Subscribe today to unlock all pages.
Trusted by 1+ million students worldwide
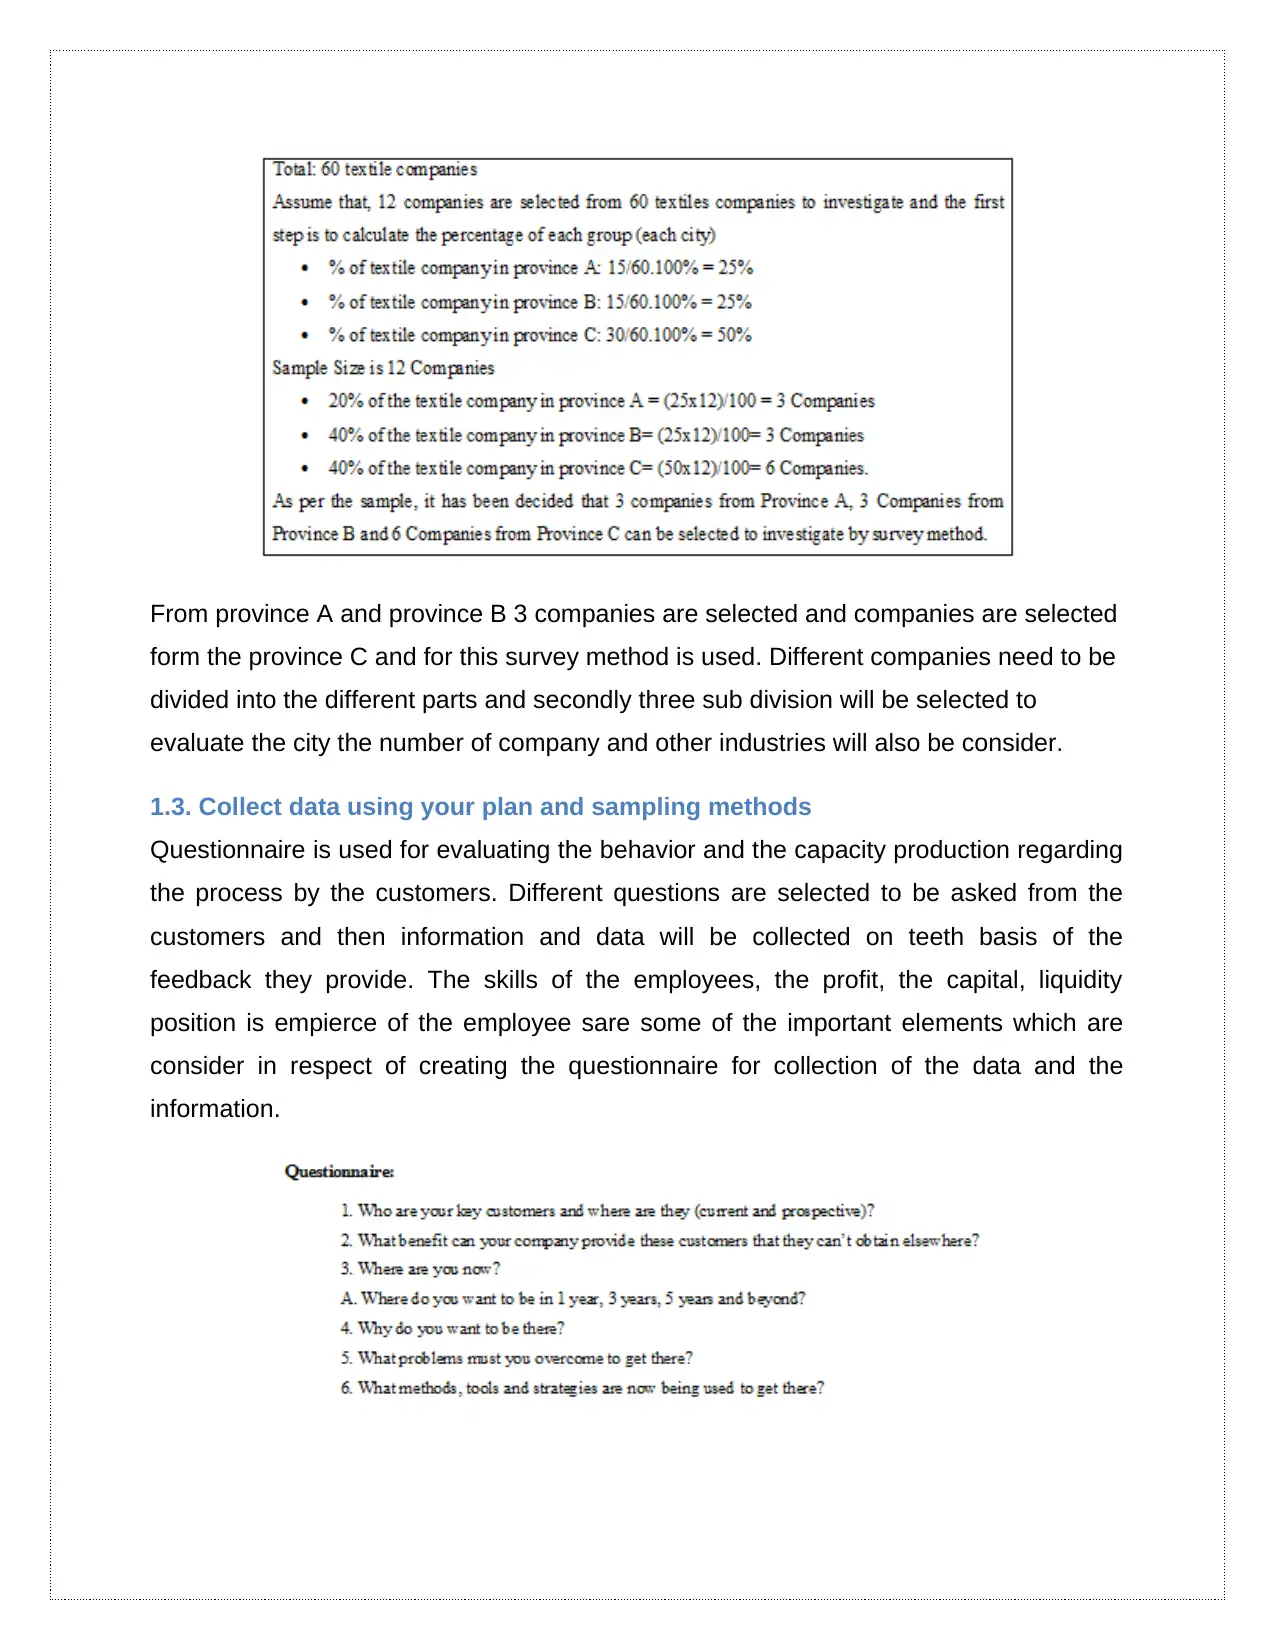
From province A and province B 3 companies are selected and companies are selected
form the province C and for this survey method is used. Different companies need to be
divided into the different parts and secondly three sub division will be selected to
evaluate the city the number of company and other industries will also be consider.
1.3. Collect data using your plan and sampling methods
Questionnaire is used for evaluating the behavior and the capacity production regarding
the process by the customers. Different questions are selected to be asked from the
customers and then information and data will be collected on teeth basis of the
feedback they provide. The skills of the employees, the profit, the capital, liquidity
position is empierce of the employee sare some of the important elements which are
consider in respect of creating the questionnaire for collection of the data and the
information.
Paraphrase This Document
Need a fresh take? Get an instant paraphrase of this document with our AI Paraphraser
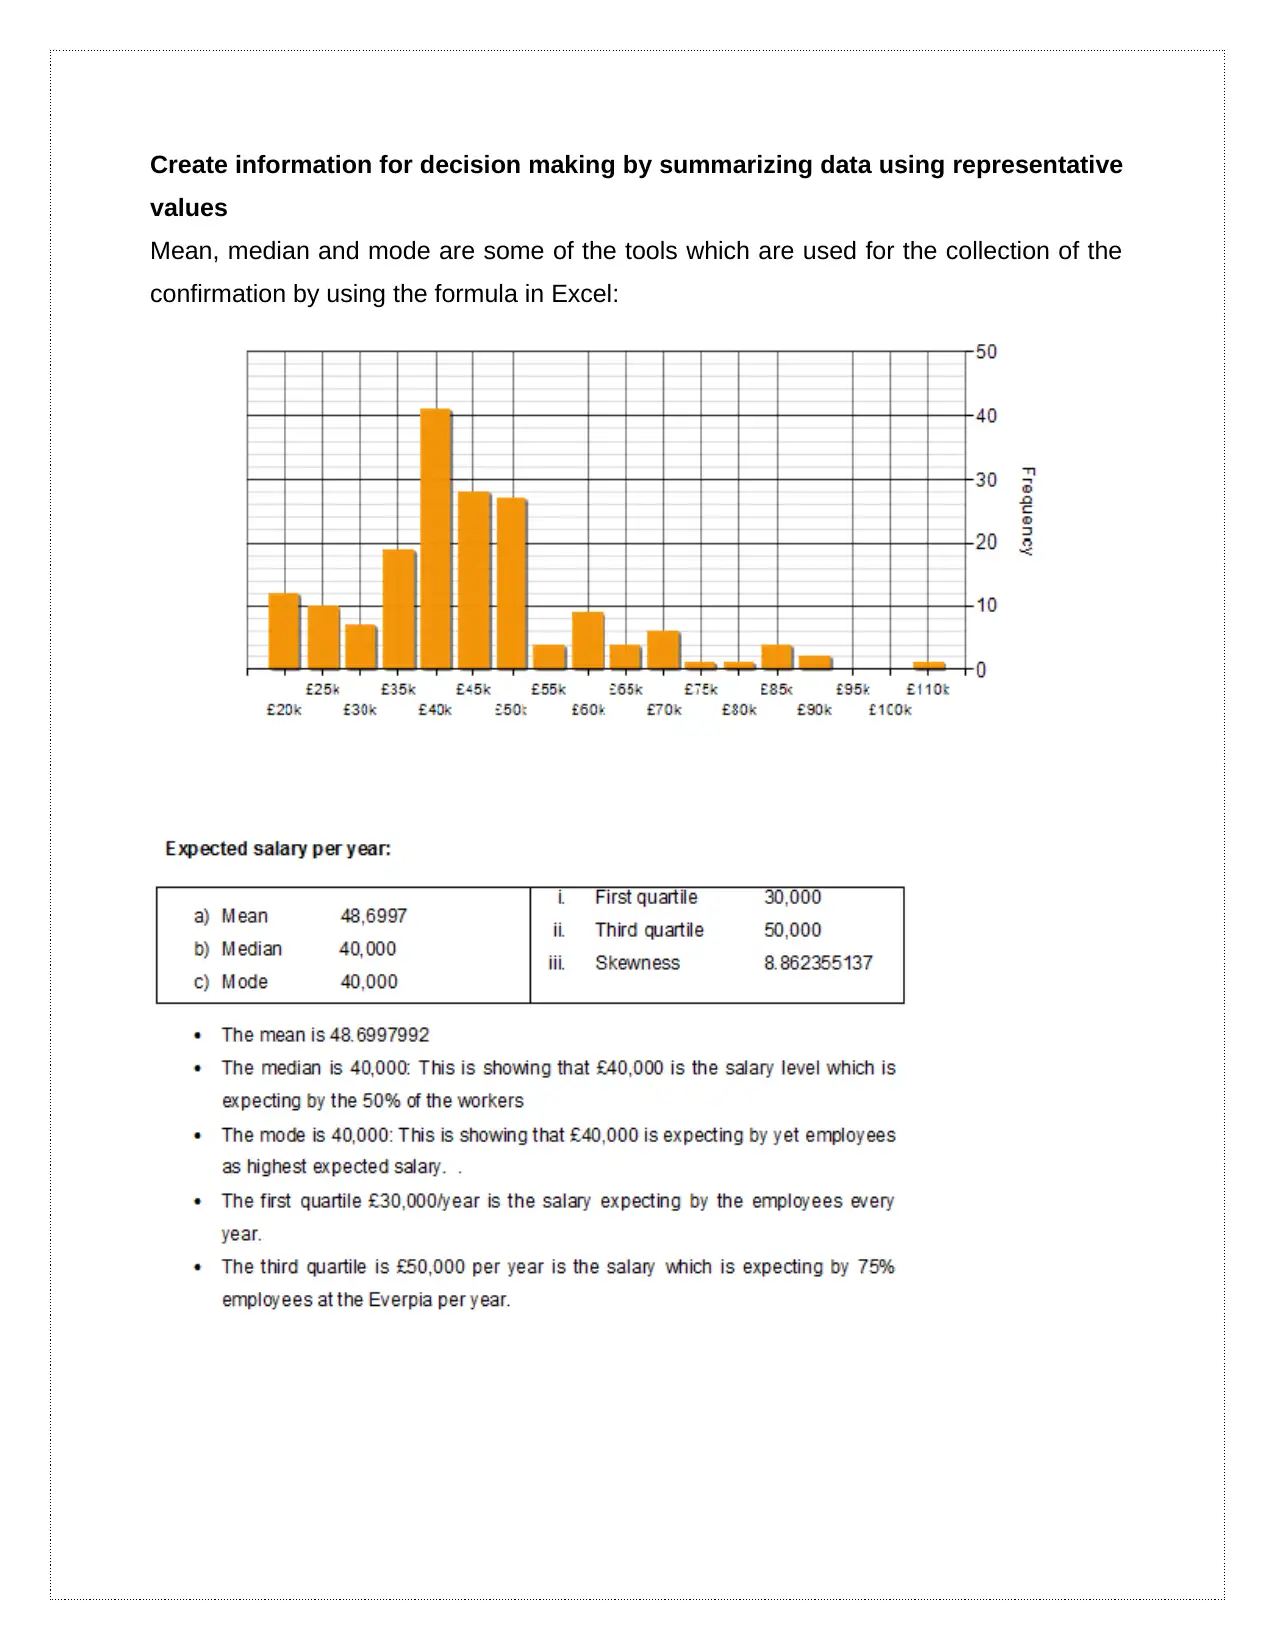
Create information for decision making by summarizing data using representative
values
Mean, median and mode are some of the tools which are used for the collection of the
confirmation by using the formula in Excel:
values
Mean, median and mode are some of the tools which are used for the collection of the
confirmation by using the formula in Excel:
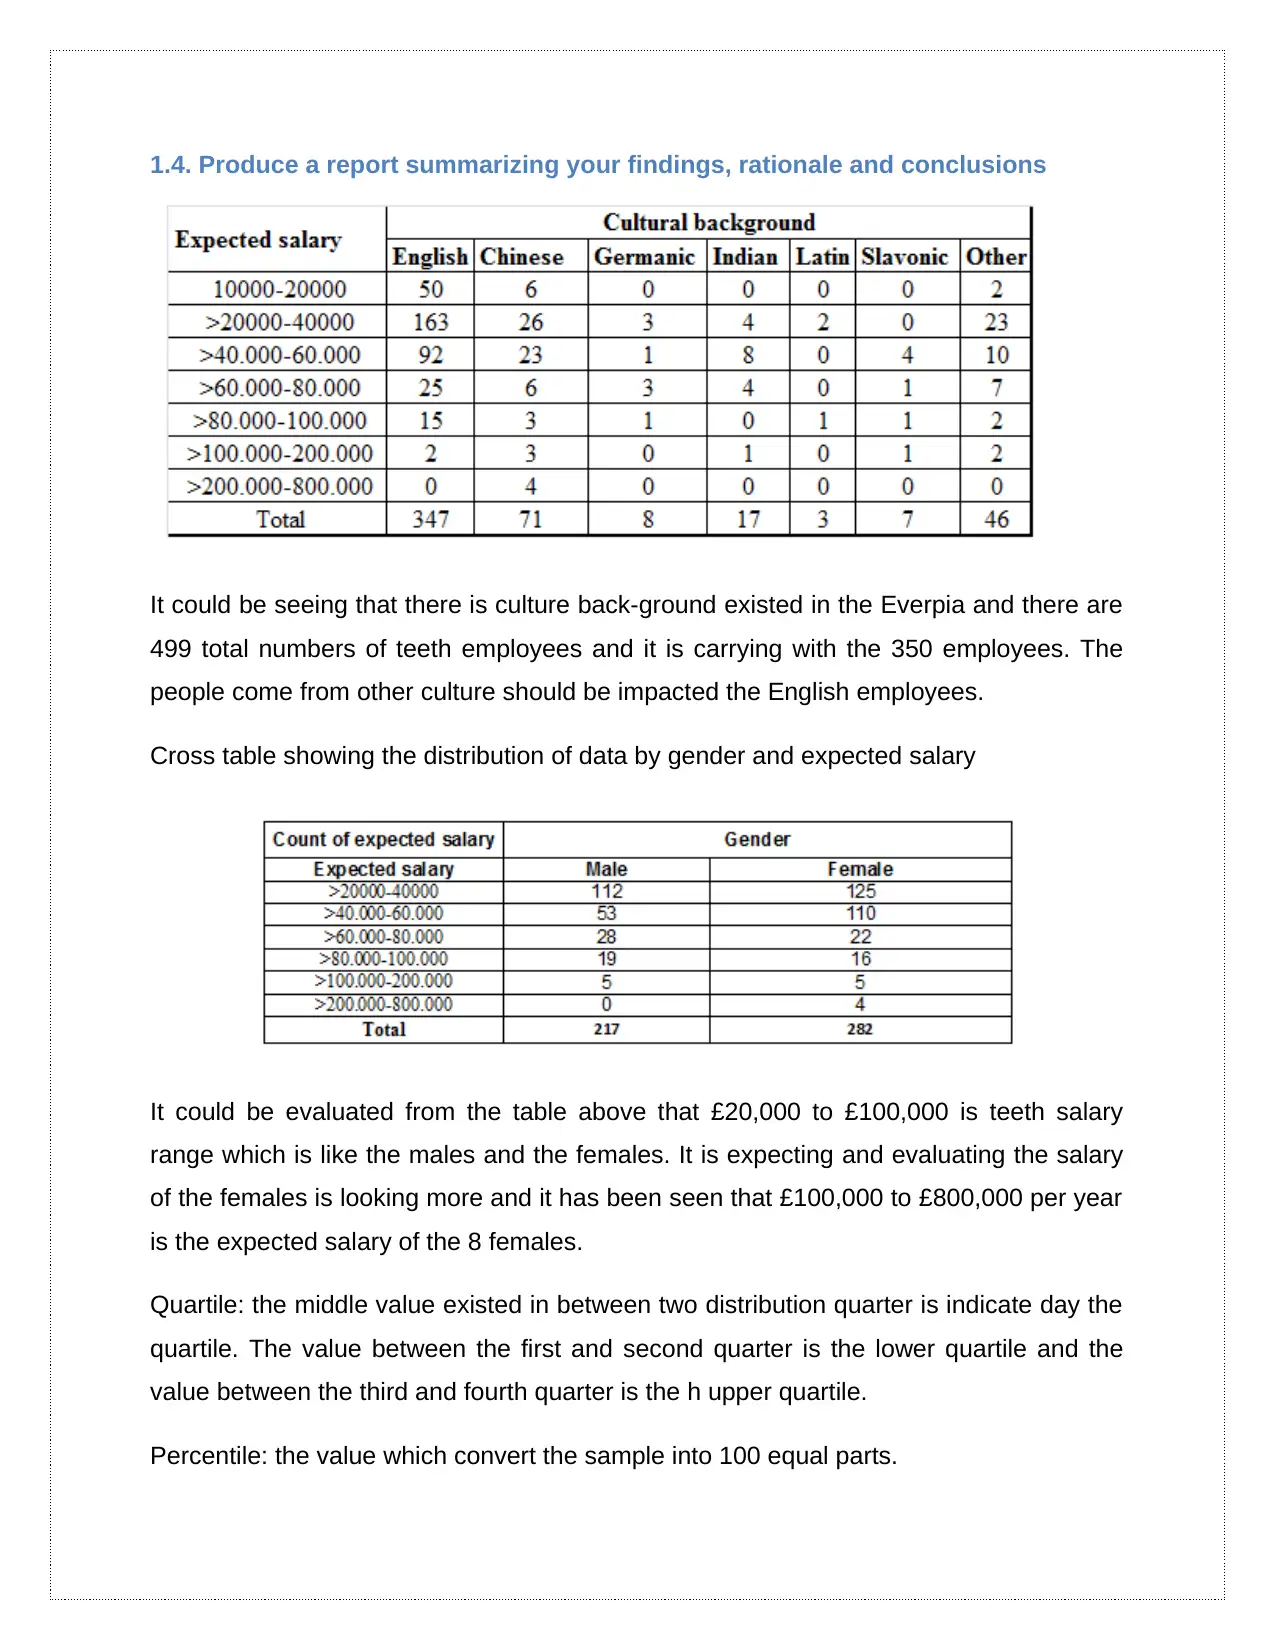
1.4. Produce a report summarizing your findings, rationale and conclusions
It could be seeing that there is culture back-ground existed in the Everpia and there are
499 total numbers of teeth employees and it is carrying with the 350 employees. The
people come from other culture should be impacted the English employees.
Cross table showing the distribution of data by gender and expected salary
It could be evaluated from the table above that £20,000 to £100,000 is teeth salary
range which is like the males and the females. It is expecting and evaluating the salary
of the females is looking more and it has been seen that £100,000 to £800,000 per year
is the expected salary of the 8 females.
Quartile: the middle value existed in between two distribution quarter is indicate day the
quartile. The value between the first and second quarter is the lower quartile and the
value between the third and fourth quarter is the h upper quartile.
Percentile: the value which convert the sample into 100 equal parts.
⊘ This is a preview!⊘
Do you want full access?
Subscribe today to unlock all pages.
Trusted by 1+ million students worldwide
Coefficient: the way of measuring the mean by measuring the set of data and it is called
as the coefficient of variation (Easton and McColl, 2010).
Task 2
2.1: Explain the main financial statements.
Financial statement is the statement by which the information about the company’s
assets, liabilities and equity are shown. The financial statements of the company include
different statement. The basic functions of the preparation of the financial statement are
to provide all the information to teeth stakeholders of the company.
Four Types of Financial Statements
Following are the important statements which fall under the financial statements of the
company:
1. Statement of Financial Position
The financial position is a statement which shows the financial stability and financial
situation of the company and it is also called as the balance sheet statement of the
company. The statement of financial position includes the following important elements:
Company’s total assets held by the company during the year. This portion includes
both the current and non-current assets of the company
The liabilities which teeth company must pay during the year and it also includes the
current and non-current liabilities
The equity position of the statement of financial position shows the capital and
reserves of the company and this portion shows that what the company owes to the
investors of the company.
2. Income Statement
Paraphrase This Document
Need a fresh take? Get an instant paraphrase of this document with our AI Paraphraser
The income statement which is also called as the statement of profit and loss shows
overall profitability which the company have generated during the year. This statement
of the occupancy includes the following elements:
The income which is based on the revenue and sale generated by the company
All the expanses which have incurred in the company for generating the revenue of
the company
3. Cash Flow Statement
The statement of the company which show the level of cash in and out during the
financial year and movement of the cash during the year in this cash flow statement is
shows on the flowing of following their segments:
Cash inflow our outflow form the operation is shows in the operating activities position
of the cash flow statement
All the cash generated and incurred by the investing activities is shows thin the
investing activities portion of the cash flow statement
The cash inflow and outflow because of the finical activities is shown in the segment
of the financial activities in the cash flow statement.
4. Statement of Changes in Equity
The statement of retained earnings also called as the statement of changes in equity
shows the equity movements during the year. The statement of the changes in equity
includes the following elements.
The income statement reported net profit or loss during the year
The issued or rapid share capital during the year
Payment by dividend
Equity directed gain or loss
The effects of the correction of accounting error or change in accounting policy
2.2. Comparison of different formats of financial statements and their
appropriateness for different types of business
The finical statements o the company shows the company’s financial activities which the
management carry out during the financial year. As there are different stakeholders of
the company so all the stakeholders of the company need form of the information about
the company so the preparation of the financial statements by the management is
require. It is very important for the management to prepare the financial statements of
the company based on accurate and reliable information. There are certain international
accountings standards which must end follow by the management for preparation of the
financial statements.
Financial Statements by Information Type
the part and the statement of the financial statements of the company which shows the
information about the assets, liabilities and equity of the company is known as the
statement of financial apposition. This statement of the company indicates the real
assets which the company has and obligations or payments which the company must
pay during the financial year. Another statement is the income statement by which the
management of the company shows that how much teeth profit has been generated by
the company and what is the real figure of the expenses concurred in generation of the
revenue. The information regarding the cash and level of cash incurred and earned by
the company in the cash flow statement.
Financial Statements by GAAP Type
The management of company has the responsibility to prepare the financial statement
of the company on the basis of the collected information d the business transactions
occurred in the company during the year. the finical statement prepares by the
management is called as the internal financial statement and its I get fact the quality of
the financial statement prepares by the management is consider as low so this is the
reason that eh stakehdeolsr do not prefer on the fiinacial statement prepare by the
management as accurate. By keeping in mind the needs and demands of the
⊘ This is a preview!⊘
Do you want full access?
Subscribe today to unlock all pages.
Trusted by 1+ million students worldwide
stakeholders. The CPA (Certified Public Accountant) is a professional body which have
provided the framework for the preparation of the financial statement which is follow by
the management than the stakehdeolsr can rely on the financial statement prepare by
the management. It has been evaluated that eh stakeholders of the company more rely
on the audited financial statement so this is the reason that the audit is one of the
important aspect regarding the financial statement accuracy and credibility (Anthony,
2012).
Ratios Analysis
Profitability
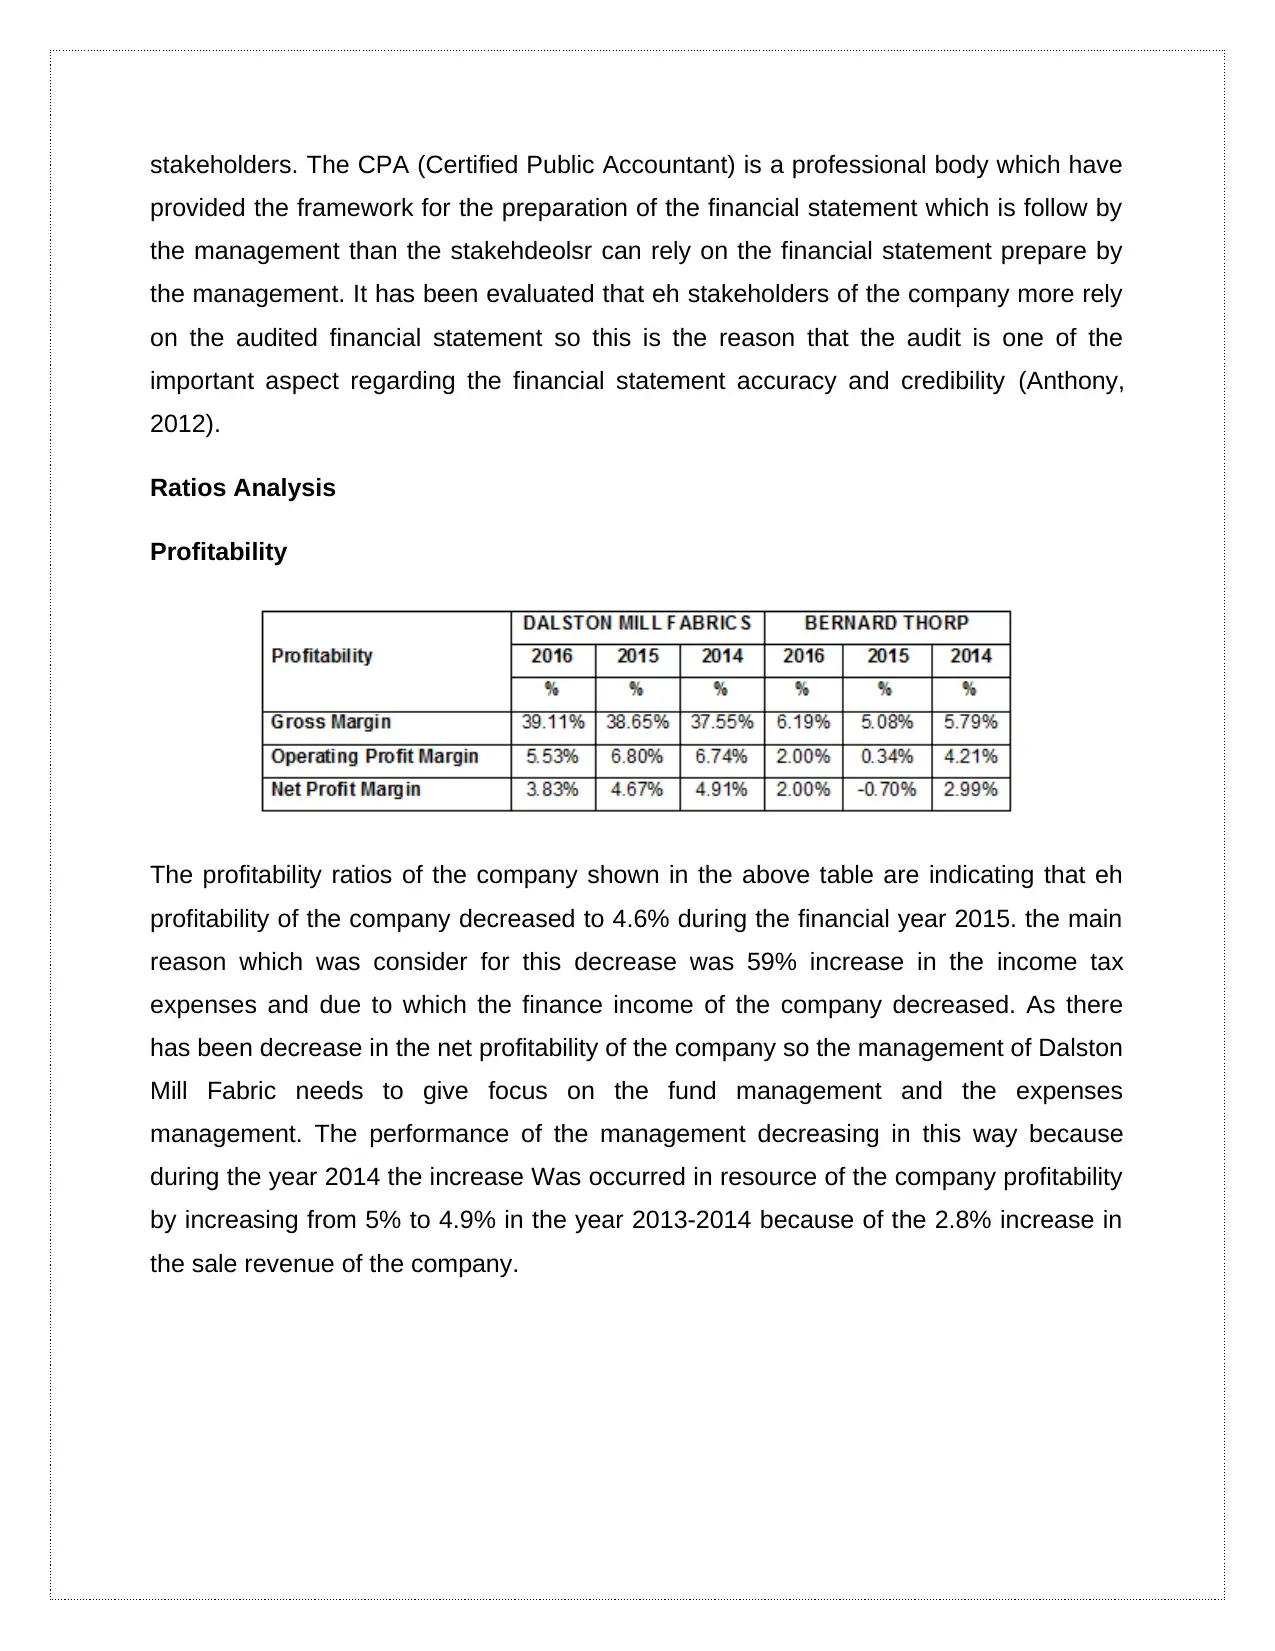
The profitability ratios of the company shown in the above table are indicating that eh
profitability of the company decreased to 4.6% during the financial year 2015. the main
reason which was consider for this decrease was 59% increase in the income tax
expenses and due to which the finance income of the company decreased. As there
has been decrease in the net profitability of the company so the management of Dalston
Mill Fabric needs to give focus on the fund management and the expenses
management. The performance of the management decreasing in this way because
during the year 2014 the increase Was occurred in resource of the company profitability
by increasing from 5% to 4.9% in the year 2013-2014 because of the 2.8% increase in
the sale revenue of the company.
provided the framework for the preparation of the financial statement which is follow by
the management than the stakehdeolsr can rely on the financial statement prepare by
the management. It has been evaluated that eh stakeholders of the company more rely
on the audited financial statement so this is the reason that the audit is one of the
important aspect regarding the financial statement accuracy and credibility (Anthony,
2012).
Ratios Analysis
Profitability
The profitability ratios of the company shown in the above table are indicating that eh
profitability of the company decreased to 4.6% during the financial year 2015. the main
reason which was consider for this decrease was 59% increase in the income tax
expenses and due to which the finance income of the company decreased. As there
has been decrease in the net profitability of the company so the management of Dalston
Mill Fabric needs to give focus on the fund management and the expenses
management. The performance of the management decreasing in this way because
during the year 2014 the increase Was occurred in resource of the company profitability
by increasing from 5% to 4.9% in the year 2013-2014 because of the 2.8% increase in
the sale revenue of the company.
Paraphrase This Document
Need a fresh take? Get an instant paraphrase of this document with our AI Paraphraser
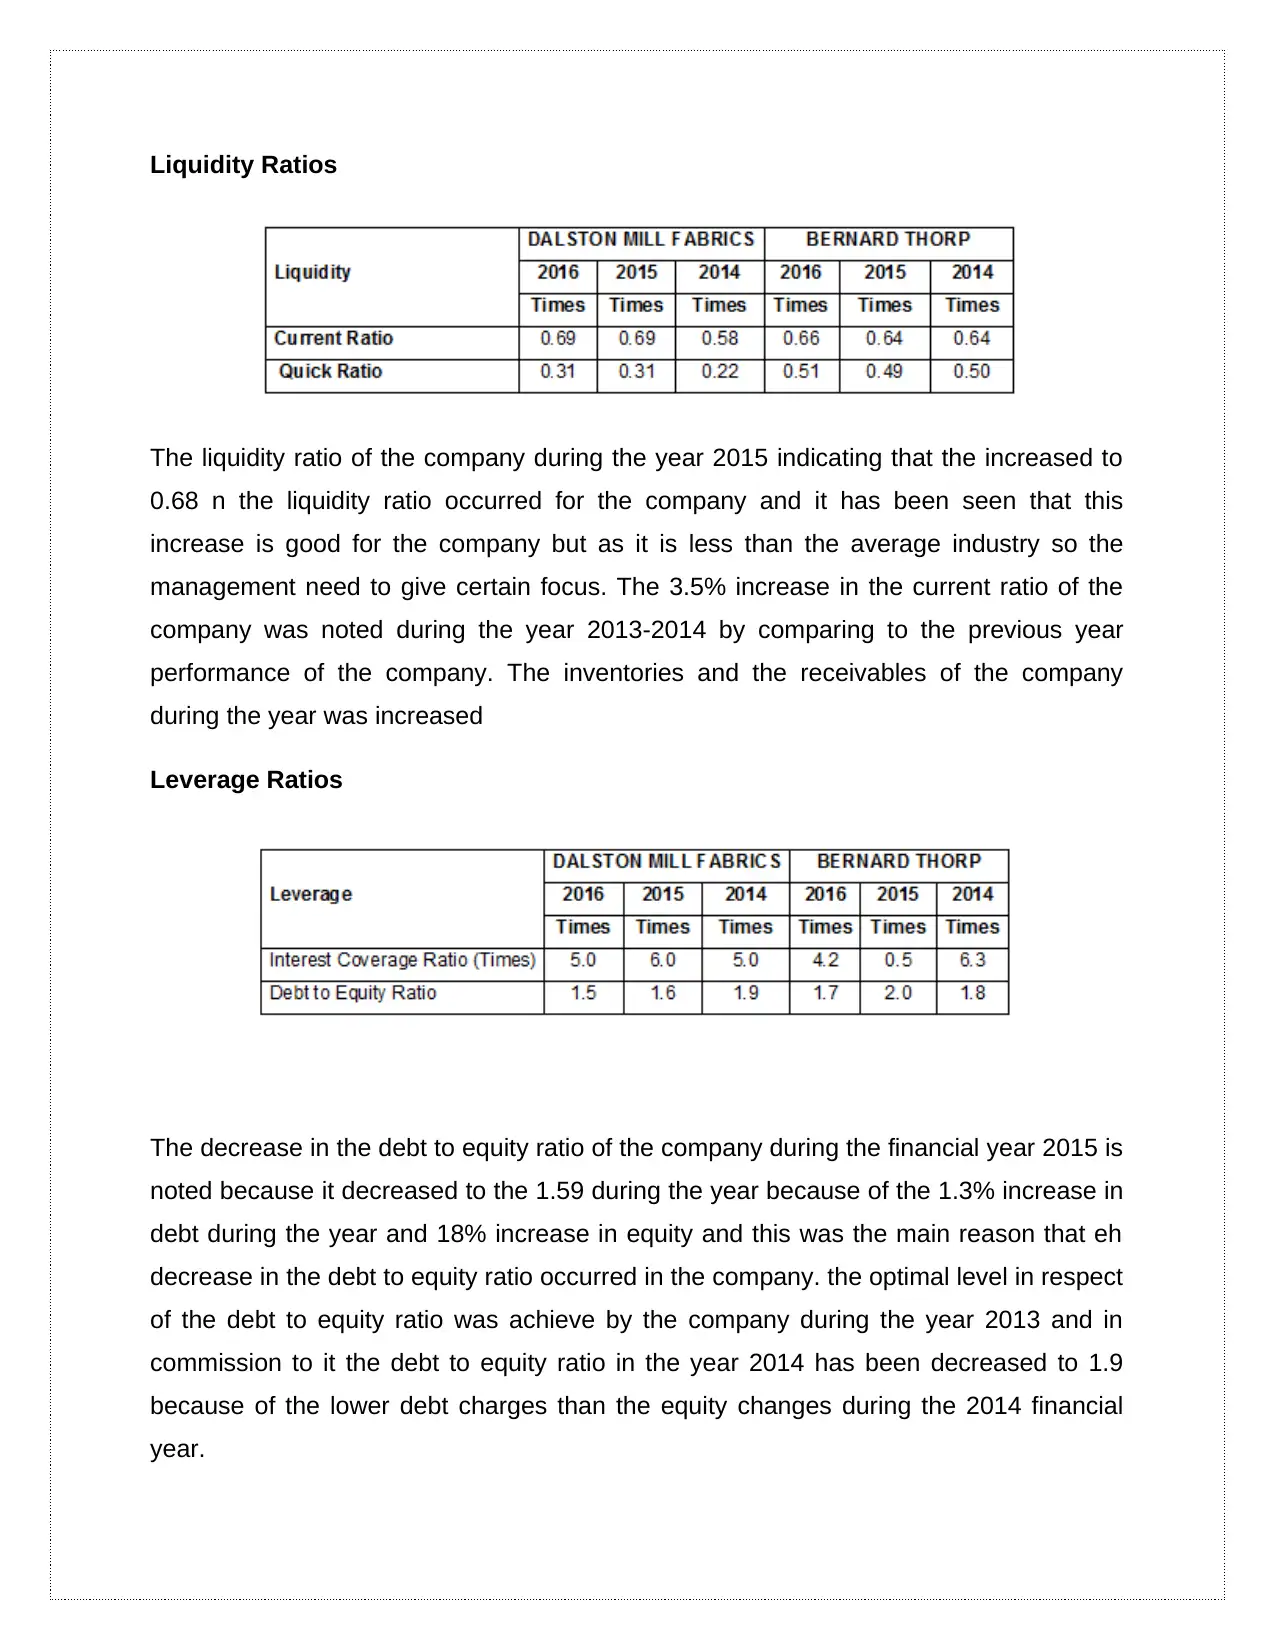
Liquidity Ratios
The liquidity ratio of the company during the year 2015 indicating that the increased to
0.68 n the liquidity ratio occurred for the company and it has been seen that this
increase is good for the company but as it is less than the average industry so the
management need to give certain focus. The 3.5% increase in the current ratio of the
company was noted during the year 2013-2014 by comparing to the previous year
performance of the company. The inventories and the receivables of the company
during the year was increased
Leverage Ratios
The decrease in the debt to equity ratio of the company during the financial year 2015 is
noted because it decreased to the 1.59 during the year because of the 1.3% increase in
debt during the year and 18% increase in equity and this was the main reason that eh
decrease in the debt to equity ratio occurred in the company. the optimal level in respect
of the debt to equity ratio was achieve by the company during the year 2013 and in
commission to it the debt to equity ratio in the year 2014 has been decreased to 1.9
because of the lower debt charges than the equity changes during the 2014 financial
year.
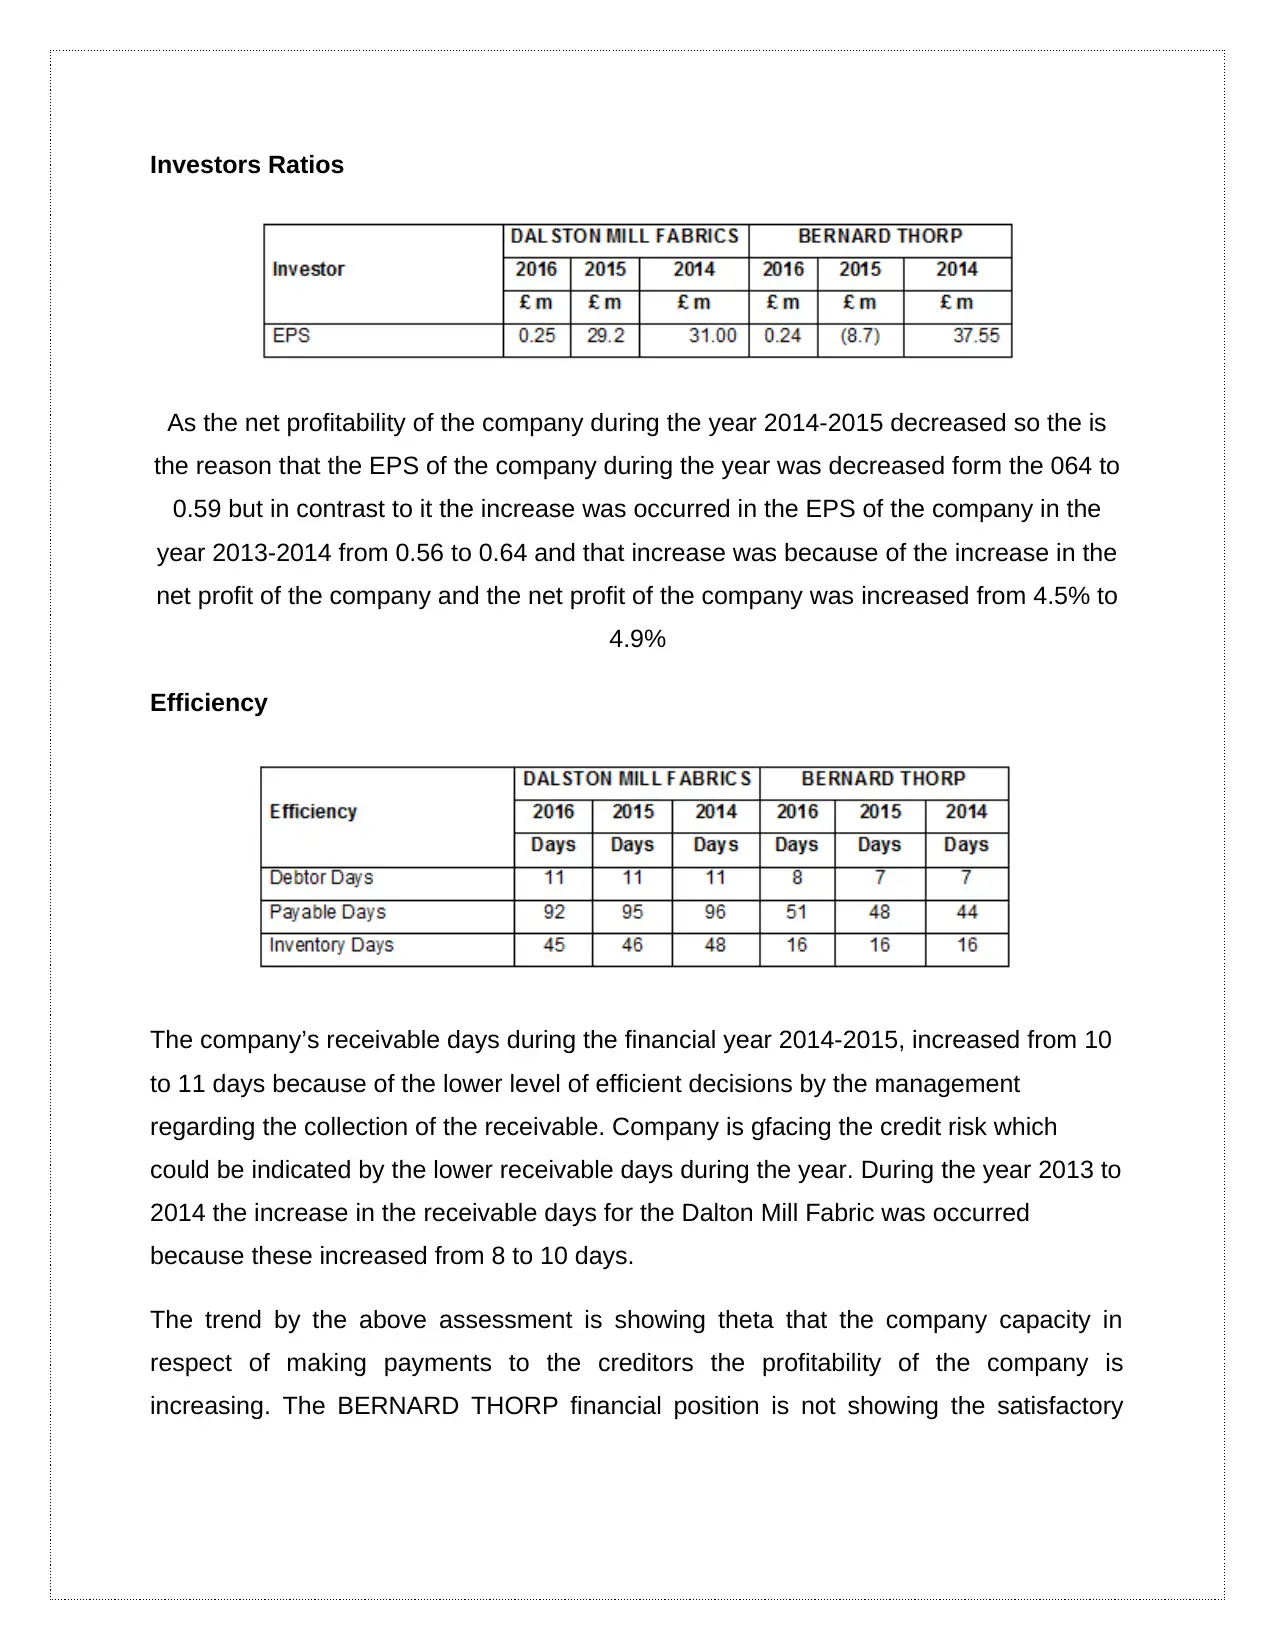
Investors Ratios
As the net profitability of the company during the year 2014-2015 decreased so the is
the reason that the EPS of the company during the year was decreased form the 064 to
0.59 but in contrast to it the increase was occurred in the EPS of the company in the
year 2013-2014 from 0.56 to 0.64 and that increase was because of the increase in the
net profit of the company and the net profit of the company was increased from 4.5% to
4.9%
Efficiency
The company’s receivable days during the financial year 2014-2015, increased from 10
to 11 days because of the lower level of efficient decisions by the management
regarding the collection of the receivable. Company is gfacing the credit risk which
could be indicated by the lower receivable days during the year. During the year 2013 to
2014 the increase in the receivable days for the Dalton Mill Fabric was occurred
because these increased from 8 to 10 days.
The trend by the above assessment is showing theta that the company capacity in
respect of making payments to the creditors the profitability of the company is
increasing. The BERNARD THORP financial position is not showing the satisfactory
⊘ This is a preview!⊘
Do you want full access?
Subscribe today to unlock all pages.
Trusted by 1+ million students worldwide
1 out of 17
Related Documents


Your All-in-One AI-Powered Toolkit for Academic Success.
+13062052269
info@desklib.com
Available 24*7 on WhatsApp / Email
![[object Object]](/_next/static/media/star-bottom.7253800d.svg)
Unlock your academic potential
Copyright © 2020–2026 A2Z Services. All Rights Reserved. Developed and managed by ZUCOL.