Eversendai Business Analysis: Financial Health and Strategic Planning
VerifiedAdded on 2020/07/22
|32
|4174
|61
Project
AI Summary
This project provides a comprehensive business analysis of Eversendai, a Malaysian construction company. The analysis begins with an introduction outlining the purpose, case study, and key issues, followed by a financial analysis that includes profitability, liquidity, leverage, and efficiency ratios. Strategic analysis incorporates Porter's Five Forces, an examination of new industry forces like digitalization, and an assessment of operations and organization. Key success factors are identified, and the use of a balance scorecard is proposed. The Ansoff matrix is applied to explore growth strategies, and limitations of financial models are discussed. The project concludes with recommendations, and includes scenario forecasting to assess potential outcomes. The report also includes the use of financial models and conventions to do a suitable analysis of the business.

Business Analysis Project
Paraphrase This Document
Need a fresh take? Get an instant paraphrase of this document with our AI Paraphraser
TABLE OF CONTENTS
1. INTRODUCTION ......................................................................................................................4
1.1 Purpose –................................................................................................................................4
1.2 Case analysis –.......................................................................................................................4
1.4 Key issues –...........................................................................................................................5
1.5 Rationale behind the selection of company -ok.....................................................................5
2.1 RATIO ANALYSIS ..................................................................................................................6
2.1.1 Profitability ratio analysis .................................................................................................6
2.1.2 Liquidity ratio analysis ......................................................................................................7
2.1.3 Financial health: leverage ratio ..........................................................................................8
2.1.4 Efficiency ratios..................................................................................................................9
Inventory turnover ratio (in days) ...............................................................................................9
3. STRATEGIC ANALYSIS ..........................................................................................................9
3.2.1 Porter Five Force Analysis ..............................................................................................11
3.2.2 New forces in construction industry................................................................................14
3.3 Operations and organisation analysis-.................................................................................14
3.4 Key success factors:.............................................................................................................14
Balance score card s...................................................................................................................15
5.2 Limitation of financial models in analysing the performance- ...........................................18
6.0 Conclusion ..........................................................................................................................19
7.0 Recommendation ...............................................................................................................19
8.0 Modelling.................................................................................................................................21
8.1 Scenarios Forecasting..........................................................................................................21
8.2 Scenario Description............................................................................................................22

8.3 Outcome...............................................................................................................................23
⊘ This is a preview!⊘
Do you want full access?
Subscribe today to unlock all pages.
Trusted by 1+ million students worldwide
1. INTRODUCTION
1.1 Purpose –
The main purpose behind carry out such study is to shed light on the financial health and
performance of Eversendai in against to the competitors like Muhibbah & Sunway. Besides this,
it will also provide deeper insight about the key issues and condition of external market. Further,
report will also depict about the manner in which financial models and conventions helps in
doing suitable analysis of business. It will also include the details about recommendation through
which Eversendai can attain success in the competitive business environment.
1.2 Case analysis –
Eversendai is one of the leading organizations that is operated in the construction
industry of Malaysia. Portfolio of the company includes wide range of services such as long span
and roof structure, high rise building, plant & construction, oil & gas etc (Eversendai Malaysia,
2017). Further, Eversendai has expertise in including innovation aspect in construction project
through including composting infrastructure.
1.3 Background of the organization -
Eversendai is one of the leading business organizations of Malaysia which is known for
turnkey projects, oil & gas upstream & downstream as well as infrastructure and composite
structures. Company has employed 15000 people and having attractive portfolio of more than
300 accomplished projects over 14 different countries of the world. With the motive to maximize
the level of productivity and profitability Eversendai makes focus on safety, quality and client
satisfaction to a great extent (Eversendai Malaysia, 2017).
Paraphrase This Document
Need a fresh take? Get an instant paraphrase of this document with our AI Paraphraser
1.4 Key issues –
To assess the issues and measure the level of competition following analysis has been
done:
Basis of difference Eversendai ( main
company)
Muhibbah (rival
firm)
Sunway group
Compliance with
safety
High Follow to the
moderate level
Moderate
Adherence to quality High Moderate Moderate
Focus The main focus of the
organization is to
meet the client’s
requirement to a great
extent.
It lays emphasis on
the maximization of
profitability.
Sunway group makes
focus on increasing
the level of profit
margin rather than
client’s satisfaction.
Table 1: Comparative Value Proposition
1.5 Rationale behind the selection of company -
The main reasons behind the selection of Eversendai are that it was operated in the
construction industry of Malaysia from several years. Besides this, company is recognized for
the quality and safe projects offered by it to the customers. Hence, by analyzing the financials of
latest accounting years scholar would become able to present the fair solution of issue.
2.0 FINANCIAL ANALYSIS
Financial analysis is known as the assessment of the stability, profitability and viability of
a business and sub business. It is performed by those who are using ratio which provide
information which is gather from the financial statement. It helps us in determining the purchase
material and making decision regarding investing of capital.
2.1 RATIO ANALYSIS
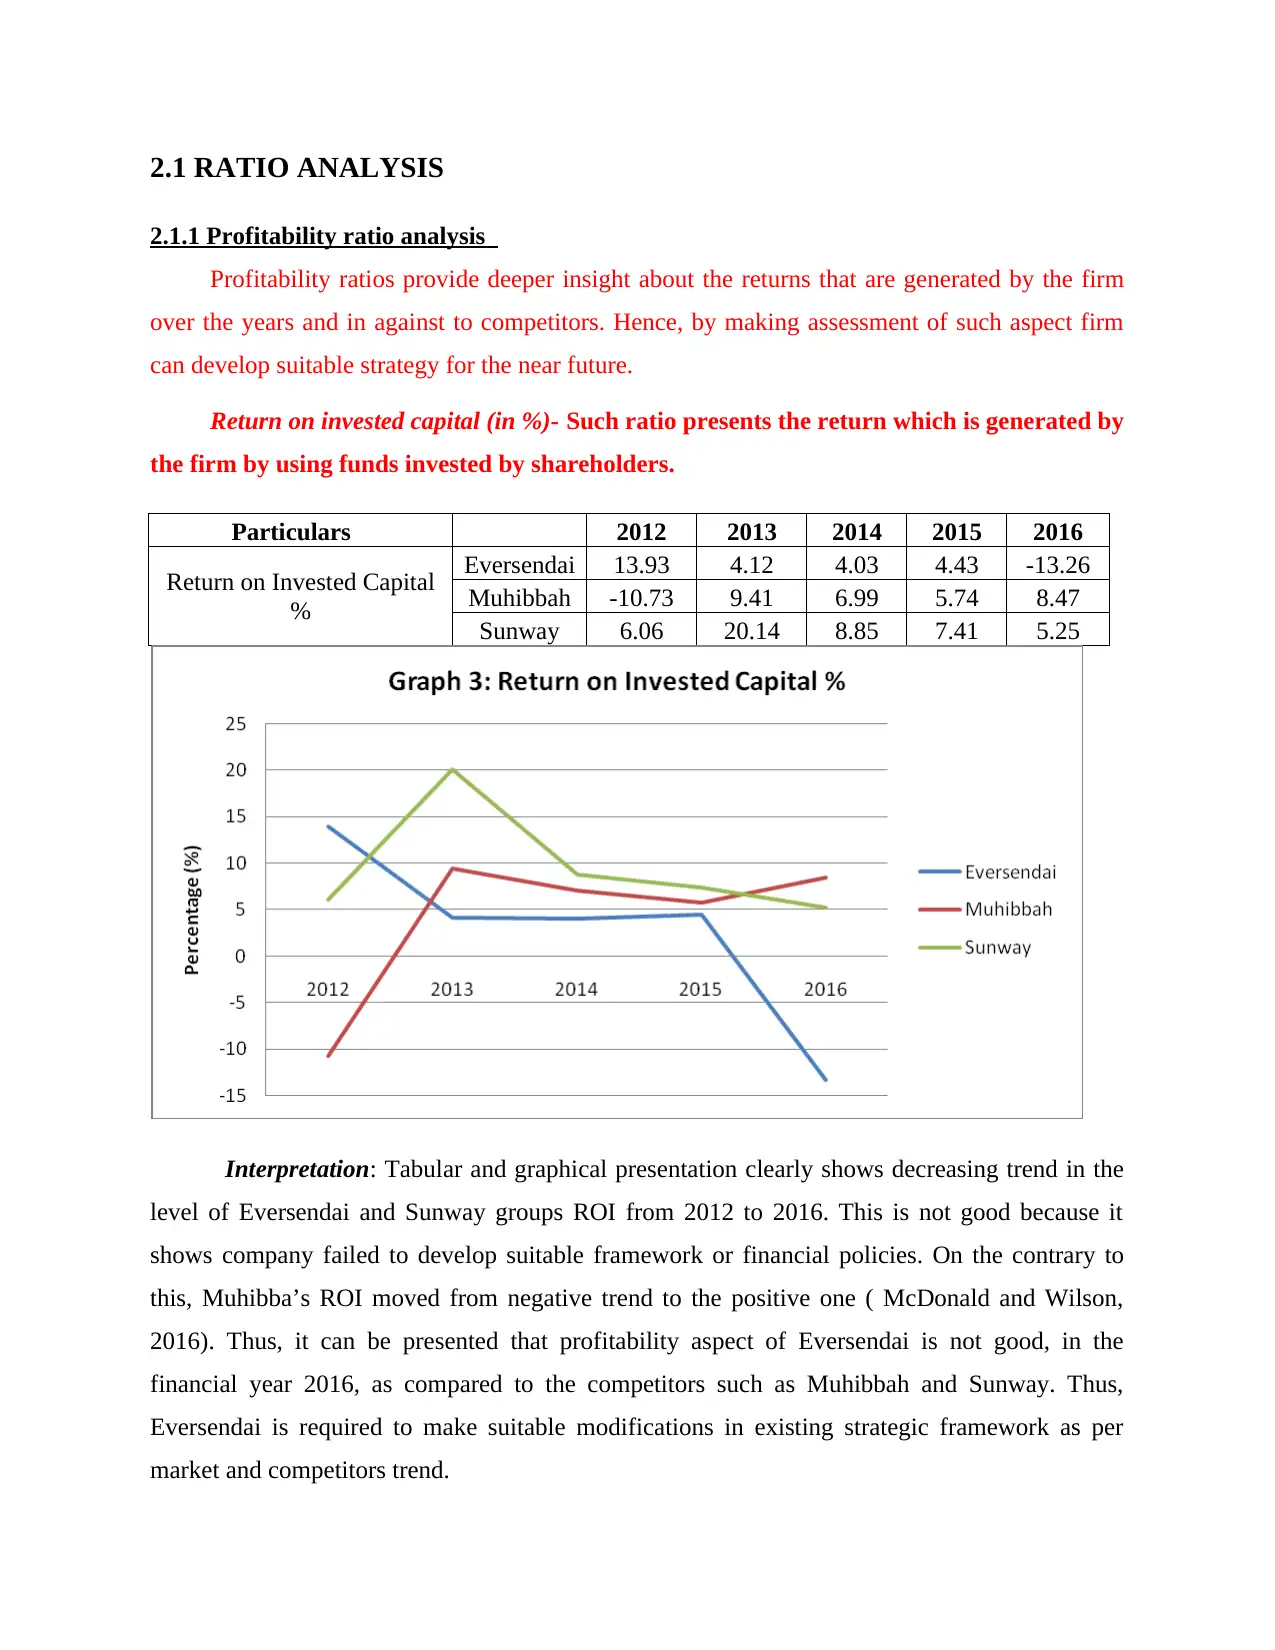
2.1.1 Profitability ratio analysis
Profitability ratios provide deeper insight about the returns that are generated by the firm
over the years and in against to competitors. Hence, by making assessment of such aspect firm
can develop suitable strategy for the near future.
Return on invested capital (in %)- Such ratio presents the return which is generated by
the firm by using funds invested by shareholders.
Particulars 2012 2013 2014 2015 2016
Return on Invested Capital
%
Eversendai 13.93 4.12 4.03 4.43 -13.26
Muhibbah -10.73 9.41 6.99 5.74 8.47
Sunway 6.06 20.14 8.85 7.41 5.25
Interpretation: Tabular and graphical presentation clearly shows decreasing trend in the
level of Eversendai and Sunway groups ROI from 2012 to 2016. This is not good because it
shows company failed to develop suitable framework or financial policies. On the contrary to
this, Muhibba’s ROI moved from negative trend to the positive one ( McDonald and Wilson,
2016). Thus, it can be presented that profitability aspect of Eversendai is not good, in the
financial year 2016, as compared to the competitors such as Muhibbah and Sunway. Thus,
Eversendai is required to make suitable modifications in existing strategic framework as per
market and competitors trend.
⊘ This is a preview!⊘
Do you want full access?
Subscribe today to unlock all pages.
Trusted by 1+ million students worldwide
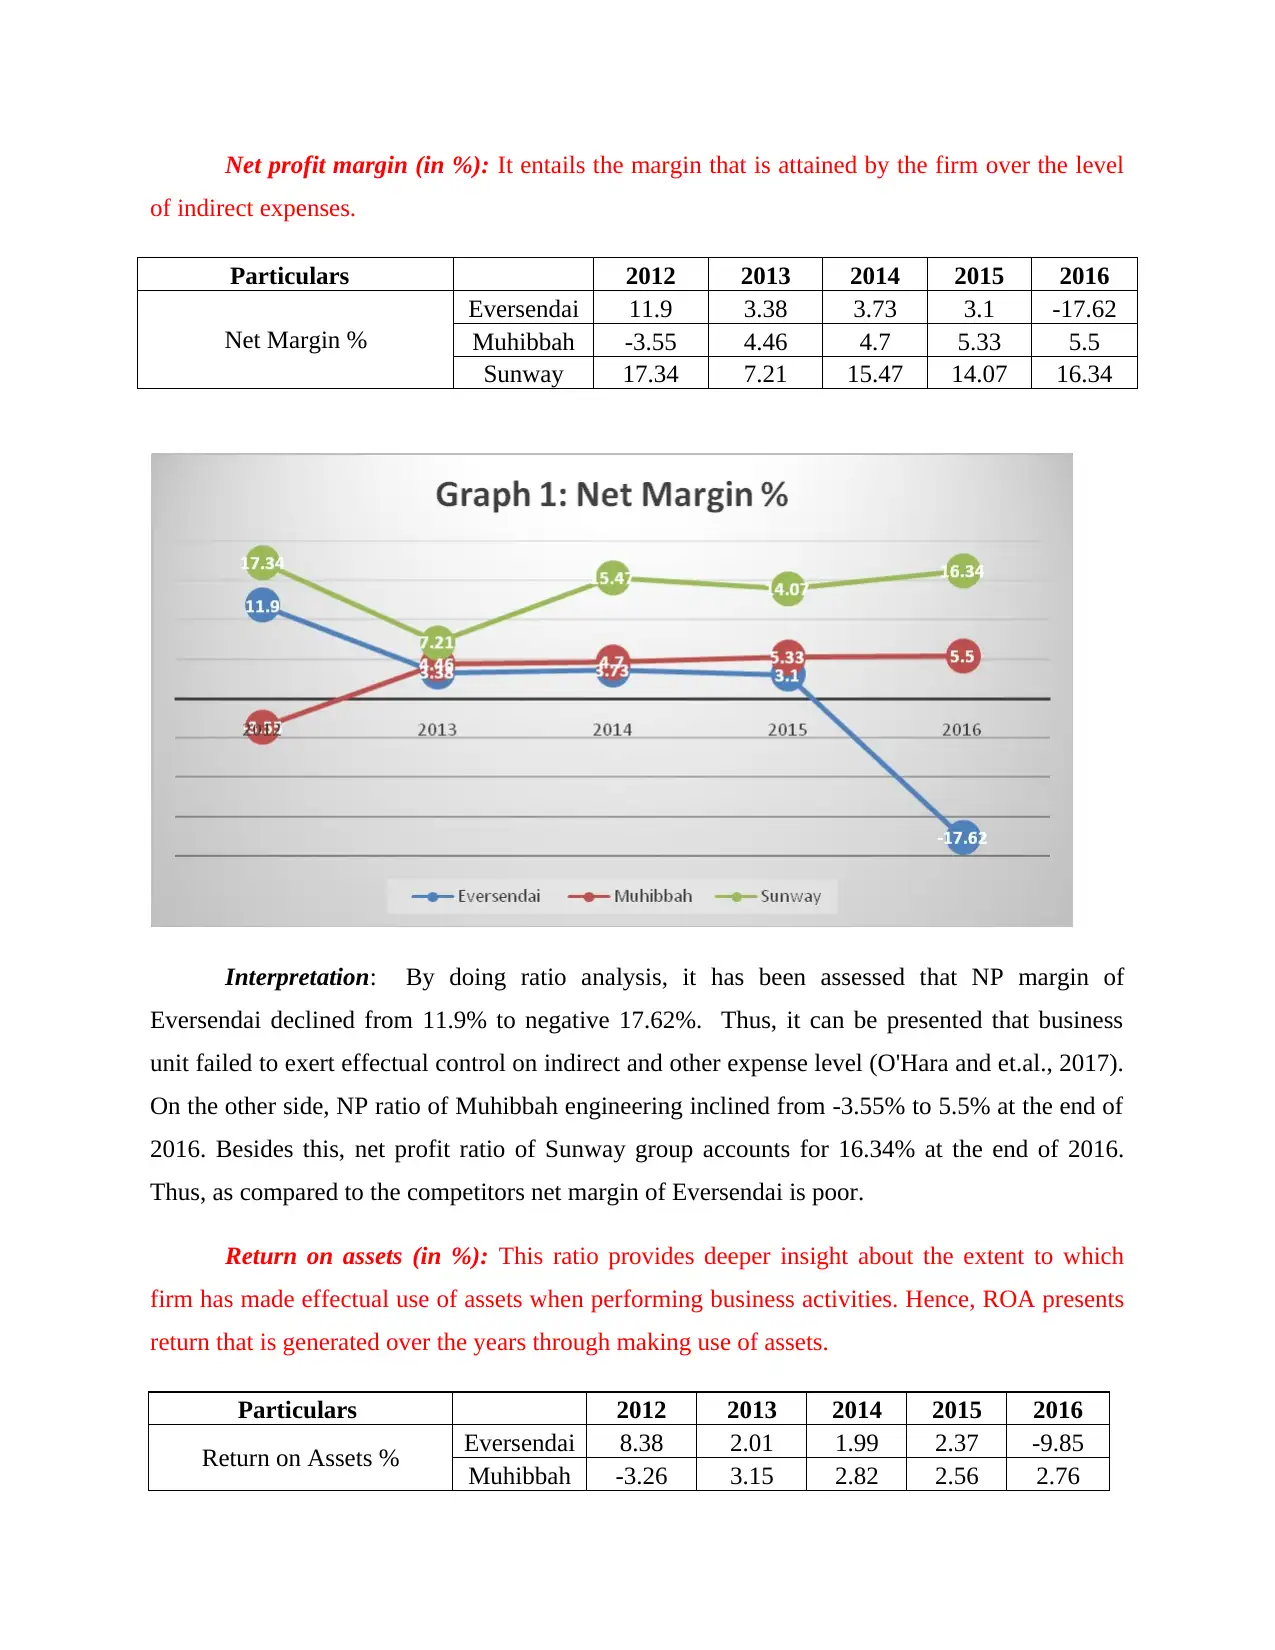
Net profit margin (in %): It entails the margin that is attained by the firm over the level
of indirect expenses.
Particulars 2012 2013 2014 2015 2016
Net Margin %
Eversendai 11.9 3.38 3.73 3.1 -17.62
Muhibbah -3.55 4.46 4.7 5.33 5.5
Sunway 17.34 7.21 15.47 14.07 16.34
Interpretation: By doing ratio analysis, it has been assessed that NP margin of
Eversendai declined from 11.9% to negative 17.62%. Thus, it can be presented that business
unit failed to exert effectual control on indirect and other expense level (O'Hara and et.al., 2017).
On the other side, NP ratio of Muhibbah engineering inclined from -3.55% to 5.5% at the end of
2016. Besides this, net profit ratio of Sunway group accounts for 16.34% at the end of 2016.
Thus, as compared to the competitors net margin of Eversendai is poor.
Return on assets (in %): This ratio provides deeper insight about the extent to which
firm has made effectual use of assets when performing business activities. Hence, ROA presents
return that is generated over the years through making use of assets.
Particulars 2012 2013 2014 2015 2016
Return on Assets % Eversendai 8.38 2.01 1.99 2.37 -9.85
Muhibbah -3.26 3.15 2.82 2.56 2.76
Paraphrase This Document
Need a fresh take? Get an instant paraphrase of this document with our AI Paraphraser
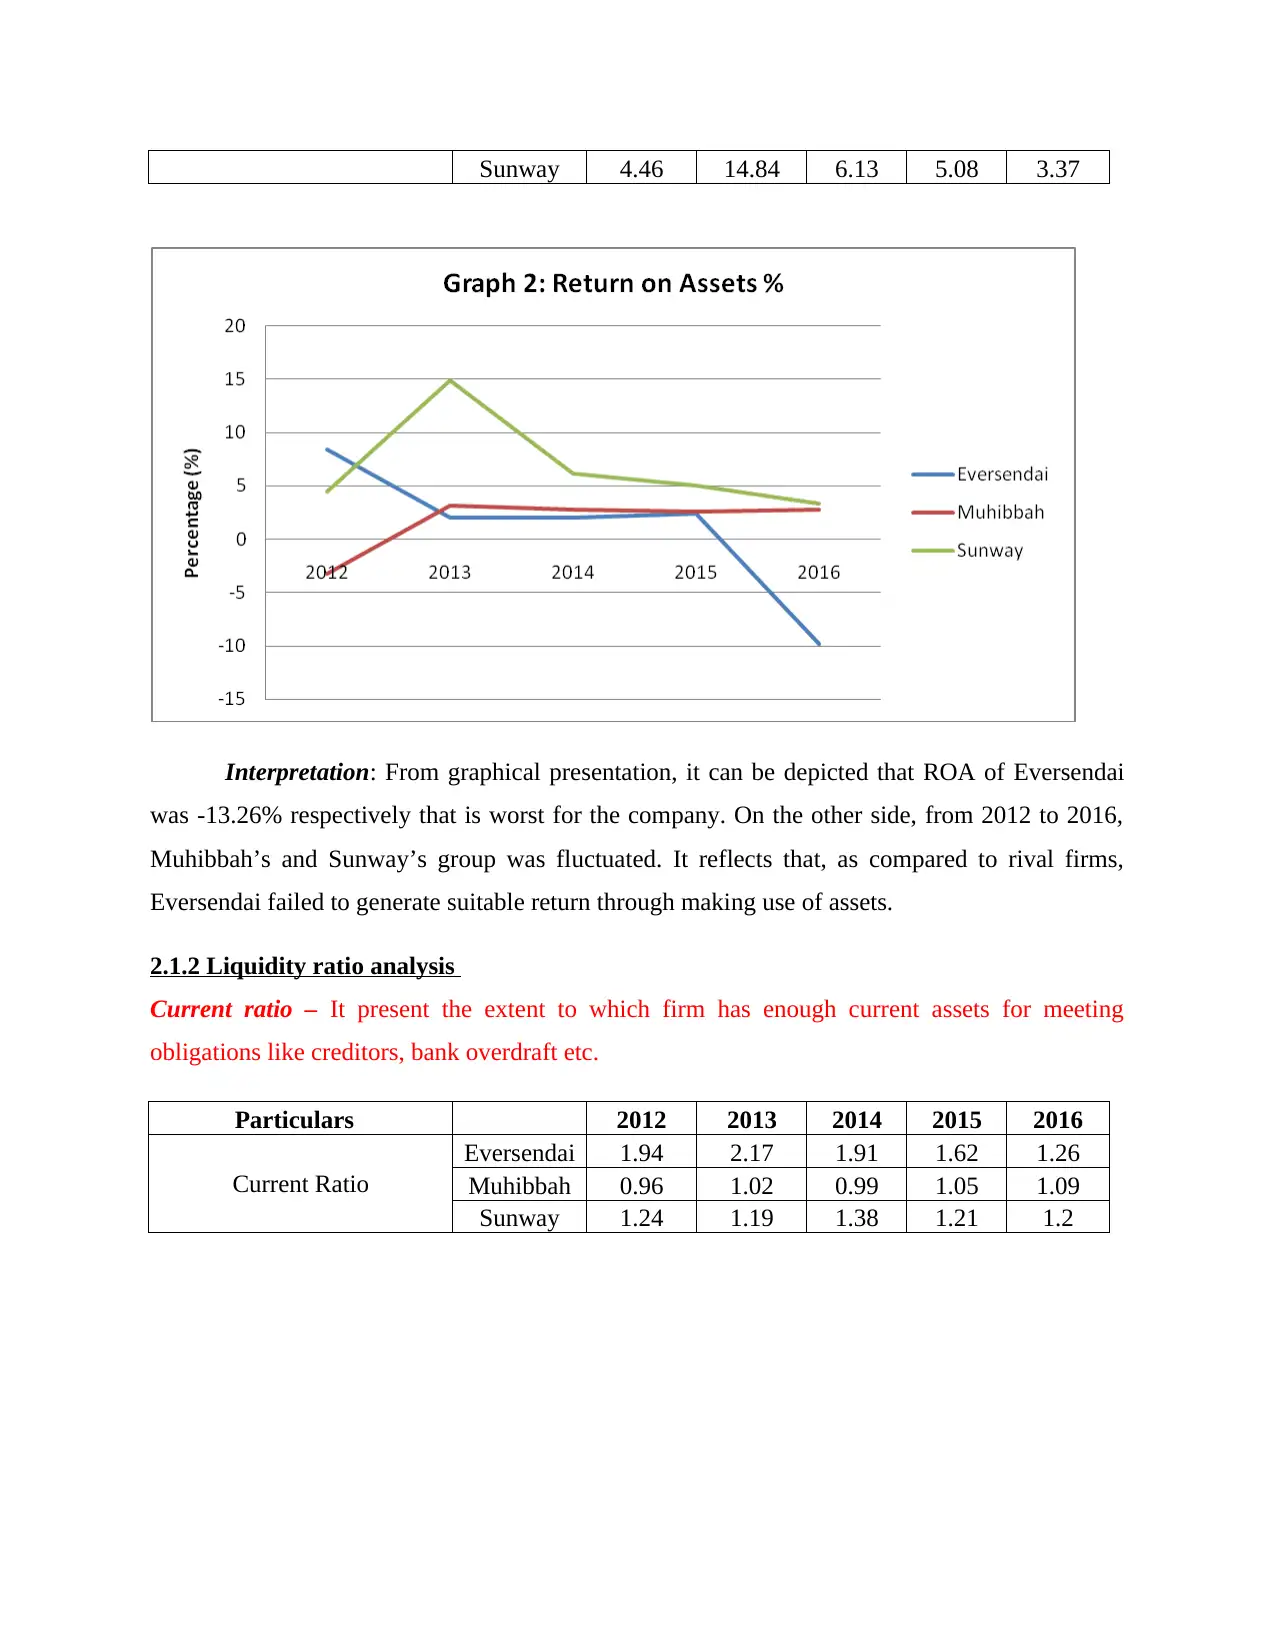
Sunway 4.46 14.84 6.13 5.08 3.37
Interpretation: From graphical presentation, it can be depicted that ROA of Eversendai
was -13.26% respectively that is worst for the company. On the other side, from 2012 to 2016,
Muhibbah’s and Sunway’s group was fluctuated. It reflects that, as compared to rival firms,
Eversendai failed to generate suitable return through making use of assets.
2.1.2 Liquidity ratio analysis
Current ratio – It present the extent to which firm has enough current assets for meeting
obligations like creditors, bank overdraft etc.
Particulars 2012 2013 2014 2015 2016
Current Ratio
Eversendai 1.94 2.17 1.91 1.62 1.26
Muhibbah 0.96 1.02 0.99 1.05 1.09
Sunway 1.24 1.19 1.38 1.21 1.2
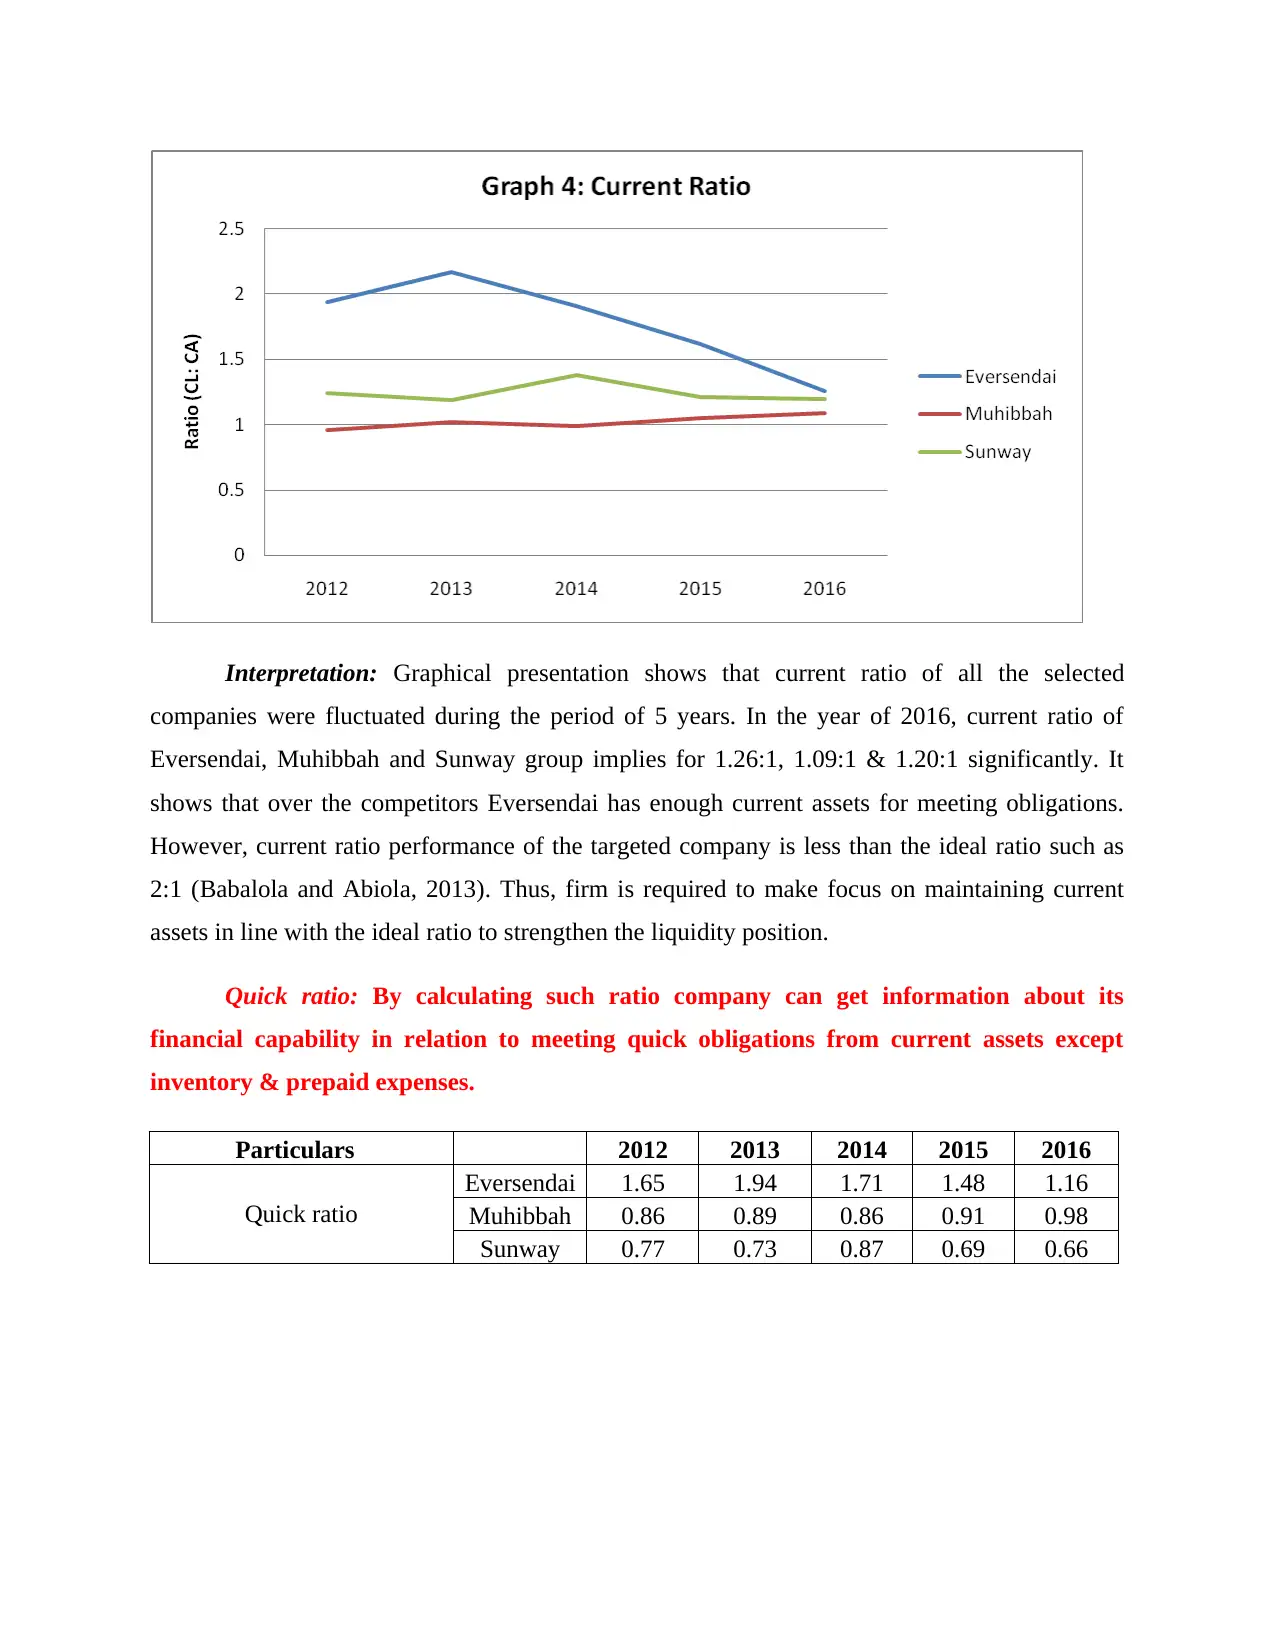
Interpretation: Graphical presentation shows that current ratio of all the selected
companies were fluctuated during the period of 5 years. In the year of 2016, current ratio of
Eversendai, Muhibbah and Sunway group implies for 1.26:1, 1.09:1 & 1.20:1 significantly. It
shows that over the competitors Eversendai has enough current assets for meeting obligations.
However, current ratio performance of the targeted company is less than the ideal ratio such as
2:1 (Babalola and Abiola, 2013). Thus, firm is required to make focus on maintaining current
assets in line with the ideal ratio to strengthen the liquidity position.
Quick ratio: By calculating such ratio company can get information about its
financial capability in relation to meeting quick obligations from current assets except
inventory & prepaid expenses.
Particulars 2012 2013 2014 2015 2016
Quick ratio
Eversendai 1.65 1.94 1.71 1.48 1.16
Muhibbah 0.86 0.89 0.86 0.91 0.98
Sunway 0.77 0.73 0.87 0.69 0.66
⊘ This is a preview!⊘
Do you want full access?
Subscribe today to unlock all pages.
Trusted by 1+ million students worldwide
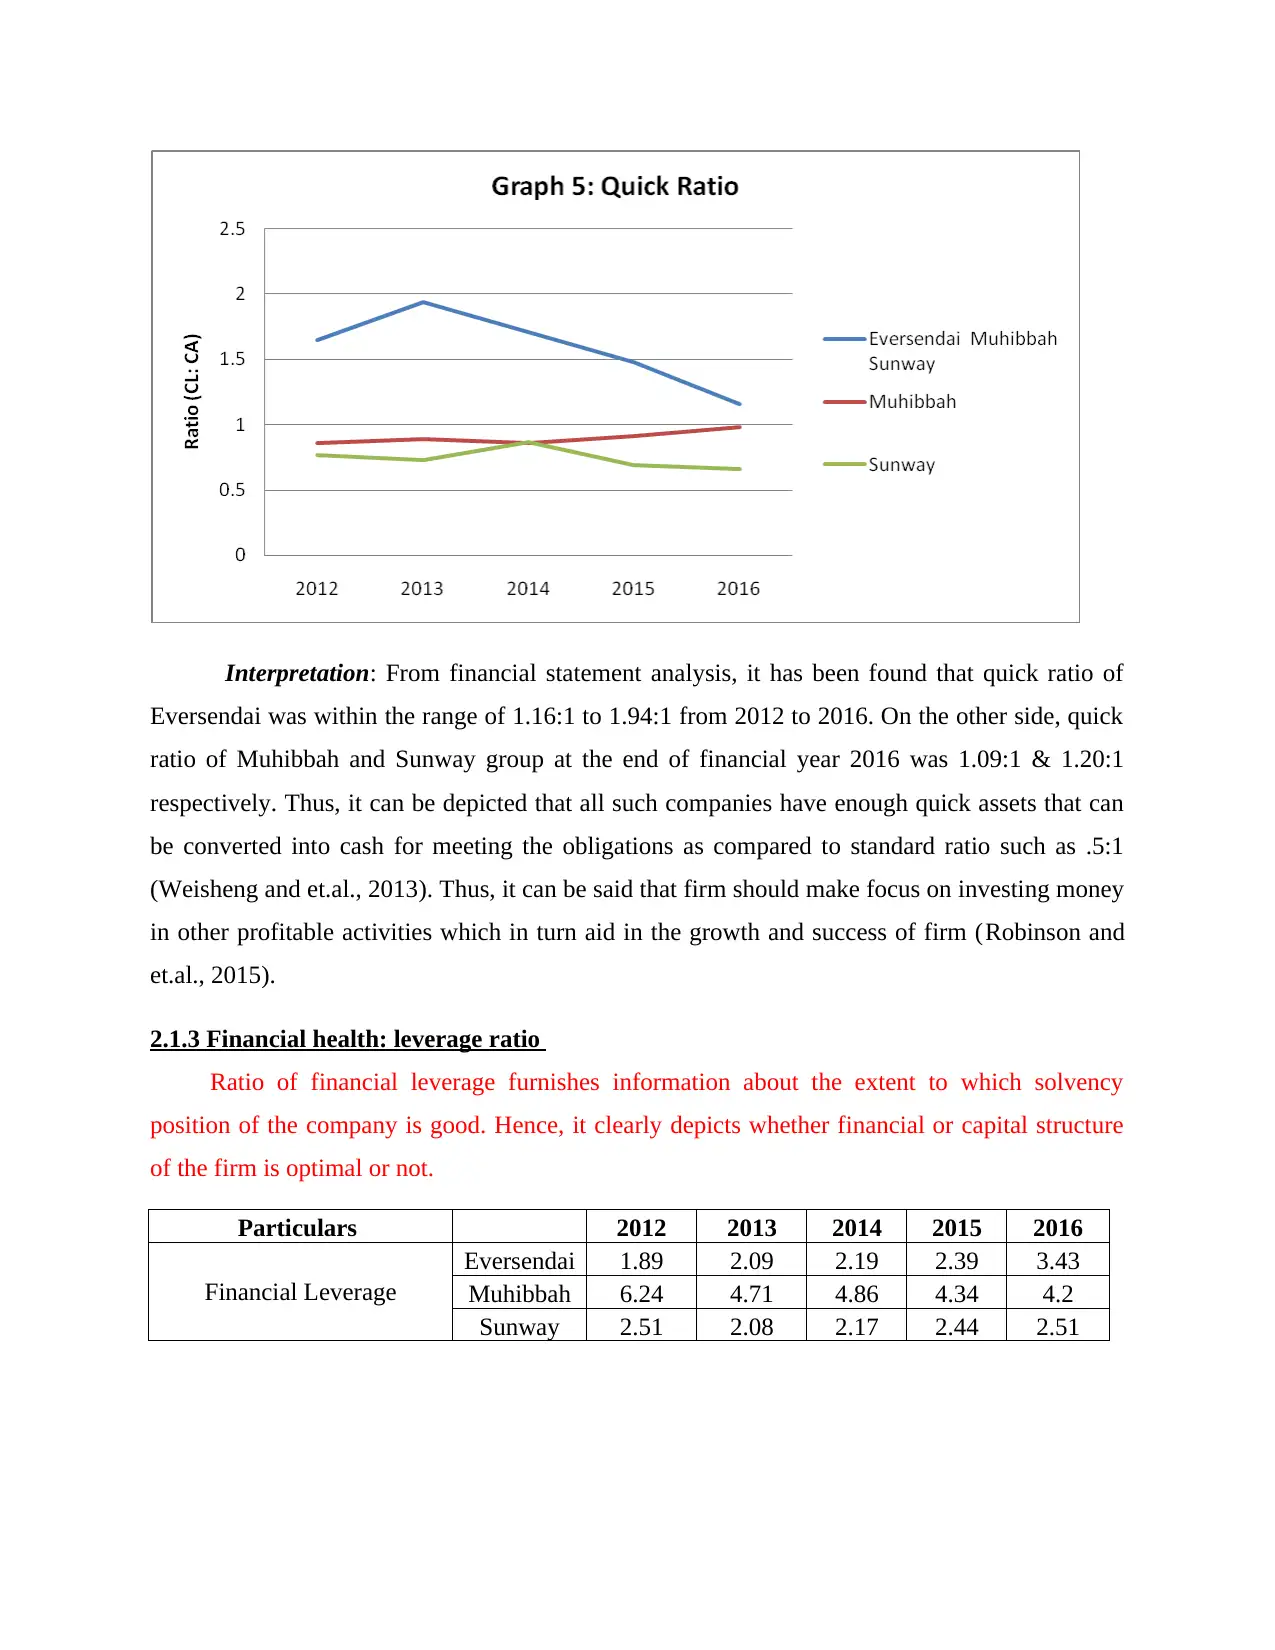
Interpretation: From financial statement analysis, it has been found that quick ratio of
Eversendai was within the range of 1.16:1 to 1.94:1 from 2012 to 2016. On the other side, quick
ratio of Muhibbah and Sunway group at the end of financial year 2016 was 1.09:1 & 1.20:1
respectively. Thus, it can be depicted that all such companies have enough quick assets that can
be converted into cash for meeting the obligations as compared to standard ratio such as .5:1
(Weisheng and et.al., 2013). Thus, it can be said that firm should make focus on investing money
in other profitable activities which in turn aid in the growth and success of firm (Robinson and
et.al., 2015).
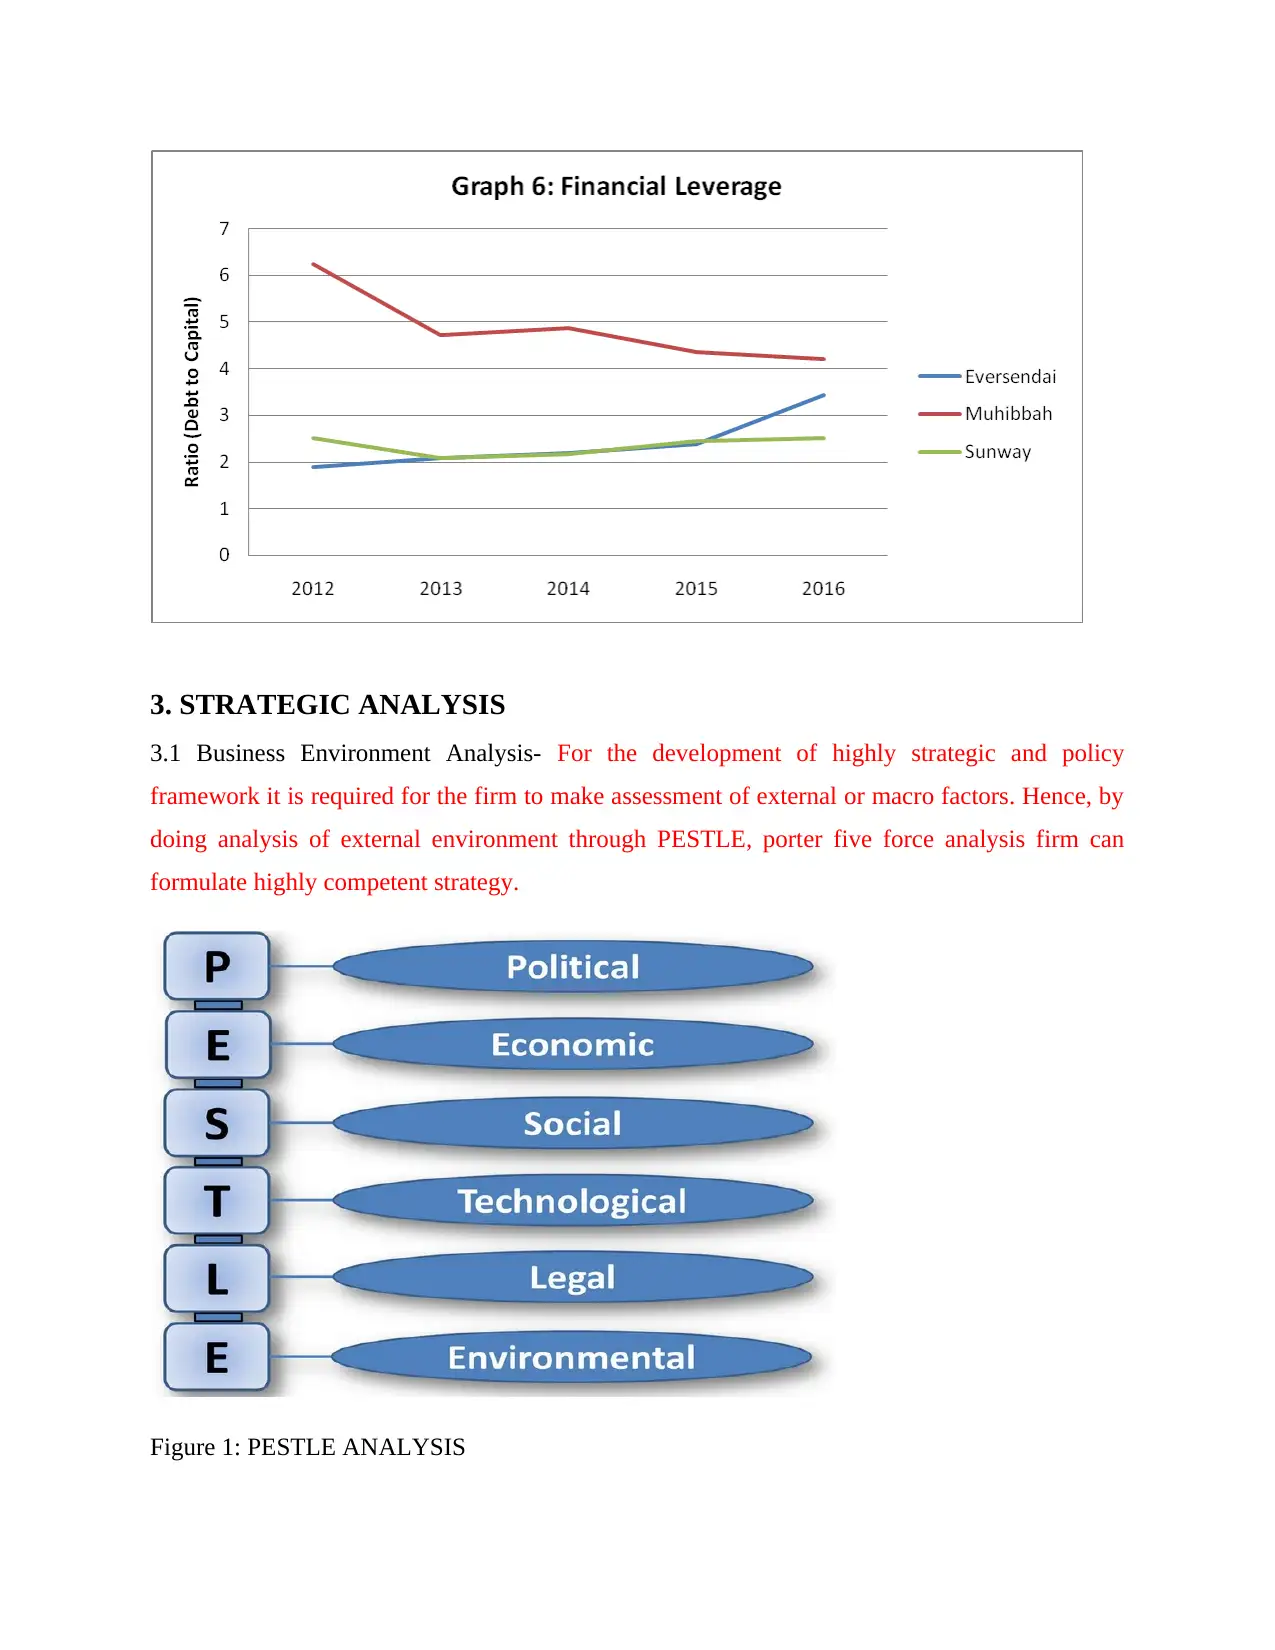
2.1.3 Financial health: leverage ratio
Ratio of financial leverage furnishes information about the extent to which solvency
position of the company is good. Hence, it clearly depicts whether financial or capital structure
of the firm is optimal or not.
Particulars 2012 2013 2014 2015 2016
Financial Leverage
Eversendai 1.89 2.09 2.19 2.39 3.43
Muhibbah 6.24 4.71 4.86 4.34 4.2
Sunway 2.51 2.08 2.17 2.44 2.51
Eversendai was within the range of 1.16:1 to 1.94:1 from 2012 to 2016. On the other side, quick
ratio of Muhibbah and Sunway group at the end of financial year 2016 was 1.09:1 & 1.20:1
respectively. Thus, it can be depicted that all such companies have enough quick assets that can
be converted into cash for meeting the obligations as compared to standard ratio such as .5:1
(Weisheng and et.al., 2013). Thus, it can be said that firm should make focus on investing money
in other profitable activities which in turn aid in the growth and success of firm (Robinson and
et.al., 2015).
2.1.3 Financial health: leverage ratio
Ratio of financial leverage furnishes information about the extent to which solvency
position of the company is good. Hence, it clearly depicts whether financial or capital structure
of the firm is optimal or not.
Particulars 2012 2013 2014 2015 2016
Financial Leverage
Eversendai 1.89 2.09 2.19 2.39 3.43
Muhibbah 6.24 4.71 4.86 4.34 4.2
Sunway 2.51 2.08 2.17 2.44 2.51
Paraphrase This Document
Need a fresh take? Get an instant paraphrase of this document with our AI Paraphraser
3. STRATEGIC ANALYSIS
3.1 Business Environment Analysis- For the development of highly strategic and policy
framework it is required for the firm to make assessment of external or macro factors. Hence, by
doing analysis of external environment through PESTLE, porter five force analysis firm can
formulate highly competent strategy.
Figure 1: PESTLE ANALYSIS
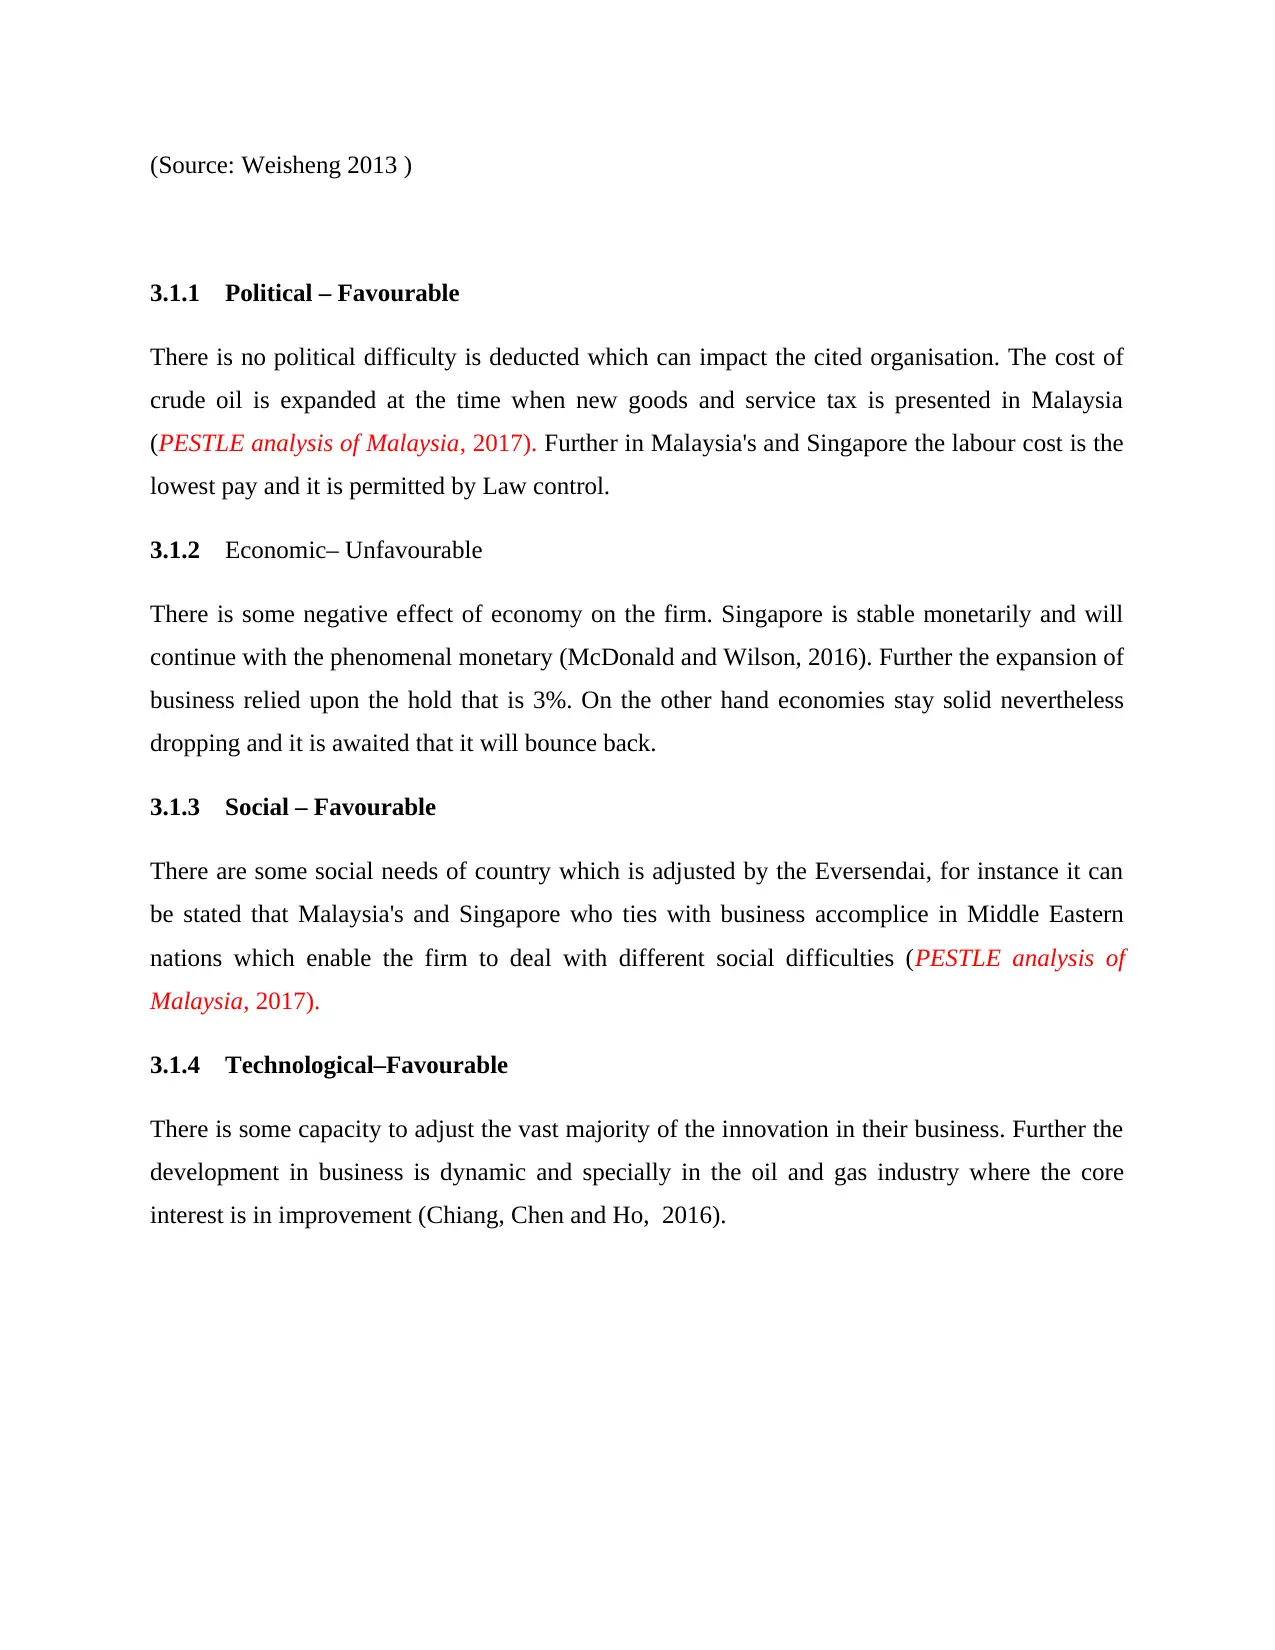
(Source: Weisheng 2013 )
3.1.1 Political – Favourable
There is no political difficulty is deducted which can impact the cited organisation. The cost of
crude oil is expanded at the time when new goods and service tax is presented in Malaysia
(PESTLE analysis of Malaysia, 2017). Further in Malaysia's and Singapore the labour cost is the
lowest pay and it is permitted by Law control.
3.1.2 Economic– Unfavourable
There is some negative effect of economy on the firm. Singapore is stable monetarily and will
continue with the phenomenal monetary (McDonald and Wilson, 2016). Further the expansion of
business relied upon the hold that is 3%. On the other hand economies stay solid nevertheless
dropping and it is awaited that it will bounce back.
3.1.3 Social – Favourable
There are some social needs of country which is adjusted by the Eversendai, for instance it can
be stated that Malaysia's and Singapore who ties with business accomplice in Middle Eastern
nations which enable the firm to deal with different social difficulties (PESTLE analysis of
Malaysia, 2017).
3.1.4 Technological–Favourable
There is some capacity to adjust the vast majority of the innovation in their business. Further the
development in business is dynamic and specially in the oil and gas industry where the core
interest is in improvement (Chiang, Chen and Ho, 2016).
⊘ This is a preview!⊘
Do you want full access?
Subscribe today to unlock all pages.
Trusted by 1+ million students worldwide
1 out of 32
Related Documents


Your All-in-One AI-Powered Toolkit for Academic Success.
+13062052269
info@desklib.com
Available 24*7 on WhatsApp / Email
![[object Object]](/_next/static/media/star-bottom.7253800d.svg)
Unlock your academic potential
Copyright © 2020–2026 A2Z Services. All Rights Reserved. Developed and managed by ZUCOL.