Statistical Analysis Assignment: Excel Data Interpretation

Verified

Added on  2022/11/25

|4
|916
|177
Homework Assignment
AI Summary
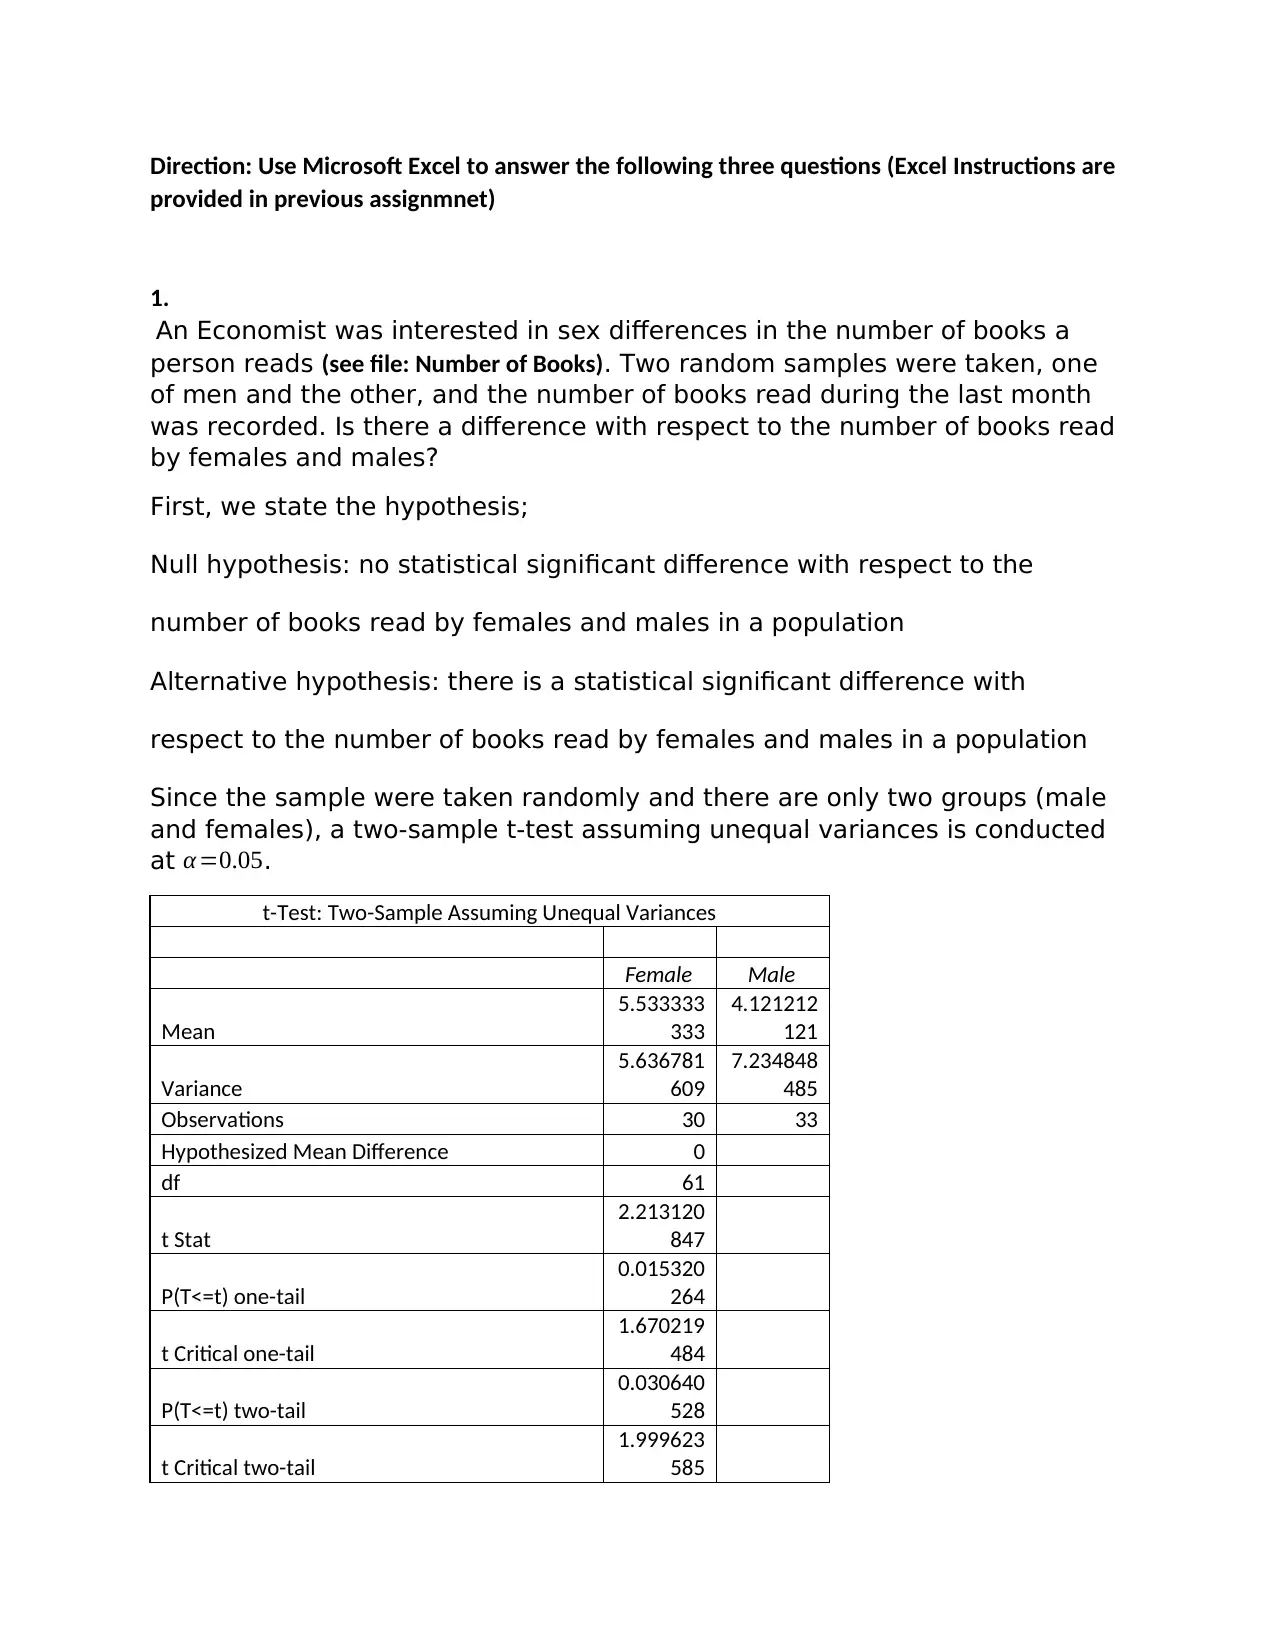
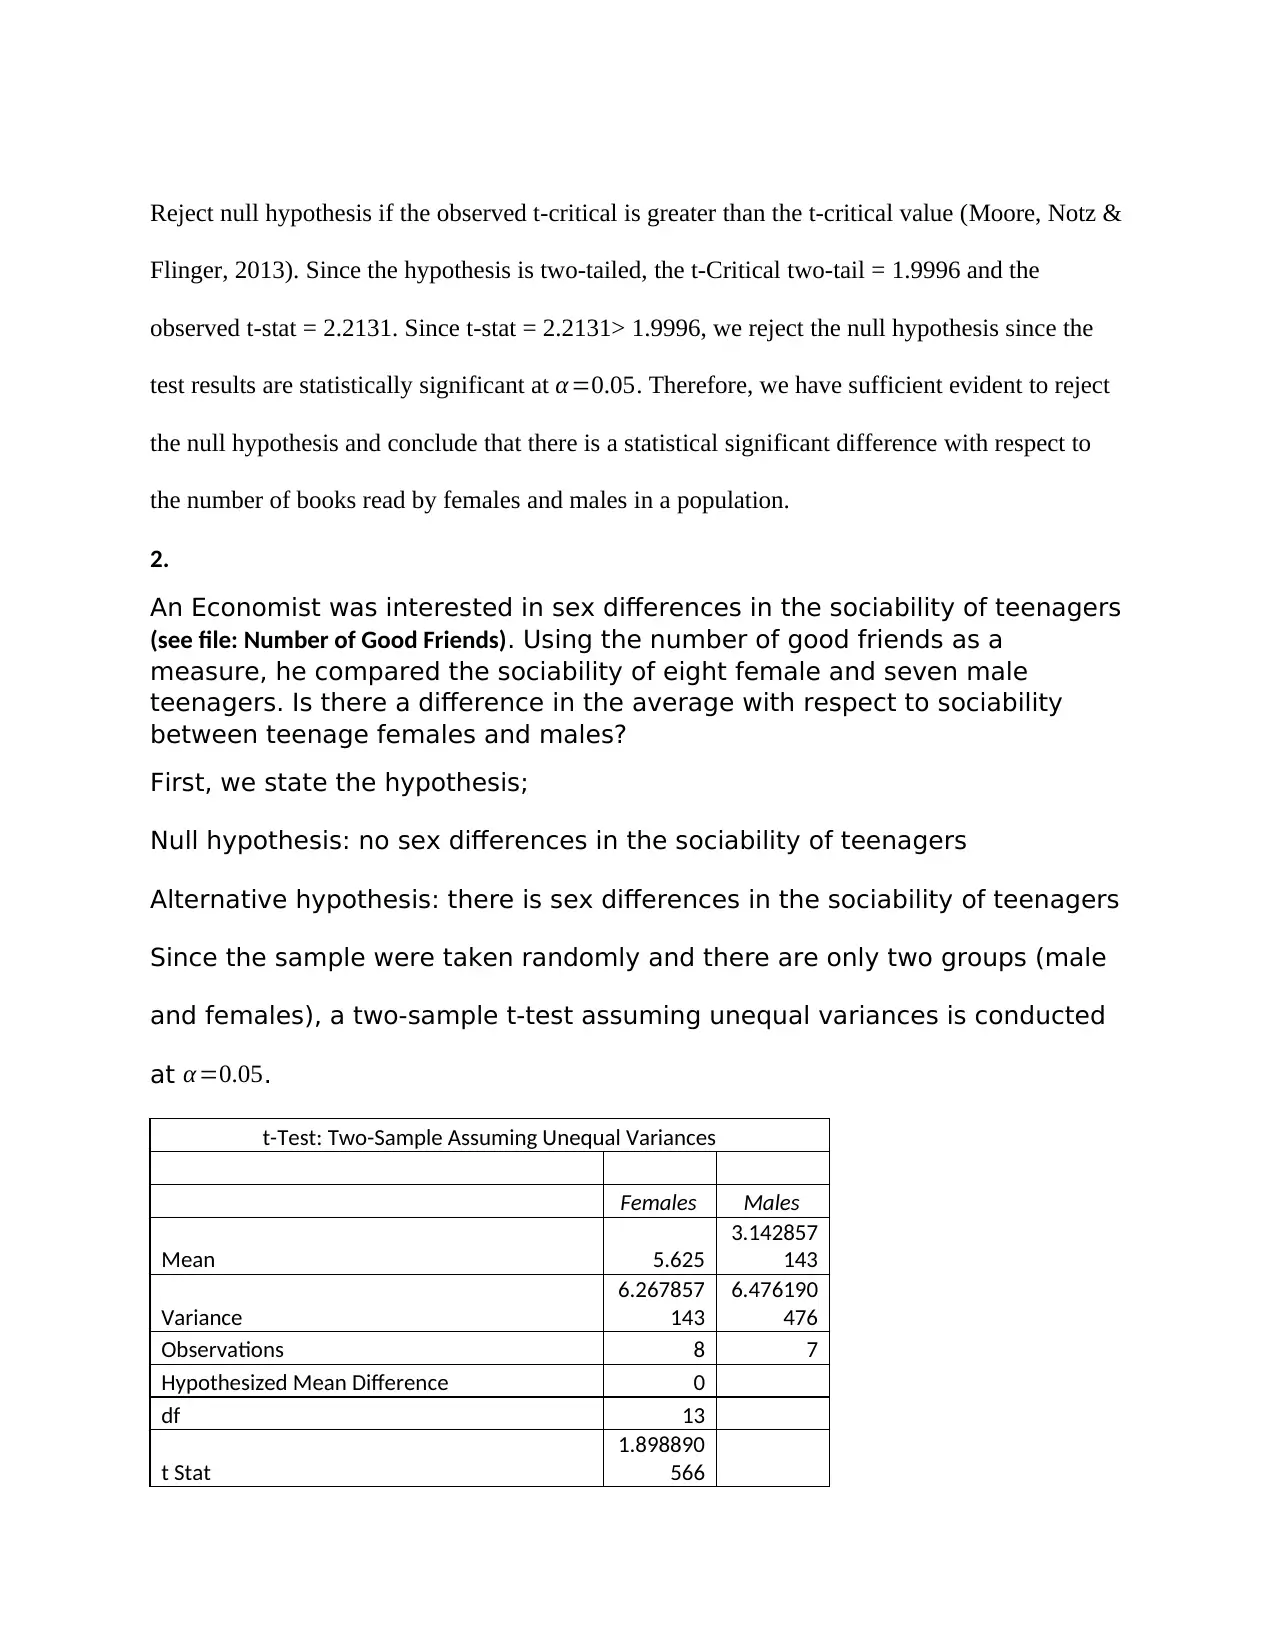
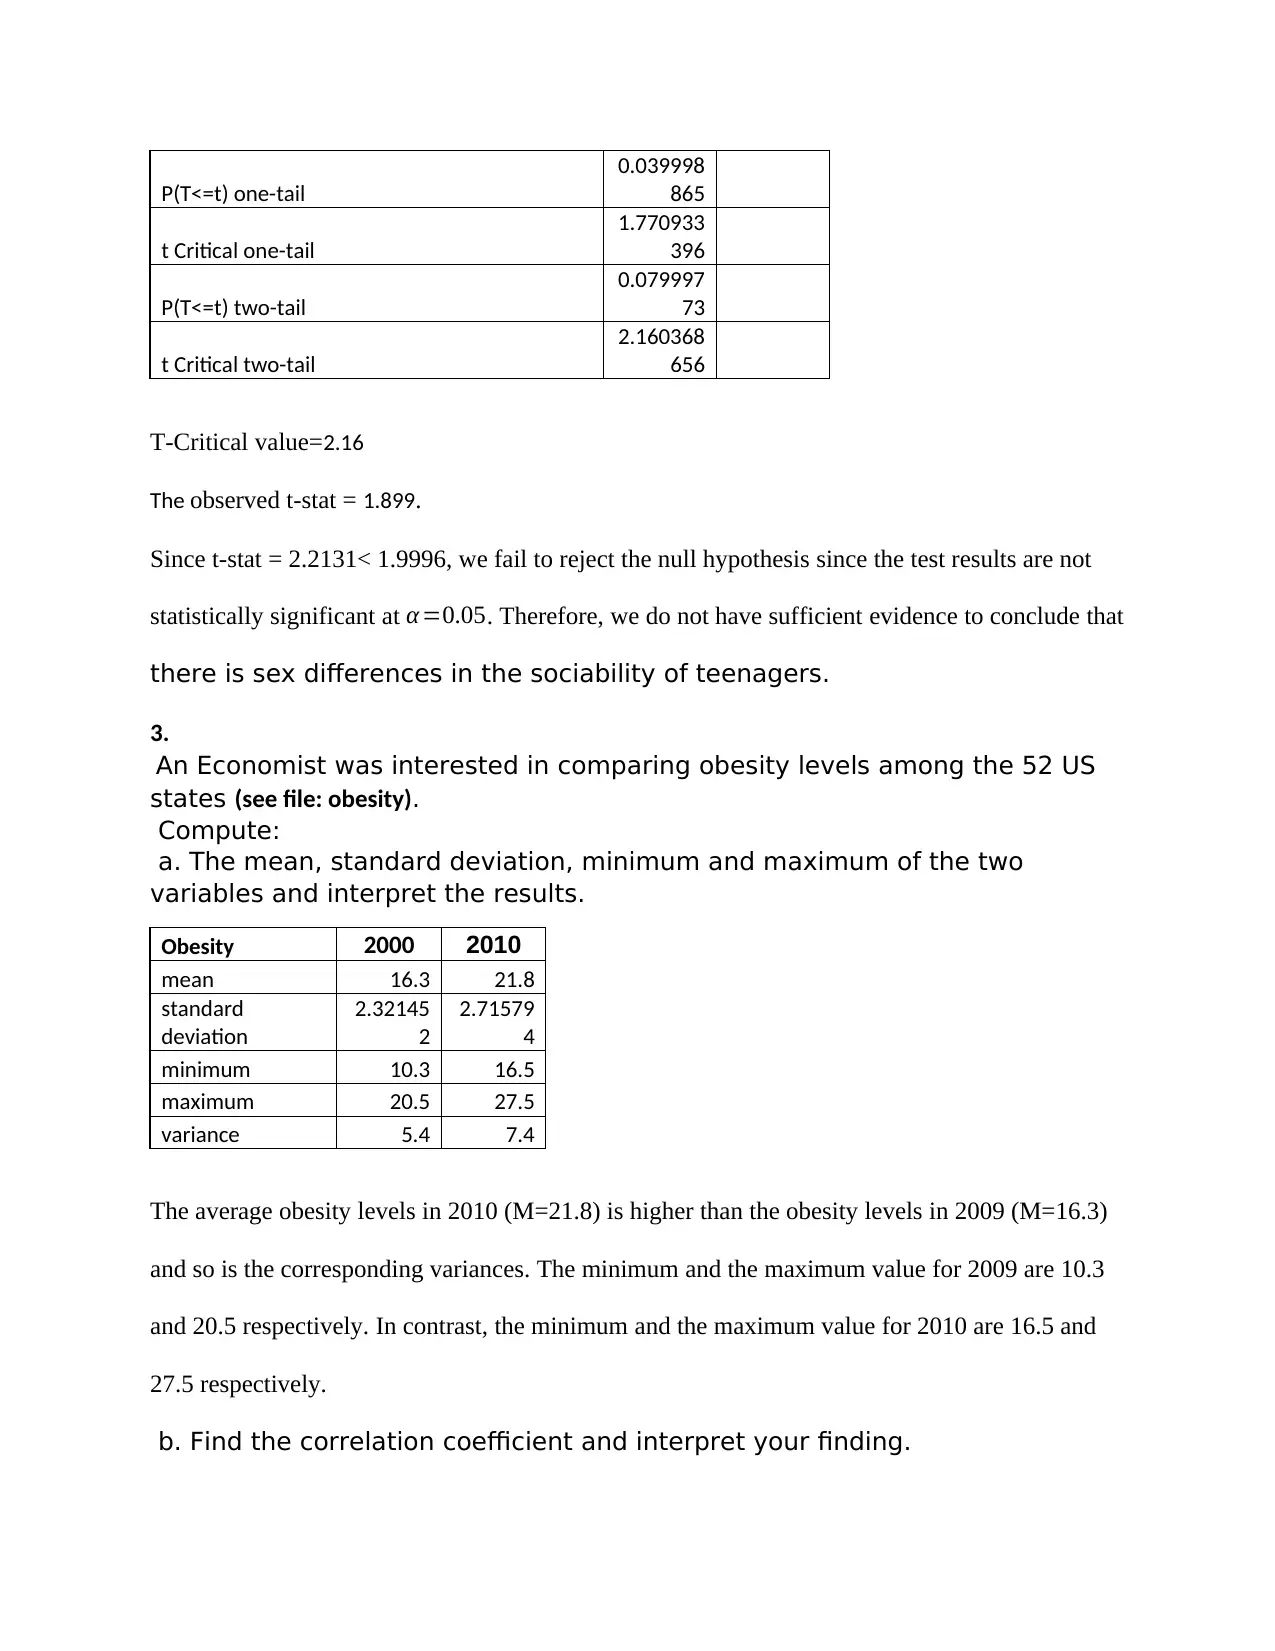
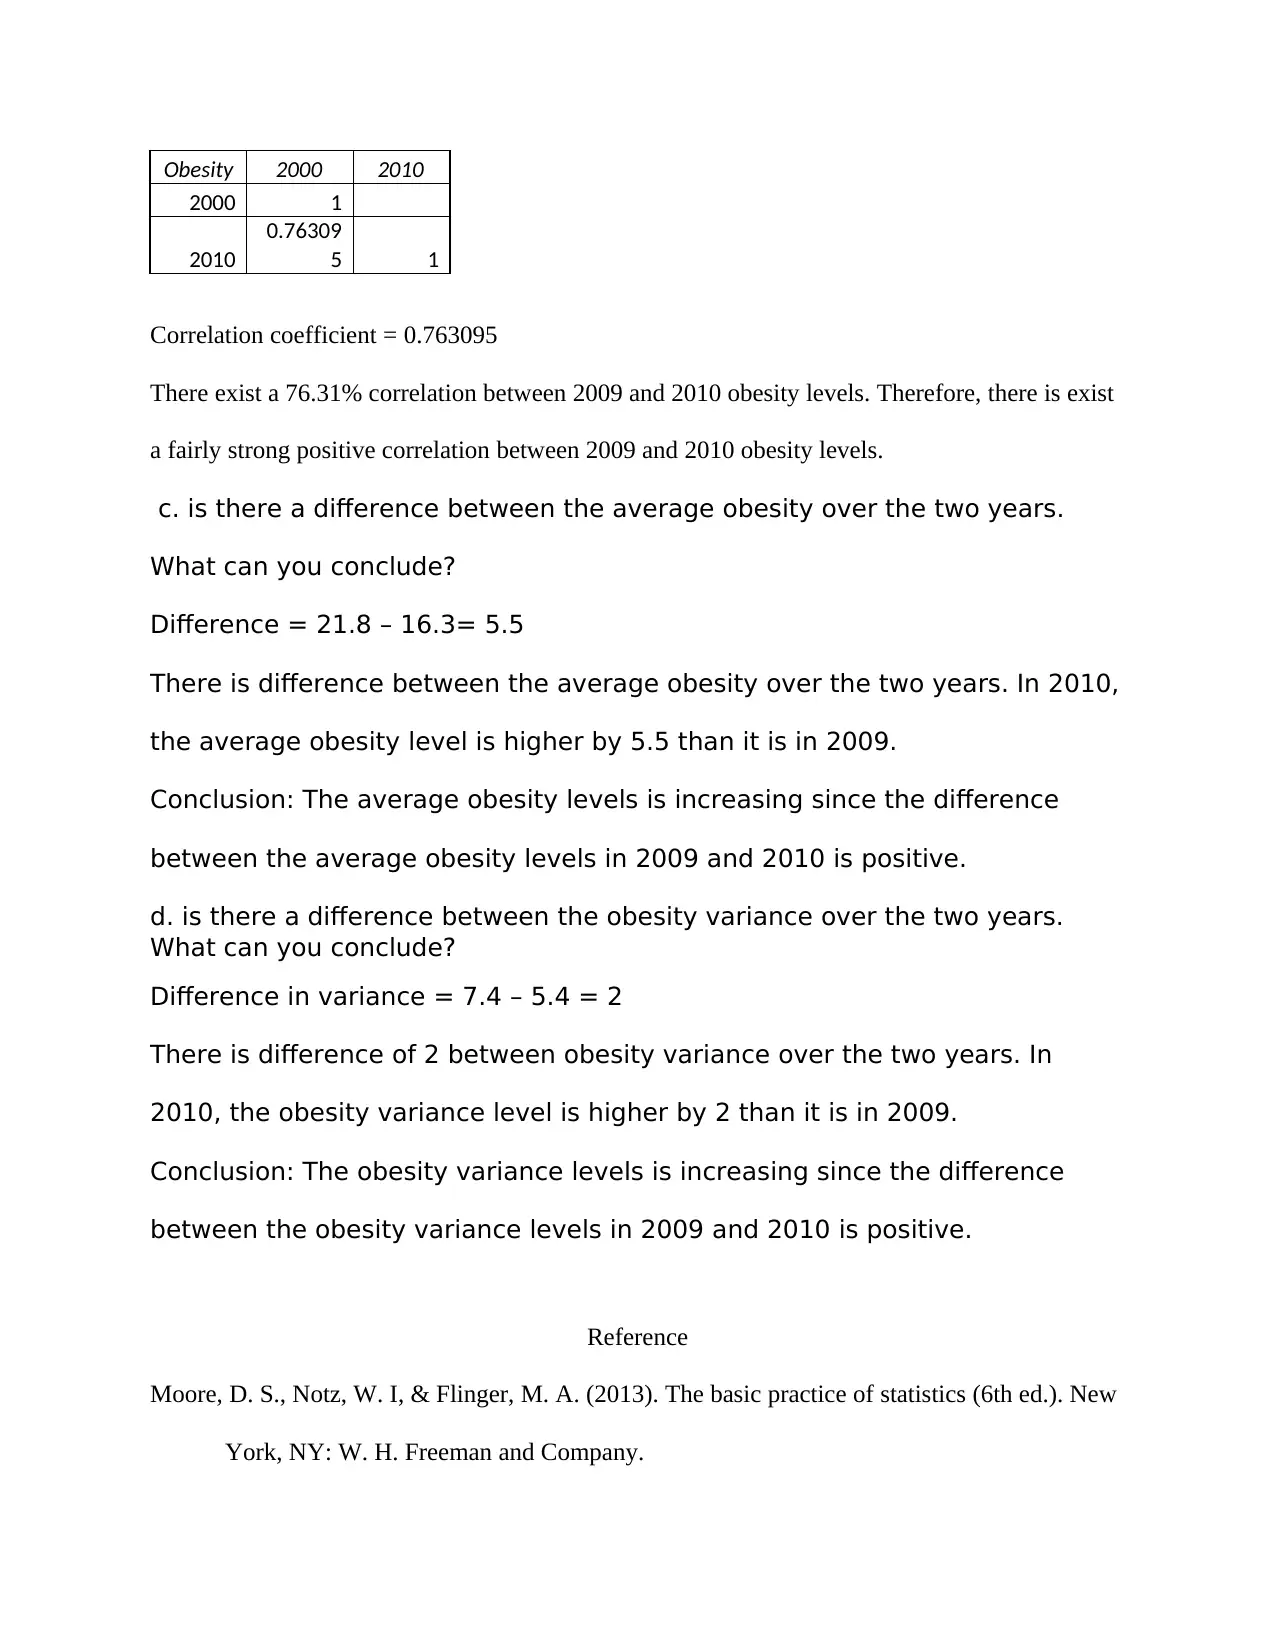
This assignment uses Microsoft Excel to analyze data related to book reading habits, sociability of teenagers, and obesity levels in the US. The first part involves a two-sample t-test to determine if there's a statistically significant difference in the number of books read by males and females. The second part applies a t-test to compare the sociability of teenage females and males. The final part focuses on analyzing obesity levels across US states, calculating mean, standard deviation, correlation coefficients, and differences in average obesity and variance between 2000 and 2010. The student provides detailed interpretations of the statistical findings, including hypothesis testing and data analysis.
Document Page
Direction: Use Microsoft Excel to answer the following three questions (Excel Instructions are
provided in previous assignmnet)
1.
An Economist was interested in sex differences in the number of books a
person reads (see file: Number of Books). Two random samples were taken, one
of men and the other, and the number of books read during the last month
was recorded. Is there a difference with respect to the number of books read
by females and males?
First, we state the hypothesis;
Null hypothesis: no statistical significant difference with respect to the
number of books read by females and males in a population
Alternative hypothesis: there is a statistical significant difference with
respect to the number of books read by females and males in a population
Since the sample were taken randomly and there are only two groups (male
and females), a two-sample t-test assuming unequal variances is conducted
at α=0.05.
t-Test: Two-Sample Assuming Unequal Variances
Female Male
Mean
5.533333
333
4.121212
121
Variance
5.636781
609
7.234848
485
Observations 30 33
Hypothesized Mean Difference 0
df 61
t Stat
2.213120
847
P(T<=t) one-tail
0.015320
264
t Critical one-tail
1.670219
484
P(T<=t) two-tail
0.030640
528
t Critical two-tail
1.999623
585
tabler-icon-diamond-filled.svg

Paraphrase This Document

Need a fresh take? Get an instant paraphrase of this document with our AI Paraphraser
Document Page
Reject null hypothesis if the observed t-critical is greater than the t-critical value (Moore, Notz &
Flinger, 2013). Since the hypothesis is two-tailed, the t-Critical two-tail = 1.9996 and the
observed t-stat = 2.2131. Since t-stat = 2.2131> 1.9996, we reject the null hypothesis since the
test results are statistically significant at α=0.05. Therefore, we have sufficient evident to reject
the null hypothesis and conclude that there is a statistical significant difference with respect to
the number of books read by females and males in a population.
2.
An Economist was interested in sex differences in the sociability of teenagers
(see file: Number of Good Friends). Using the number of good friends as a
measure, he compared the sociability of eight female and seven male
teenagers. Is there a difference in the average with respect to sociability
between teenage females and males?
First, we state the hypothesis;
Null hypothesis: no sex differences in the sociability of teenagers
Alternative hypothesis: there is sex differences in the sociability of teenagers
Since the sample were taken randomly and there are only two groups (male
and females), a two-sample t-test assuming unequal variances is conducted
at α=0.05.
t-Test: Two-Sample Assuming Unequal Variances
Females Males
Mean 5.625
3.142857
143
Variance
6.267857
143
6.476190
476
Observations 8 7
Hypothesized Mean Difference 0
df 13
t Stat
1.898890
566
Document Page
P(T<=t) one-tail
0.039998
865
t Critical one-tail
1.770933
396
P(T<=t) two-tail
0.079997
73
t Critical two-tail
2.160368
656
T-Critical value=2.16
The observed t-stat = 1.899.
Since t-stat = 2.2131< 1.9996, we fail to reject the null hypothesis since the test results are not
statistically significant at α =0.05. Therefore, we do not have sufficient evidence to conclude that
there is sex differences in the sociability of teenagers.
3.
An Economist was interested in comparing obesity levels among the 52 US
states (see file: obesity).
Compute:
a. The mean, standard deviation, minimum and maximum of the two
variables and interpret the results.
Obesity 2000 2010
mean 16.3 21.8
standard
deviation
2.32145
2
2.71579
4
minimum 10.3 16.5
maximum 20.5 27.5
variance 5.4 7.4
The average obesity levels in 2010 (M=21.8) is higher than the obesity levels in 2009 (M=16.3)
and so is the corresponding variances. The minimum and the maximum value for 2009 are 10.3
and 20.5 respectively. In contrast, the minimum and the maximum value for 2010 are 16.5 and
27.5 respectively.
b. Find the correlation coefficient and interpret your finding.
Document Page
Obesity 2000 2010
2000 1
2010
0.76309
5 1
Correlation coefficient = 0.763095
There exist a 76.31% correlation between 2009 and 2010 obesity levels. Therefore, there is exist
a fairly strong positive correlation between 2009 and 2010 obesity levels.
c. is there a difference between the average obesity over the two years.
What can you conclude?
Difference = 21.8 – 16.3= 5.5
There is difference between the average obesity over the two years. In 2010,
the average obesity level is higher by 5.5 than it is in 2009.
Conclusion: The average obesity levels is increasing since the difference
between the average obesity levels in 2009 and 2010 is positive.
d. is there a difference between the obesity variance over the two years.
What can you conclude?
Difference in variance = 7.4 – 5.4 = 2
There is difference of 2 between obesity variance over the two years. In
2010, the obesity variance level is higher by 2 than it is in 2009.
Conclusion: The obesity variance levels is increasing since the difference
between the obesity variance levels in 2009 and 2010 is positive.
Reference
Moore, D. S., Notz, W. I, & Flinger, M. A. (2013). The basic practice of statistics (6th ed.). New
York, NY: W. H. Freeman and Company.
chevron_up_icon
1 out of 4
circle_padding
hide_on_mobile
zoom_out_icon
[object Object]