Business Statistics: Excel Data Analysis and Interpretation

Verified

Added on  2022/09/18

|6
|432
|26
Homework Assignment
AI Summary
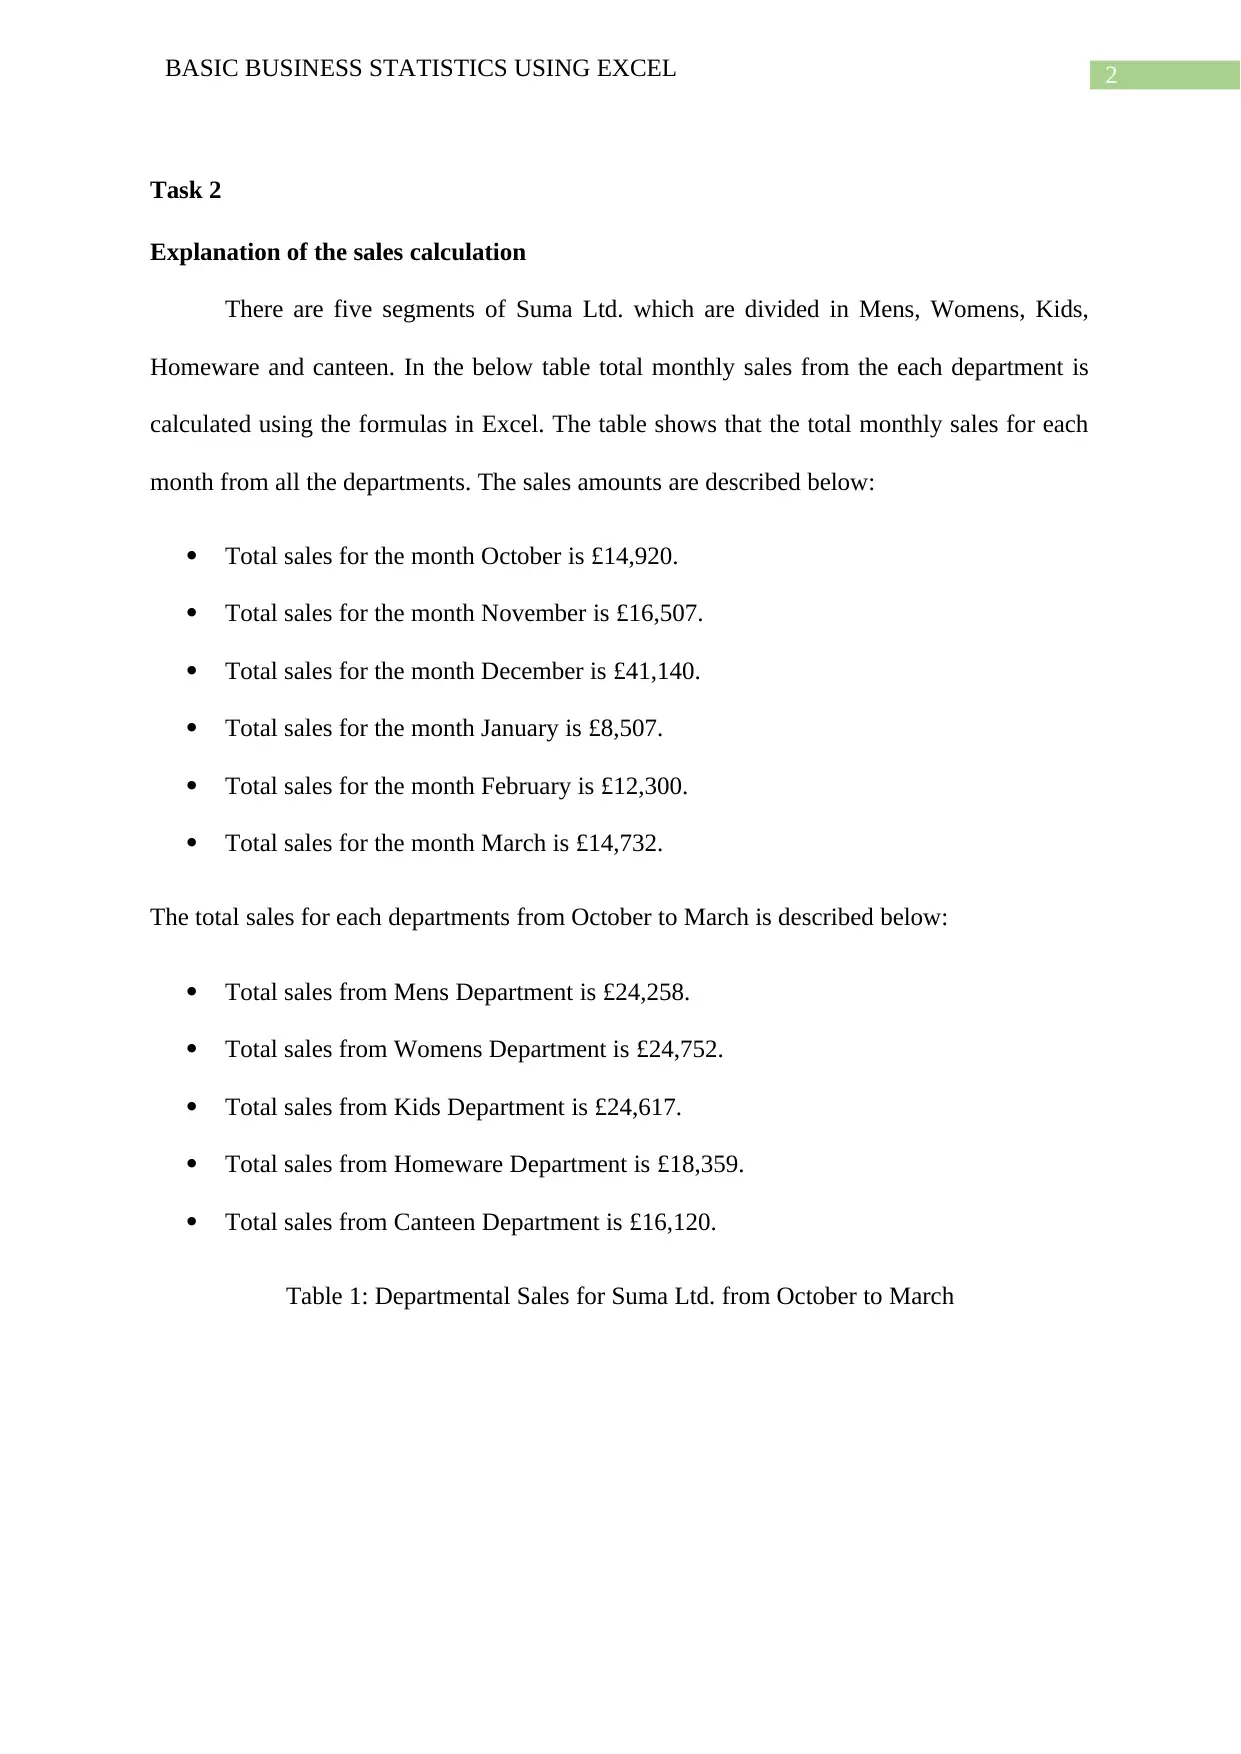
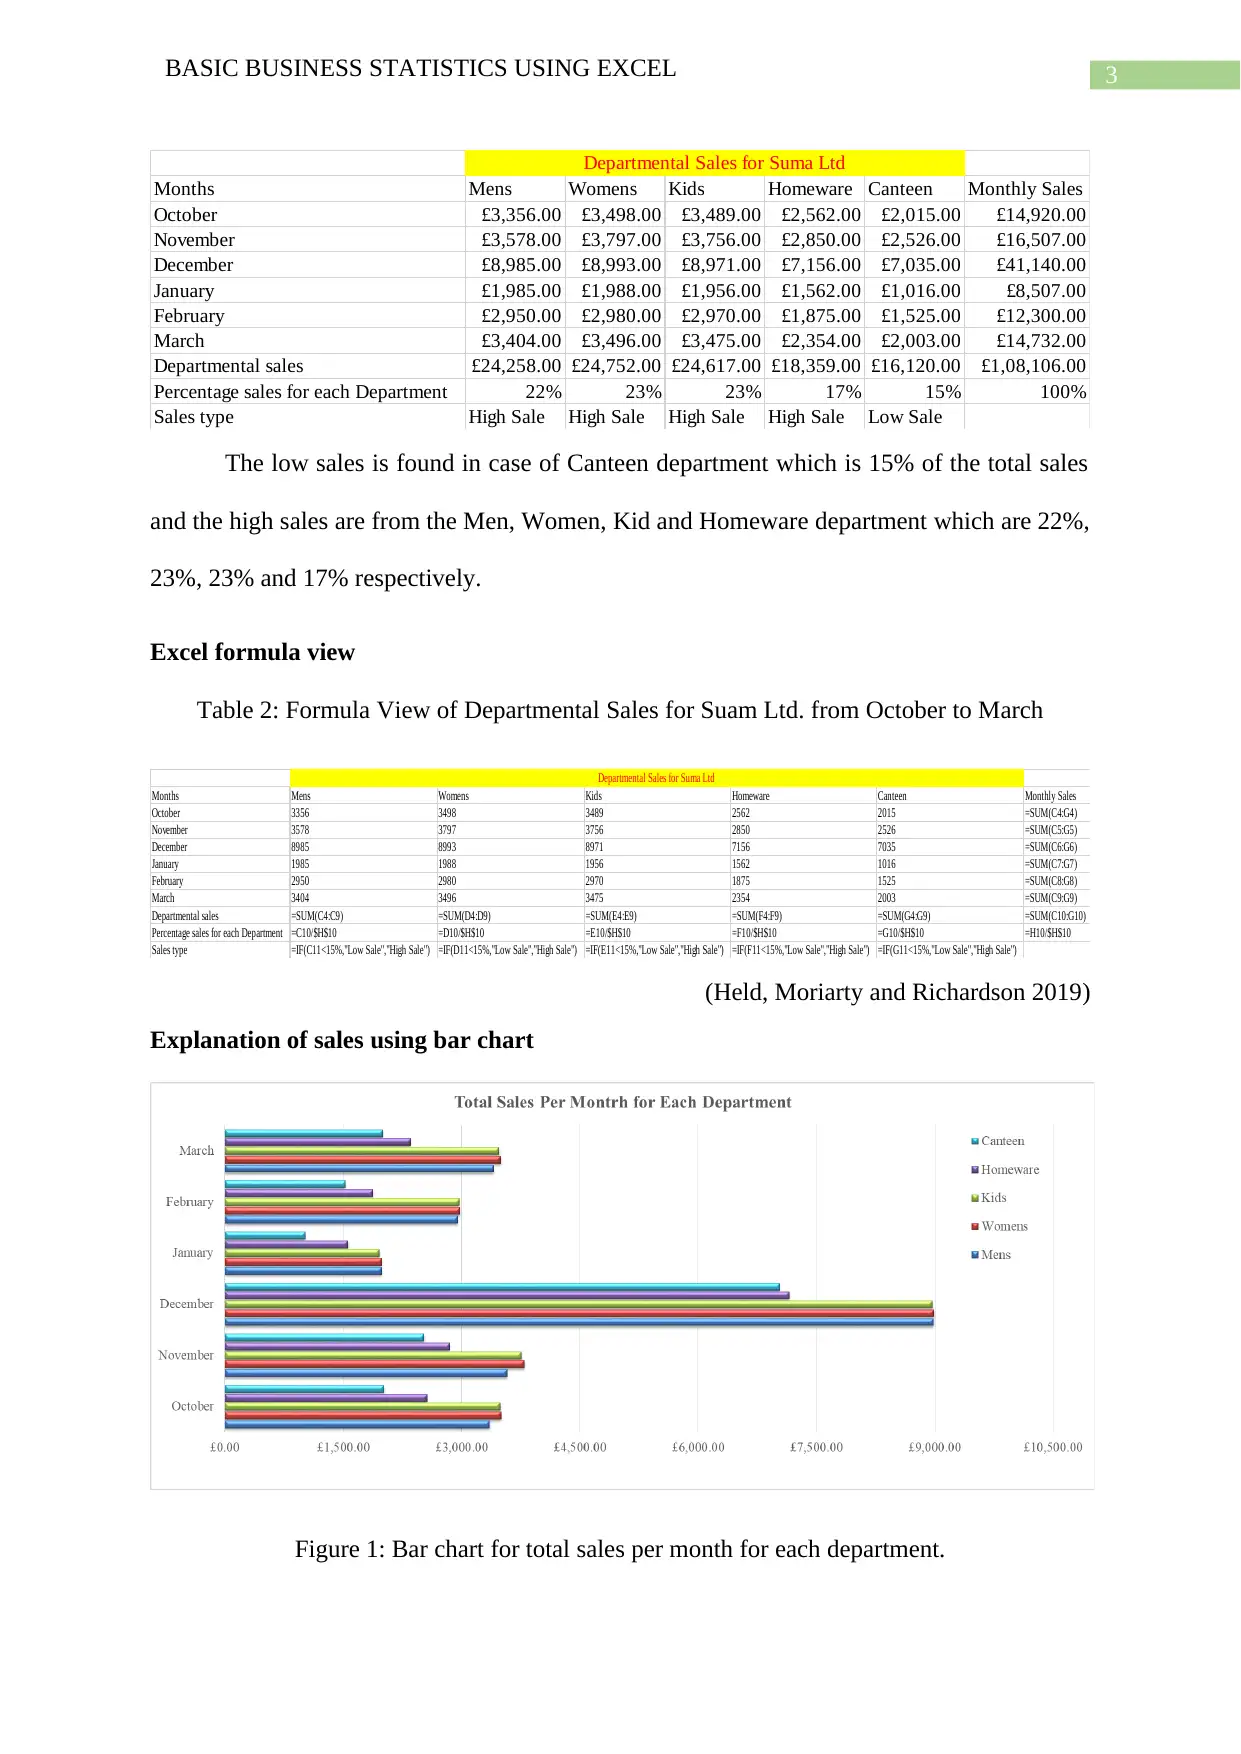
This assignment focuses on using Microsoft Excel for business statistics, specifically analyzing sales data for a retail store named Suma Ltd. The student calculates and presents sales figures for five departments (Mens, Womens, Kids, Homeware, and Canteen) over a six-month period (October to March). The assignment involves creating a table with the sales data, providing an Excel formula view to demonstrate the calculations, and generating a bar chart to visualize the sales trends. The student also explains the findings, comparing the sales performance of each department and identifying the highest and lowest performing months, supported by screenshots of the Excel spreadsheet. The analysis includes the use of formulas, data interpretation, and chart creation, all aimed at understanding the sales data effectively. The solution includes references to support the analysis.
Document Page
Running head: BASIC BUSINESS STATISTICS USING EXCEL
Basic Business Statistics Using Excel
Name of the Student:
Name of the University:
Author Note:
tabler-icon-diamond-filled.svg

Secure Best Marks with AI Grader

Need help grading? Try our AI Grader for instant feedback on your assignments.
Document Page
1BASIC BUSINESS STATISTICS USING EXCEL
Table of Contents
Task 2.........................................................................................................................................2
Explanation of the sales calculation.......................................................................................2
Excel formula view................................................................................................................3
Explanation of sales using bar chart.......................................................................................3
Reference....................................................................................................................................5
Document Page
2BASIC BUSINESS STATISTICS USING EXCEL
Task 2
Explanation of the sales calculation
There are five segments of Suma Ltd. which are divided in Mens, Womens, Kids,
Homeware and canteen. In the below table total monthly sales from the each department is
calculated using the formulas in Excel. The table shows that the total monthly sales for each
month from all the departments. The sales amounts are described below:
Total sales for the month October is £14,920.
Total sales for the month November is £16,507.
Total sales for the month December is £41,140.
Total sales for the month January is £8,507.
Total sales for the month February is £12,300.
Total sales for the month March is £14,732.
The total sales for each departments from October to March is described below:
Total sales from Mens Department is £24,258.
Total sales from Womens Department is £24,752.
Total sales from Kids Department is £24,617.
Total sales from Homeware Department is £18,359.
Total sales from Canteen Department is £16,120.
Table 1: Departmental Sales for Suma Ltd. from October to March
Document Page
3BASIC BUSINESS STATISTICS USING EXCEL
Months Mens Womens Kids Homeware Canteen Monthly Sales
October £3,356.00 £3,498.00 £3,489.00 £2,562.00 £2,015.00 £14,920.00
November £3,578.00 £3,797.00 £3,756.00 £2,850.00 £2,526.00 £16,507.00
December £8,985.00 £8,993.00 £8,971.00 £7,156.00 £7,035.00 £41,140.00
January £1,985.00 £1,988.00 £1,956.00 £1,562.00 £1,016.00 £8,507.00
February £2,950.00 £2,980.00 £2,970.00 £1,875.00 £1,525.00 £12,300.00
March £3,404.00 £3,496.00 £3,475.00 £2,354.00 £2,003.00 £14,732.00
Departmental sales £24,258.00 £24,752.00 £24,617.00 £18,359.00 £16,120.00 £1,08,106.00
Percentage sales for each Department 22% 23% 23% 17% 15% 100%
Sales type High Sale High Sale High Sale High Sale Low Sale
Departmental Sales for Suma Ltd
The low sales is found in case of Canteen department which is 15% of the total sales
and the high sales are from the Men, Women, Kid and Homeware department which are 22%,
23%, 23% and 17% respectively.
Excel formula view
Table 2: Formula View of Departmental Sales for Suam Ltd. from October to March
Months Mens Womens Kids Homeware Canteen Monthly Sales
October 3356 3498 3489 2562 2015 =SUM(C4:G4)
November 3578 3797 3756 2850 2526 =SUM(C5:G5)
December 8985 8993 8971 7156 7035 =SUM(C6:G6)
January 1985 1988 1956 1562 1016 =SUM(C7:G7)
February 2950 2980 2970 1875 1525 =SUM(C8:G8)
March 3404 3496 3475 2354 2003 =SUM(C9:G9)
Departmental sales =SUM(C4:C9) =SUM(D4:D9) =SUM(E4:E9) =SUM(F4:F9) =SUM(G4:G9) =SUM(C10:G10)
Percentage sales for each Department =C10/$H$10 =D10/$H$10 =E10/$H$10 =F10/$H$10 =G10/$H$10 =H10/$H$10
Sales type =IF(C11<15%,"Low Sale","High Sale") =IF(D11<15%,"Low Sale","High Sale") =IF(E11<15%,"Low Sale","High Sale") =IF(F11<15%,"Low Sale","High Sale") =IF(G11<15%,"Low Sale","High Sale")
Departmental Sales for Suma Ltd
(Held, Moriarty and Richardson 2019)
Explanation of sales using bar chart
Figure 1: Bar chart for total sales per month for each department.
tabler-icon-diamond-filled.svg

Secure Best Marks with AI Grader

Need help grading? Try our AI Grader for instant feedback on your assignments.
Document Page
4BASIC BUSINESS STATISTICS USING EXCEL
The above bar chart compares each department sales across the months from October
to March (Wilson 2016). The lowest sale is found in canteen department for all the months
and the highest sales is found in Women department for all the months.
Document Page
5BASIC BUSINESS STATISTICS USING EXCEL
Reference
Held, B., Moriarty, B. and Richardson, T., 2019. Microsoft Excel Functions and Formulas.
Stylus Publishing, LLC.
Wilson, K., 2016. Essential Excel 2016. Elluminet Press.
chevron_up_icon
1 out of 6
circle_padding
hide_on_mobile
zoom_out_icon
[object Object]