Presentation: Excel Formulas for Financial Data Analysis
VerifiedAdded on 2023/01/09
|14
|471
|56
Presentation
AI Summary
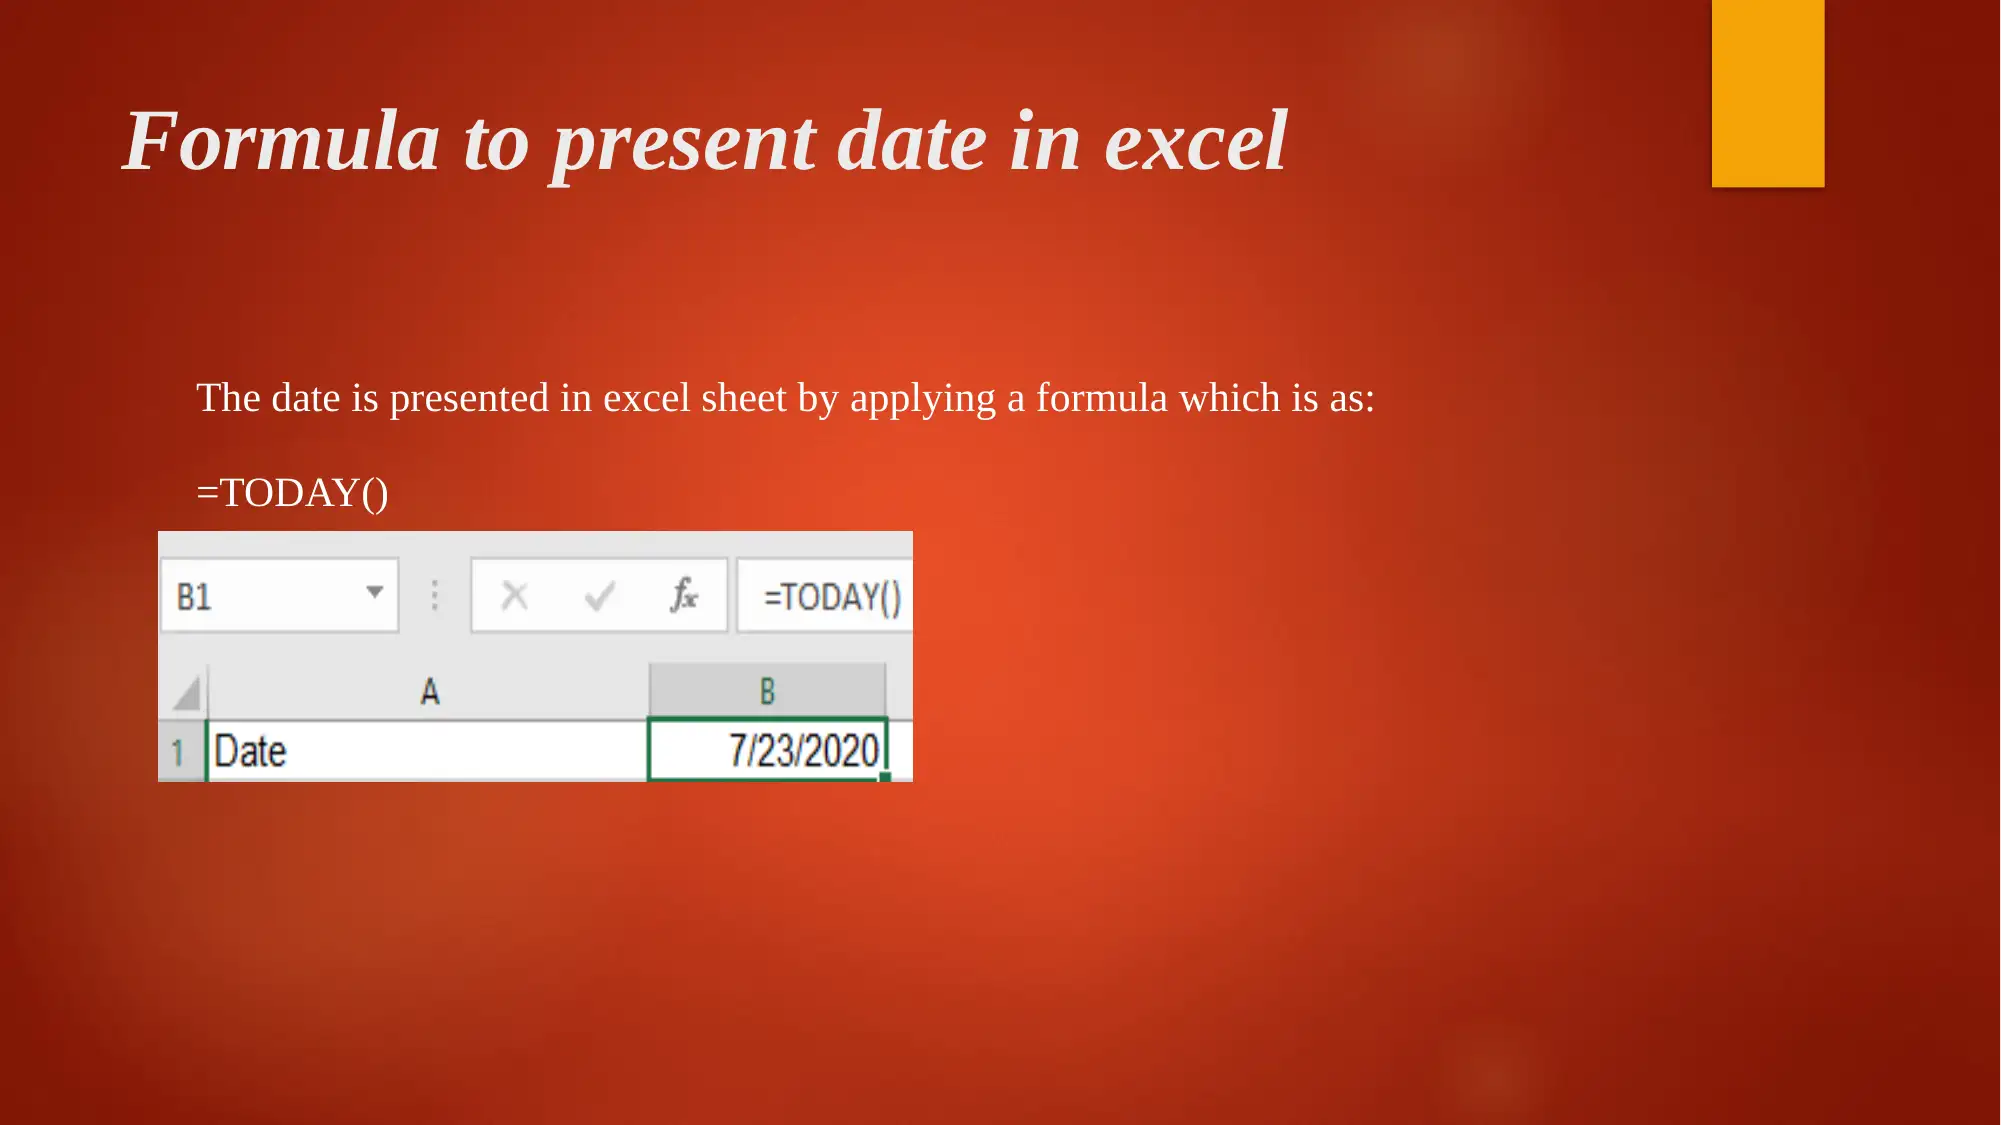
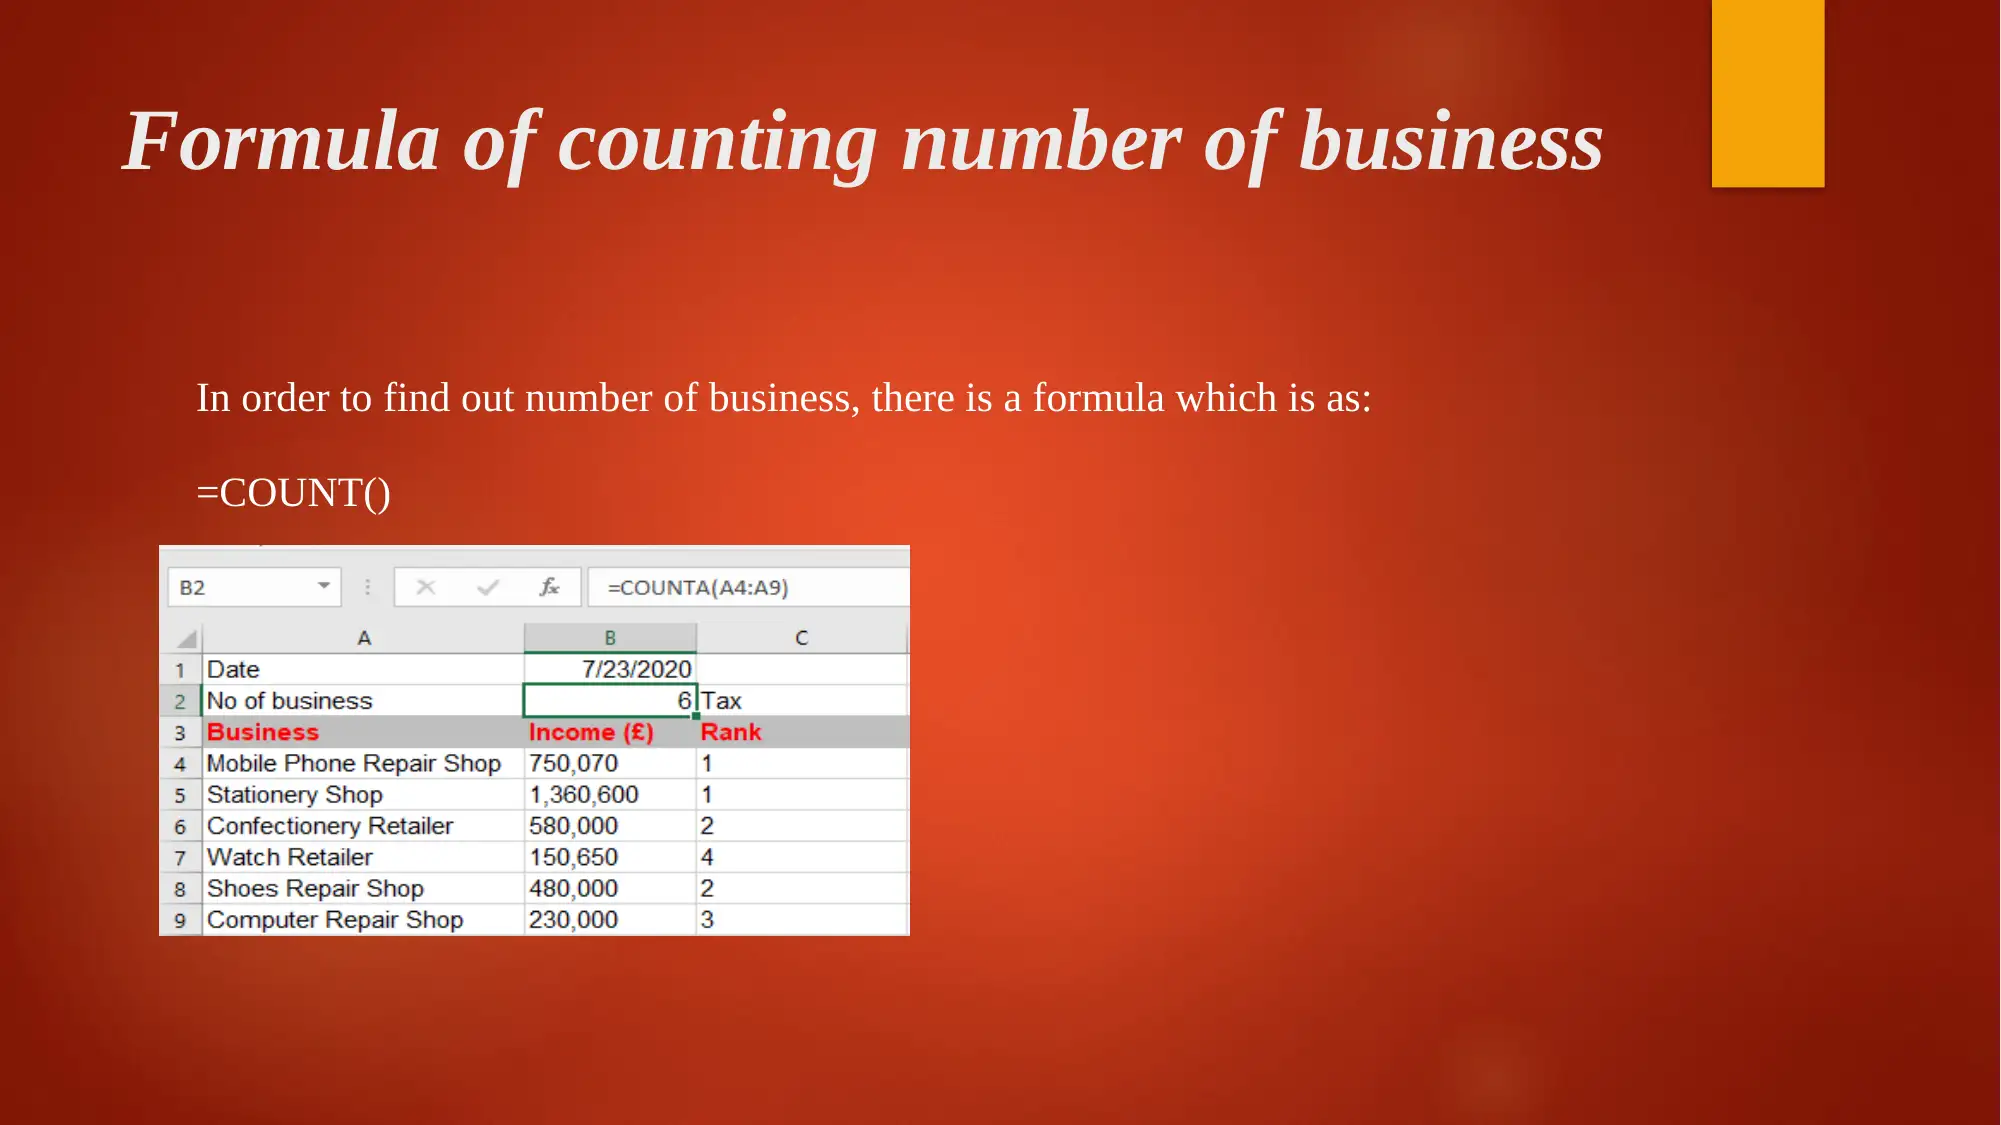
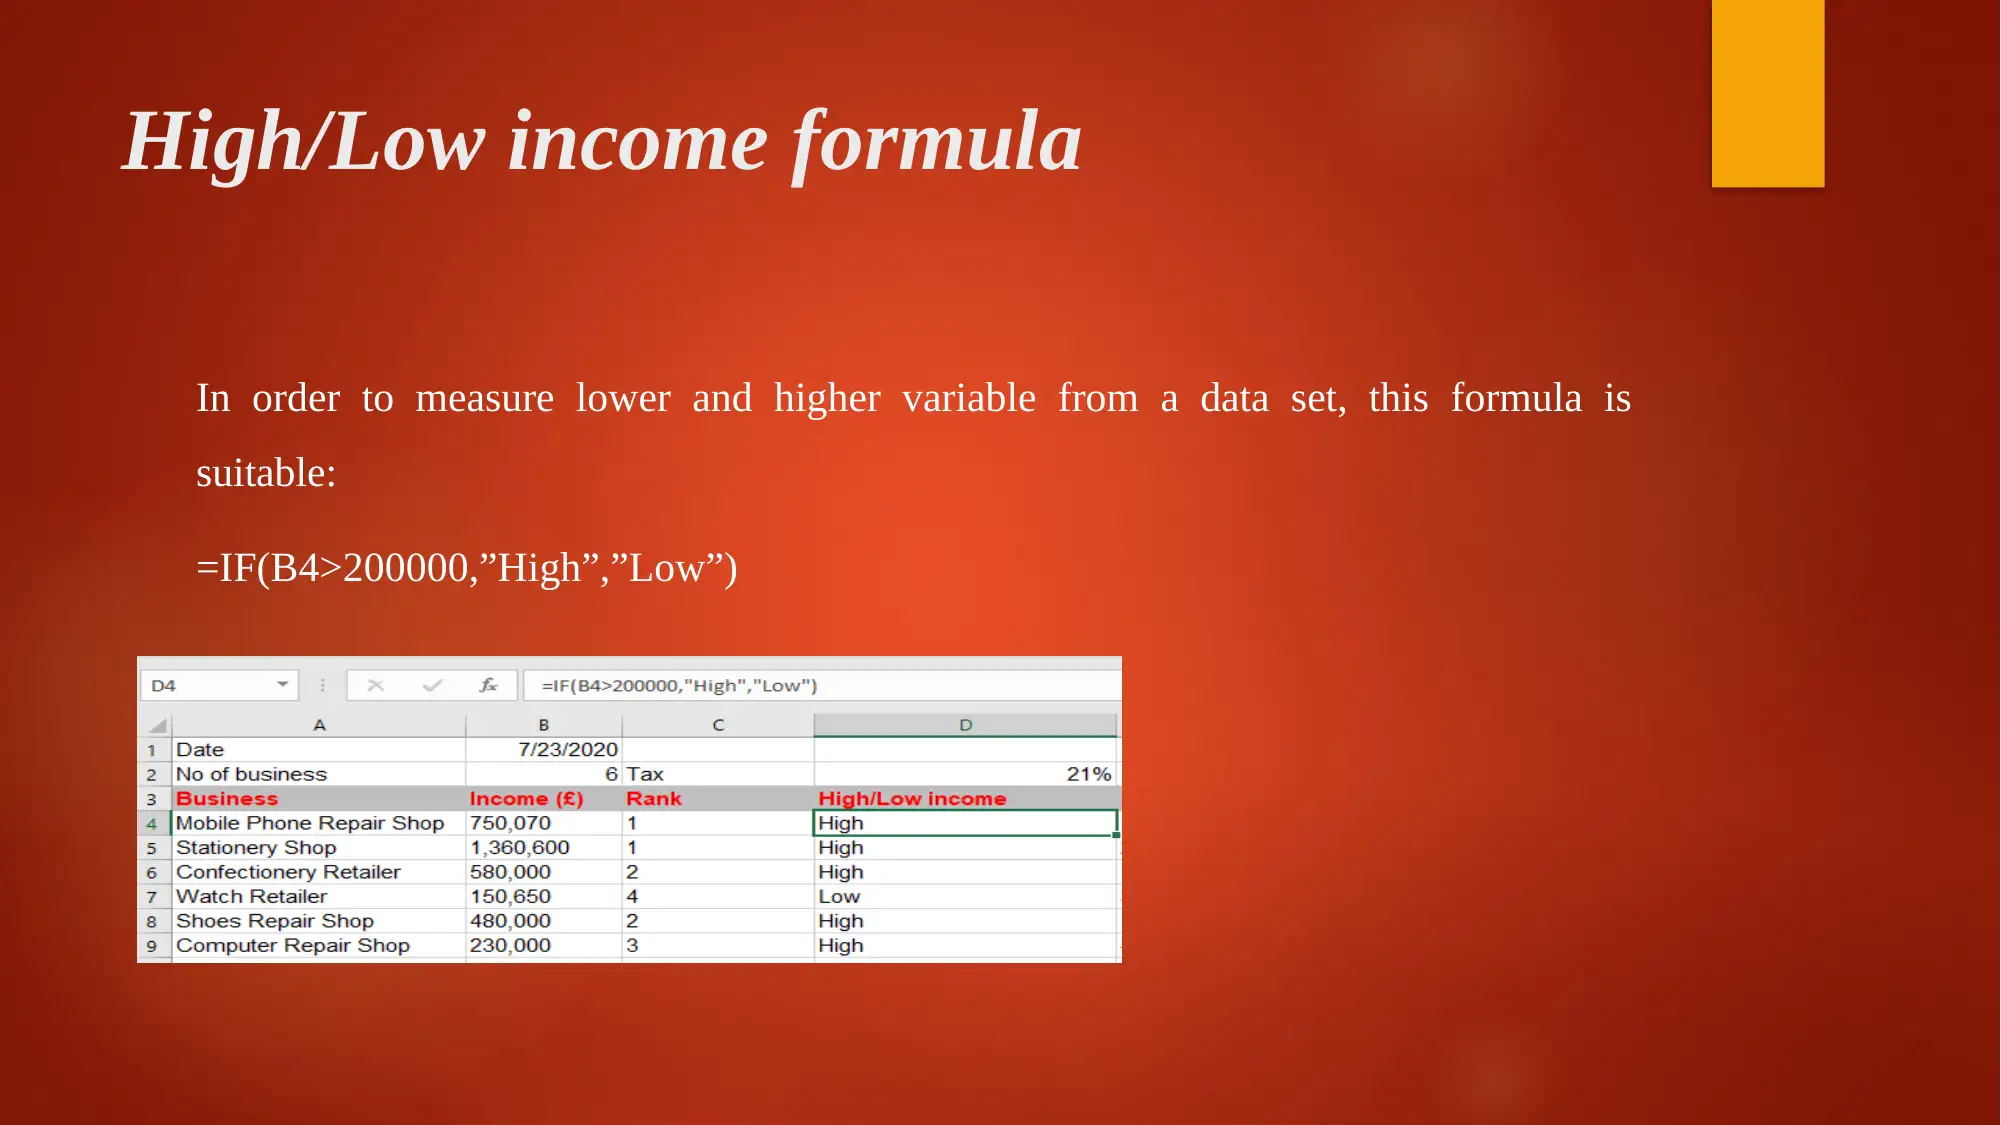
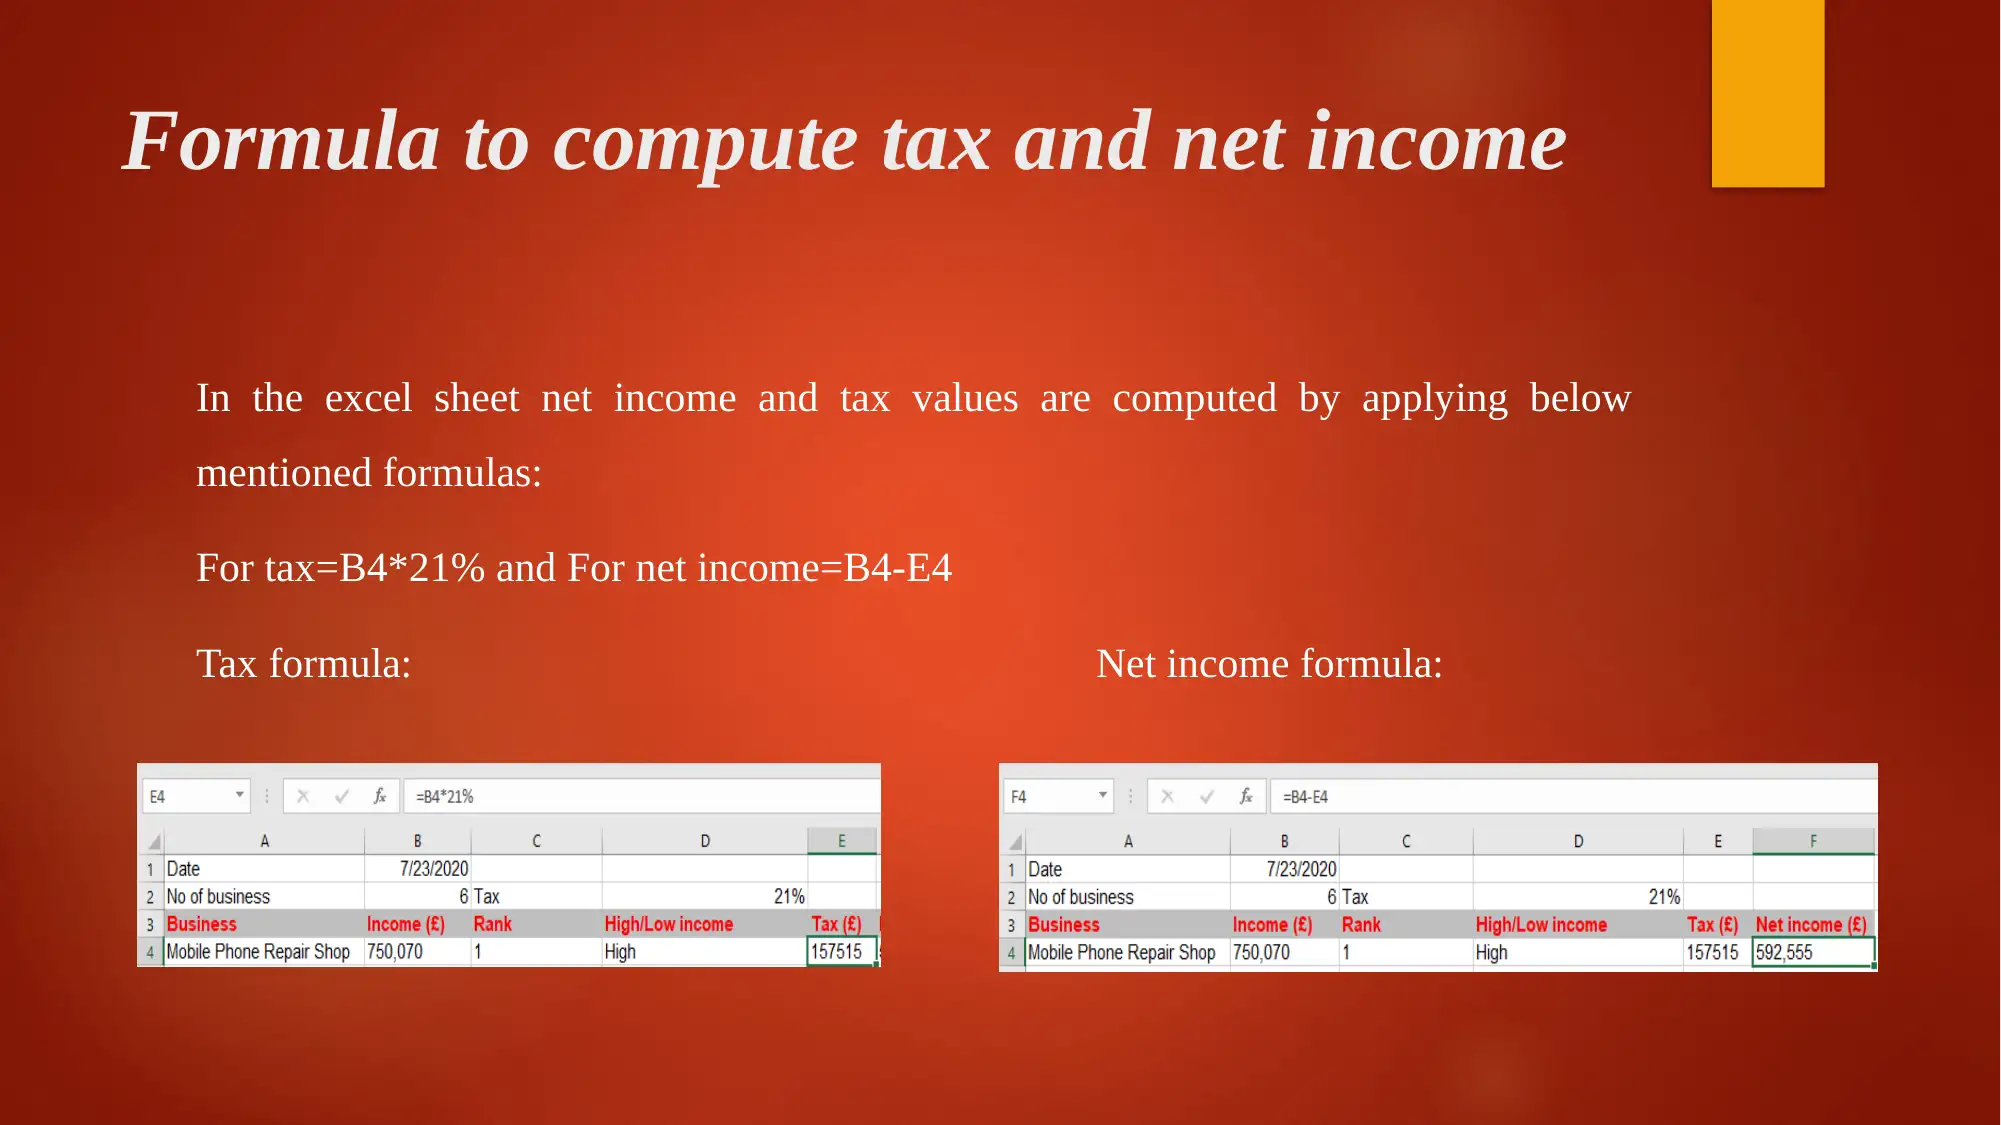
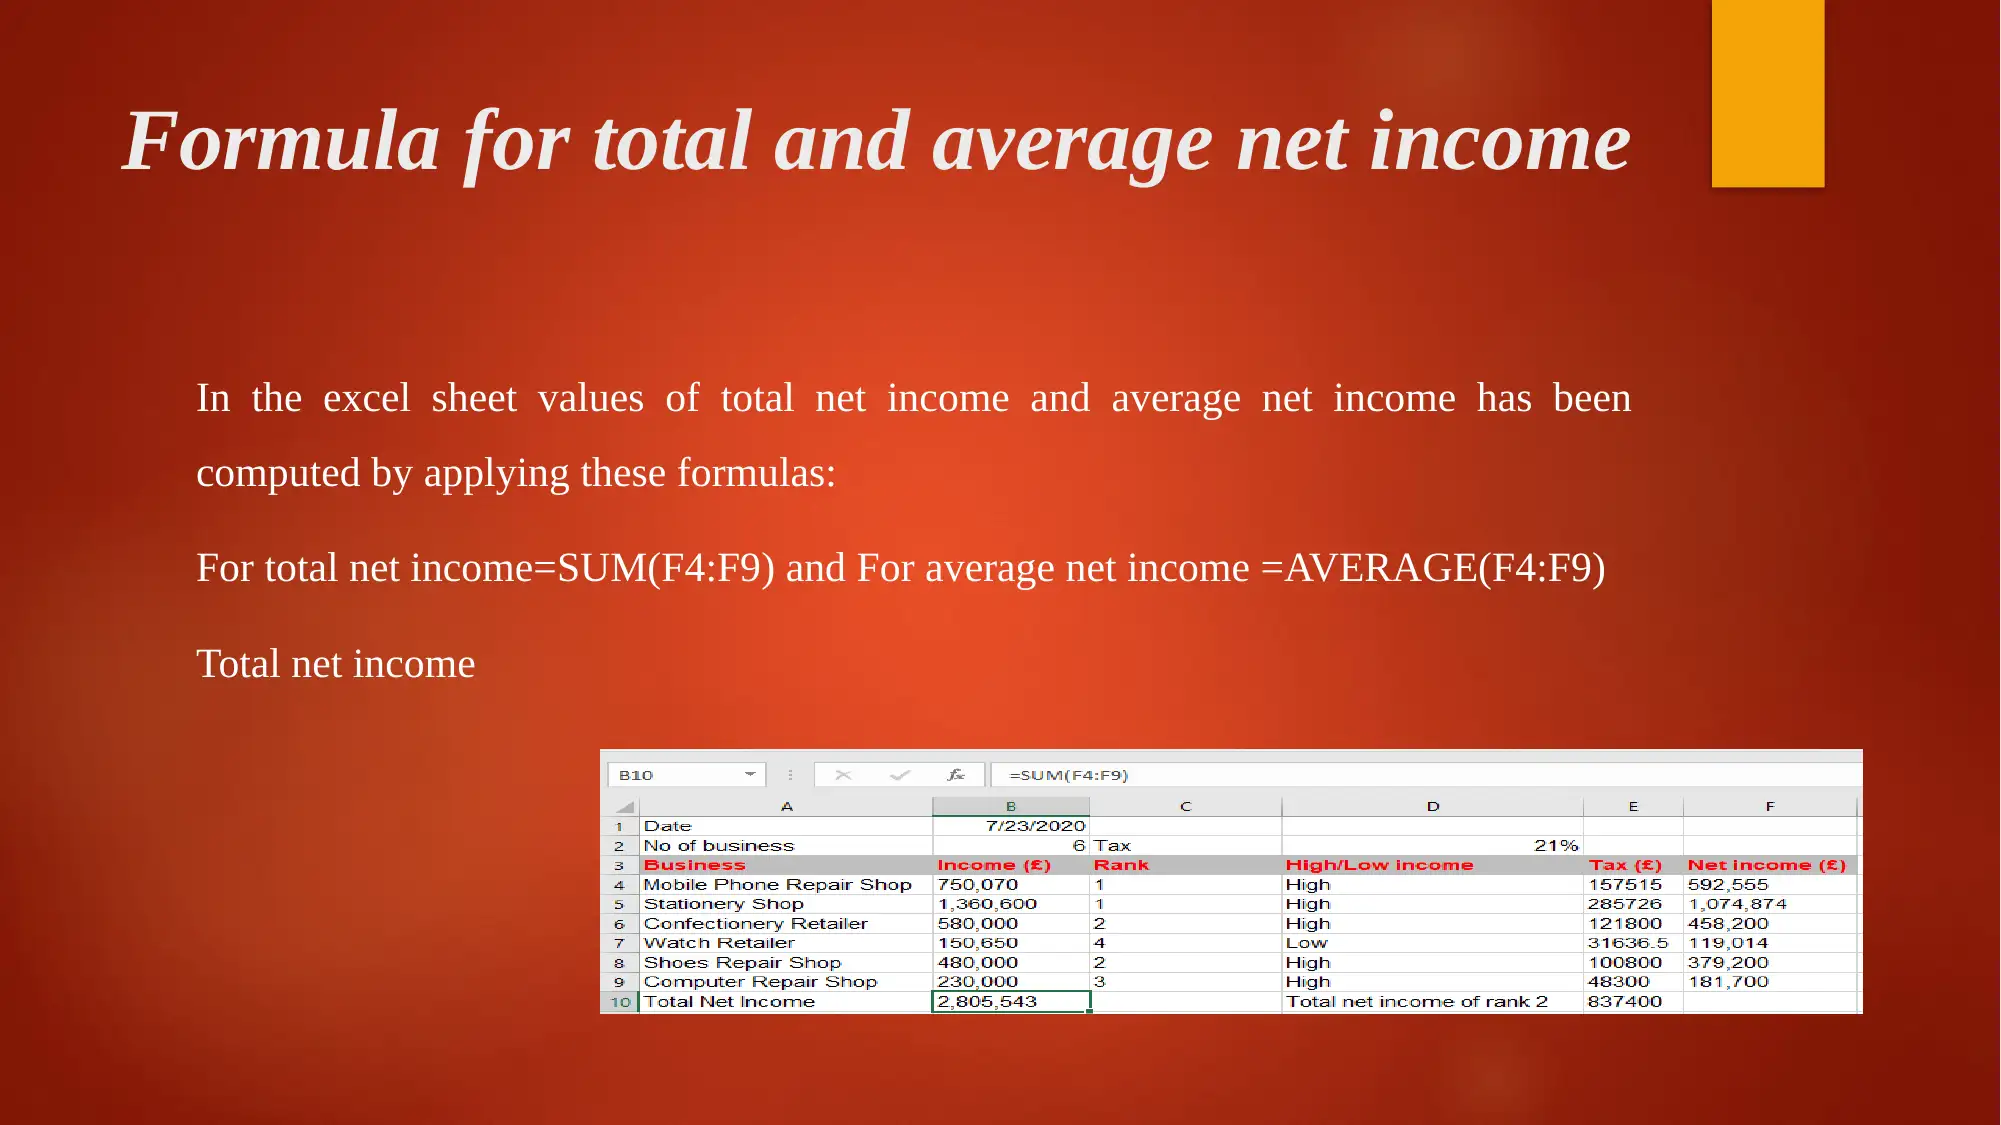
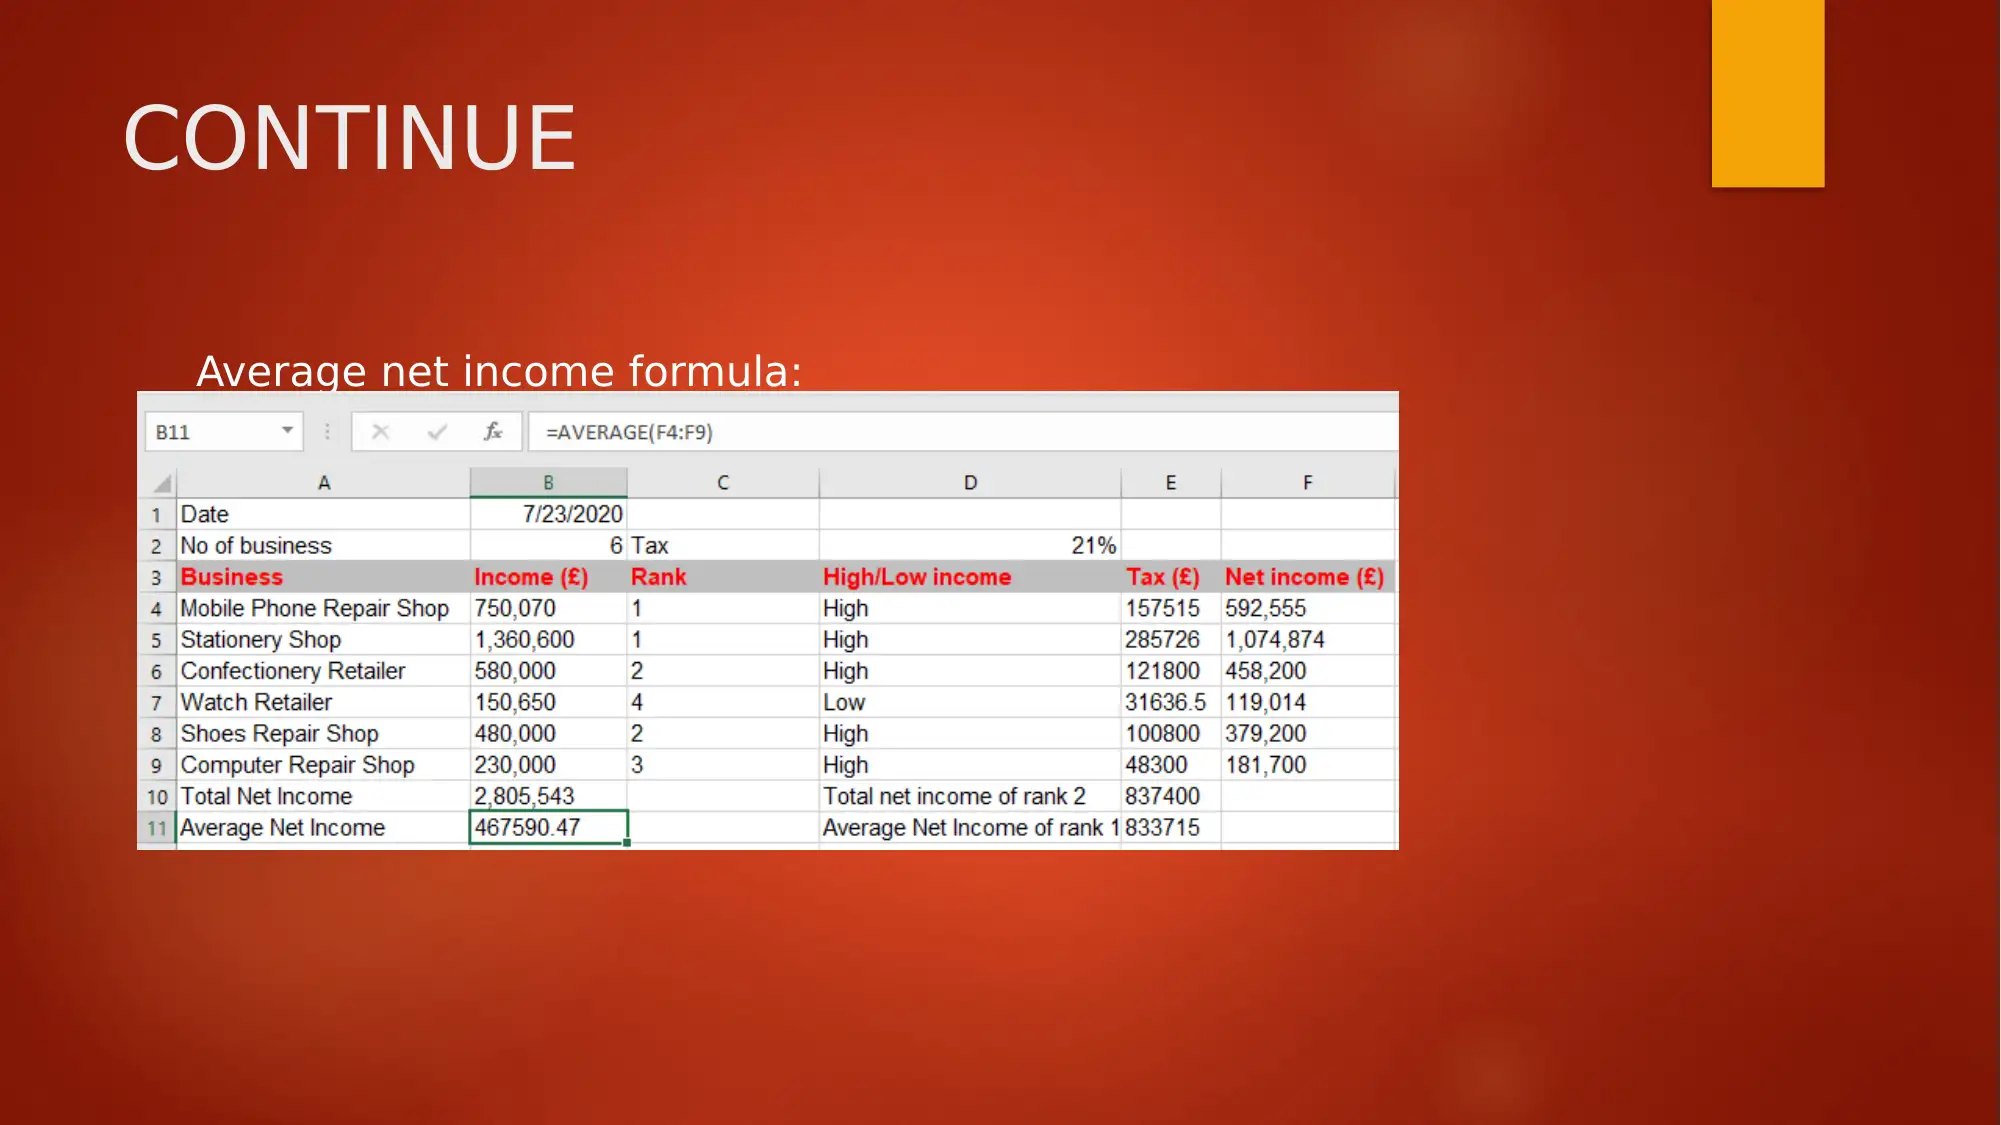
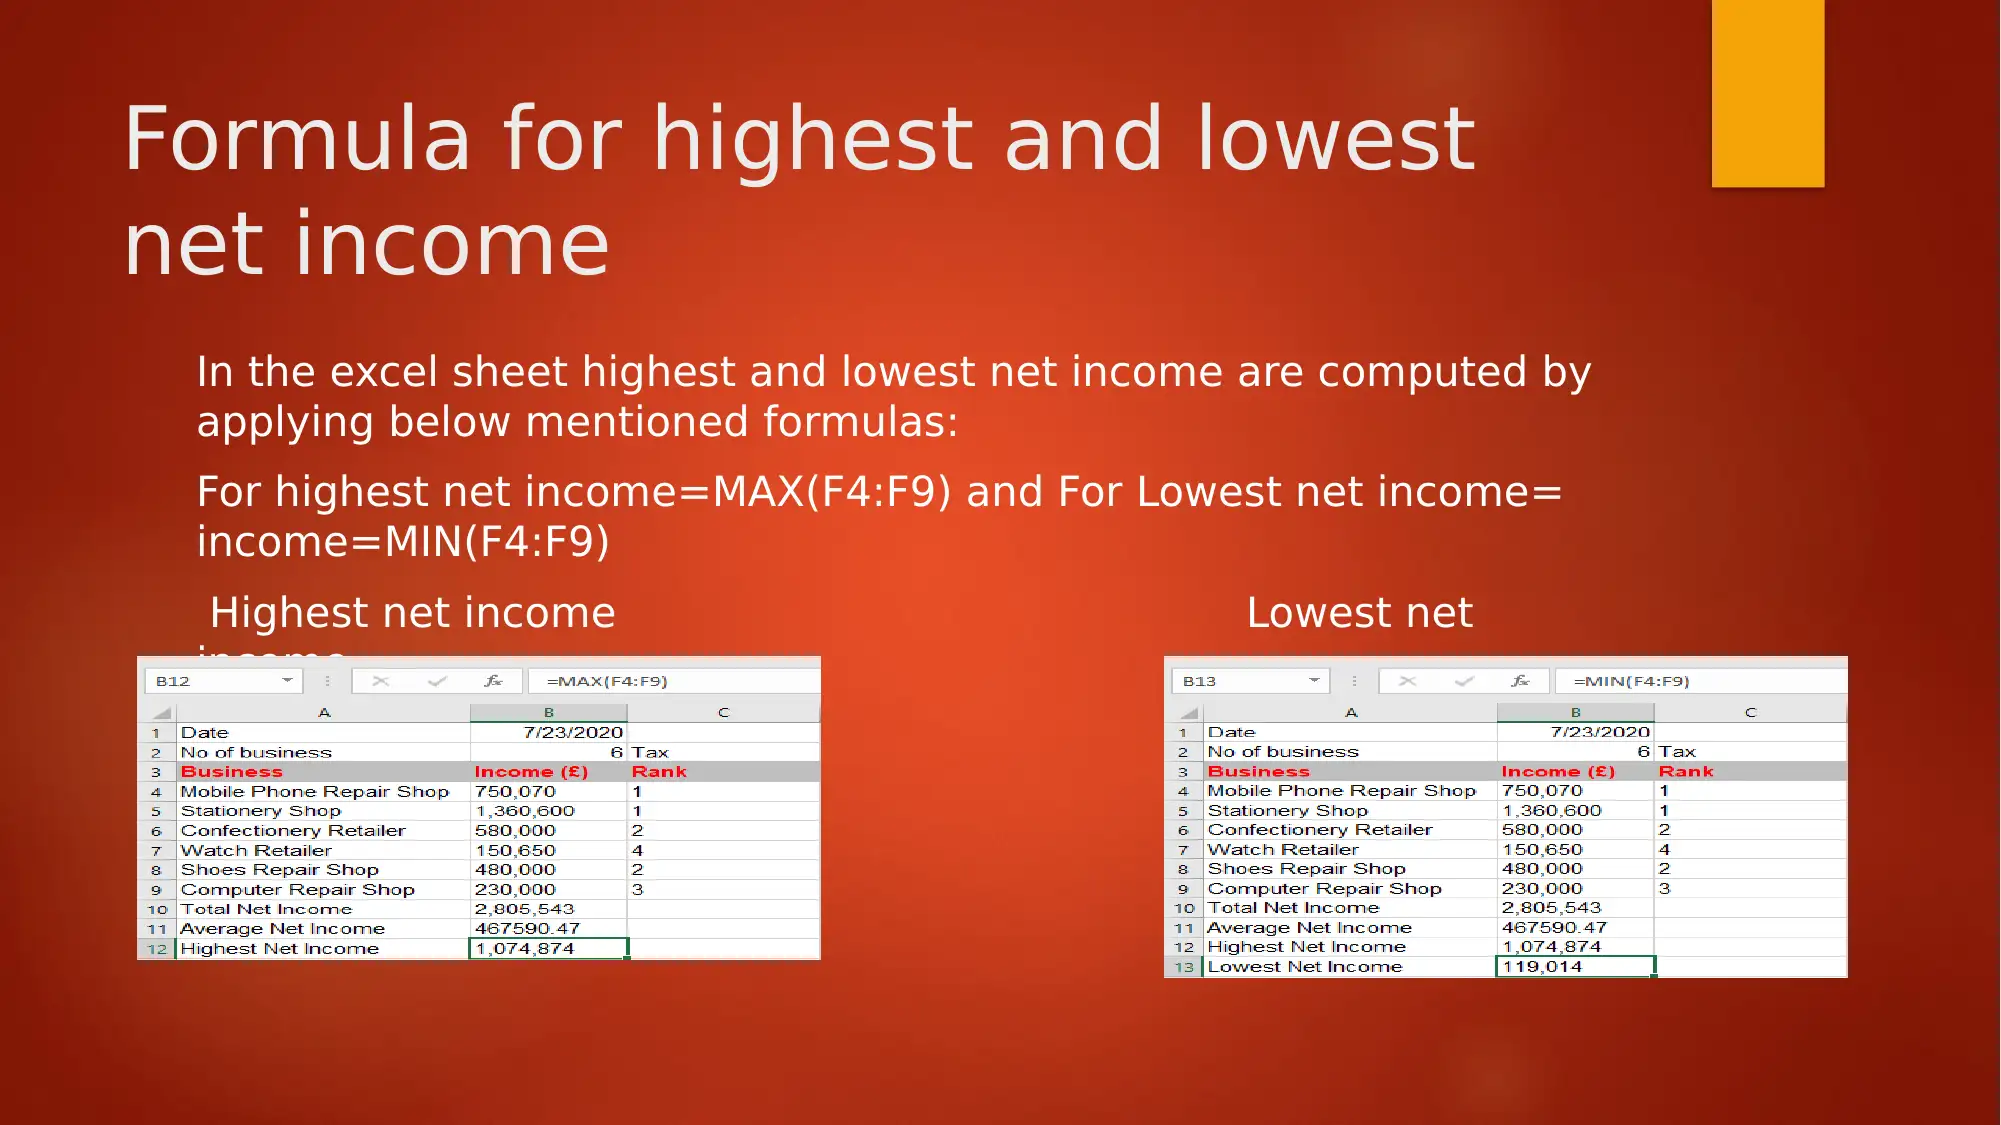
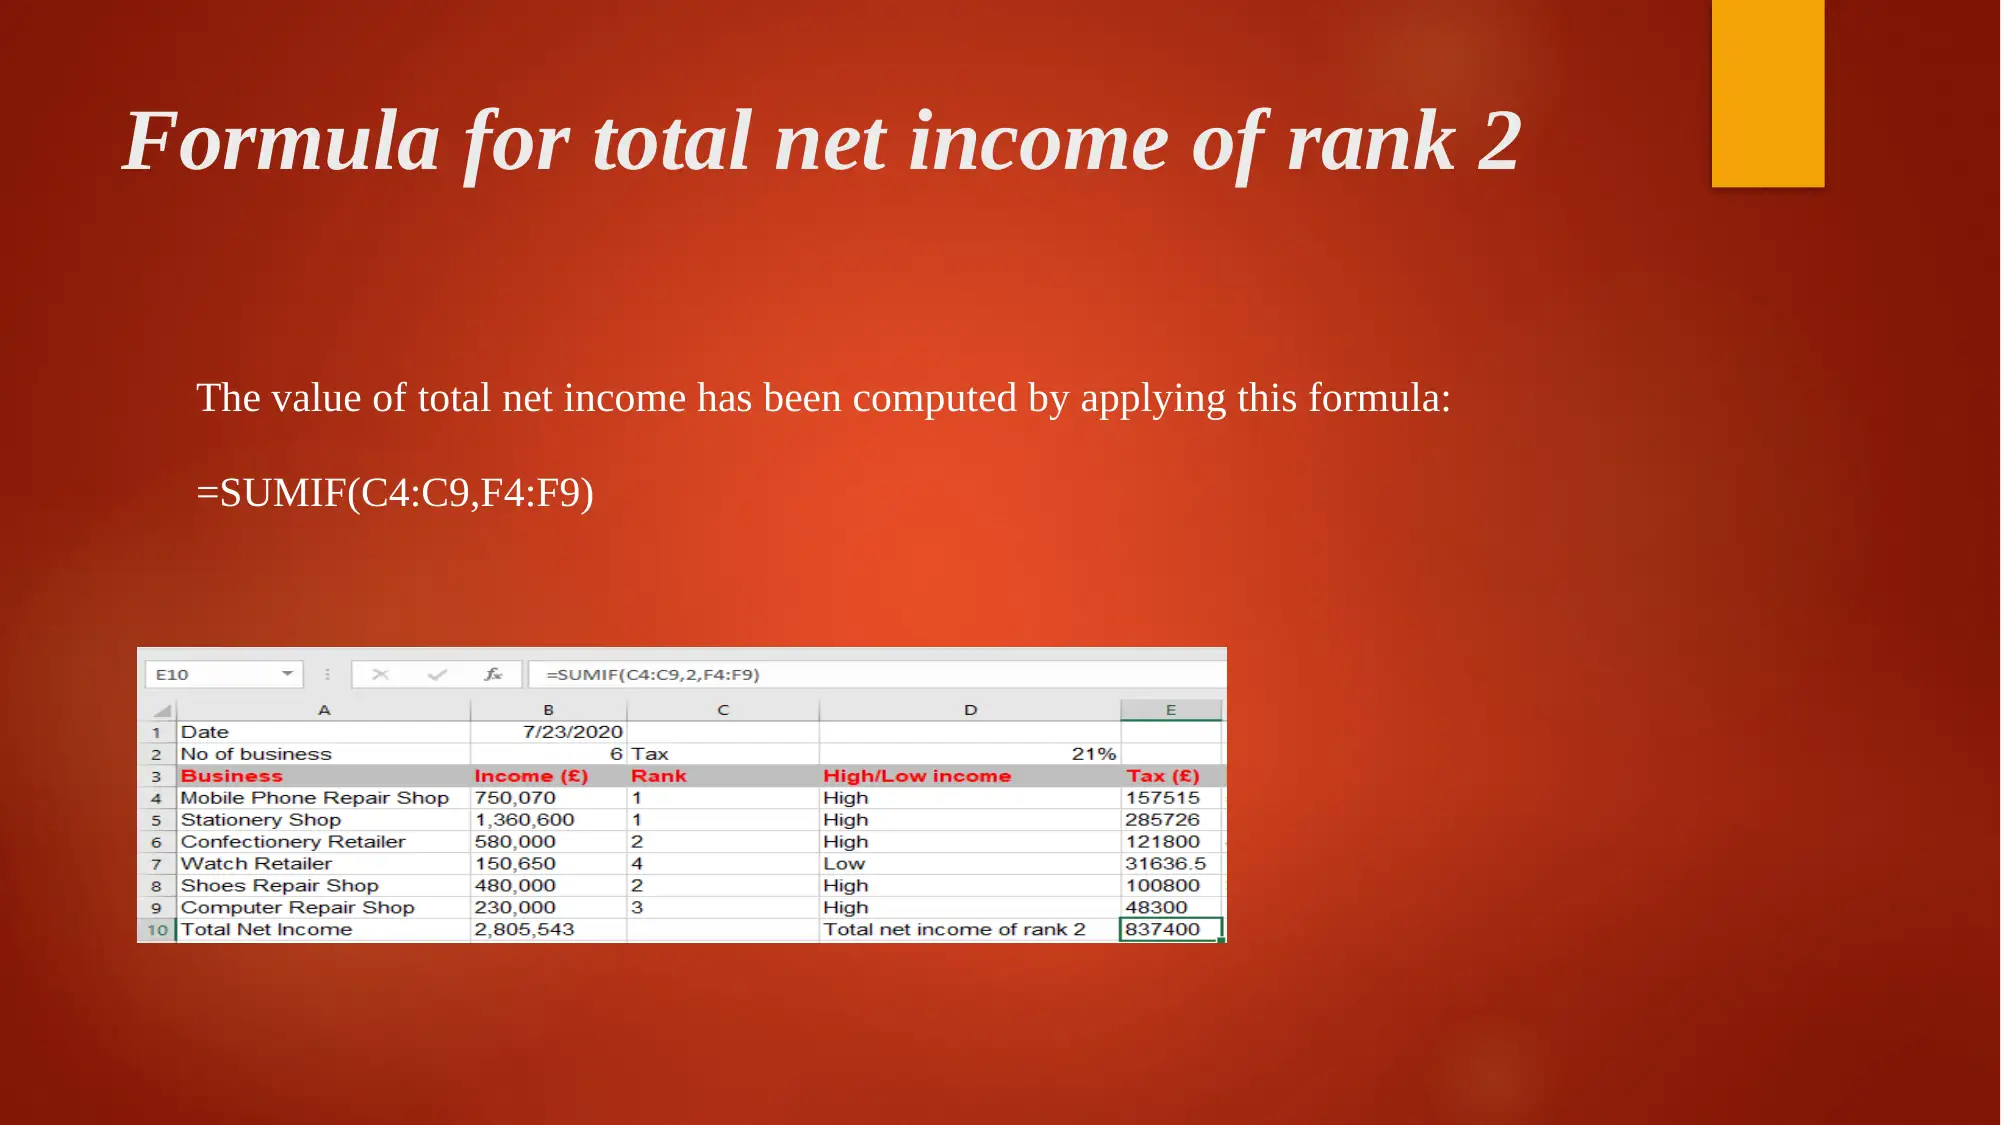
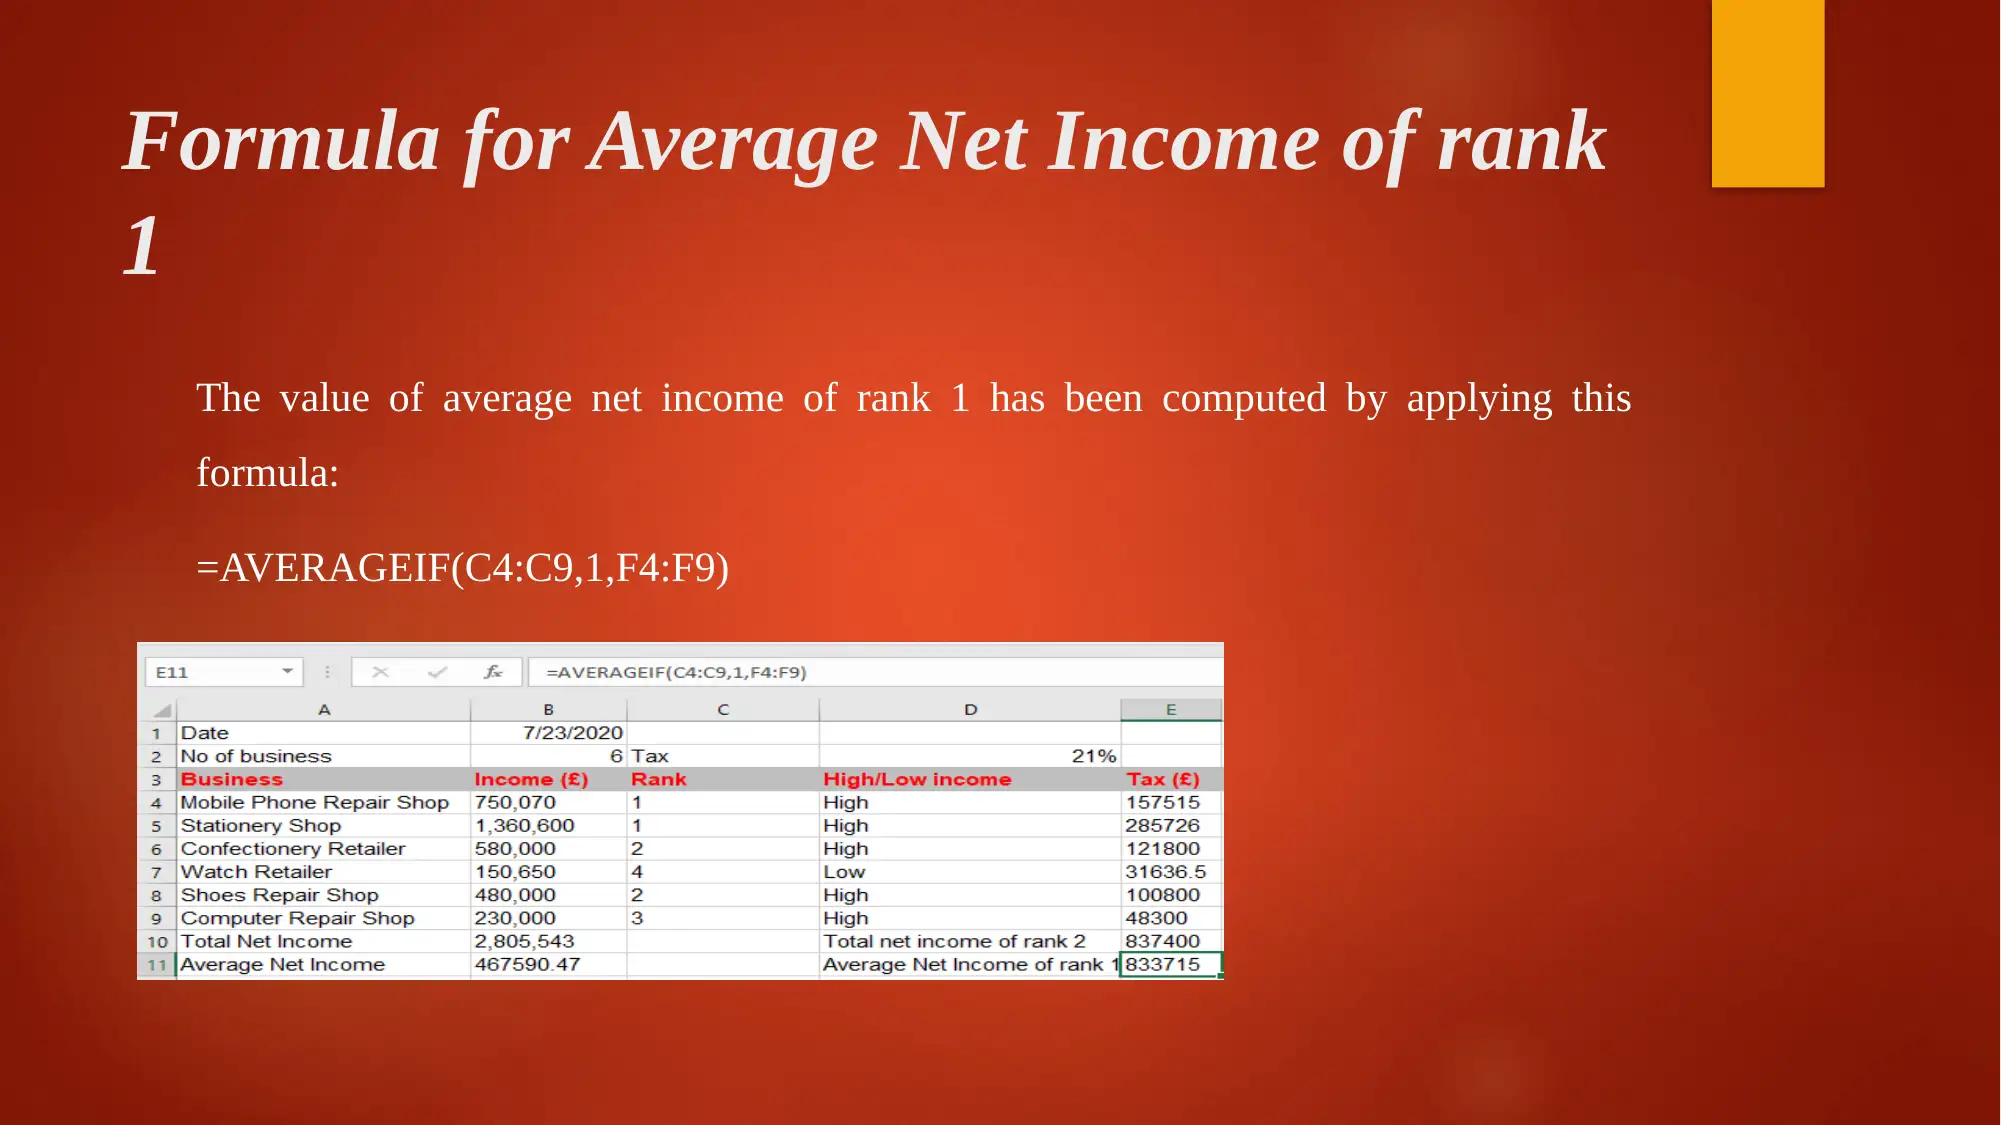
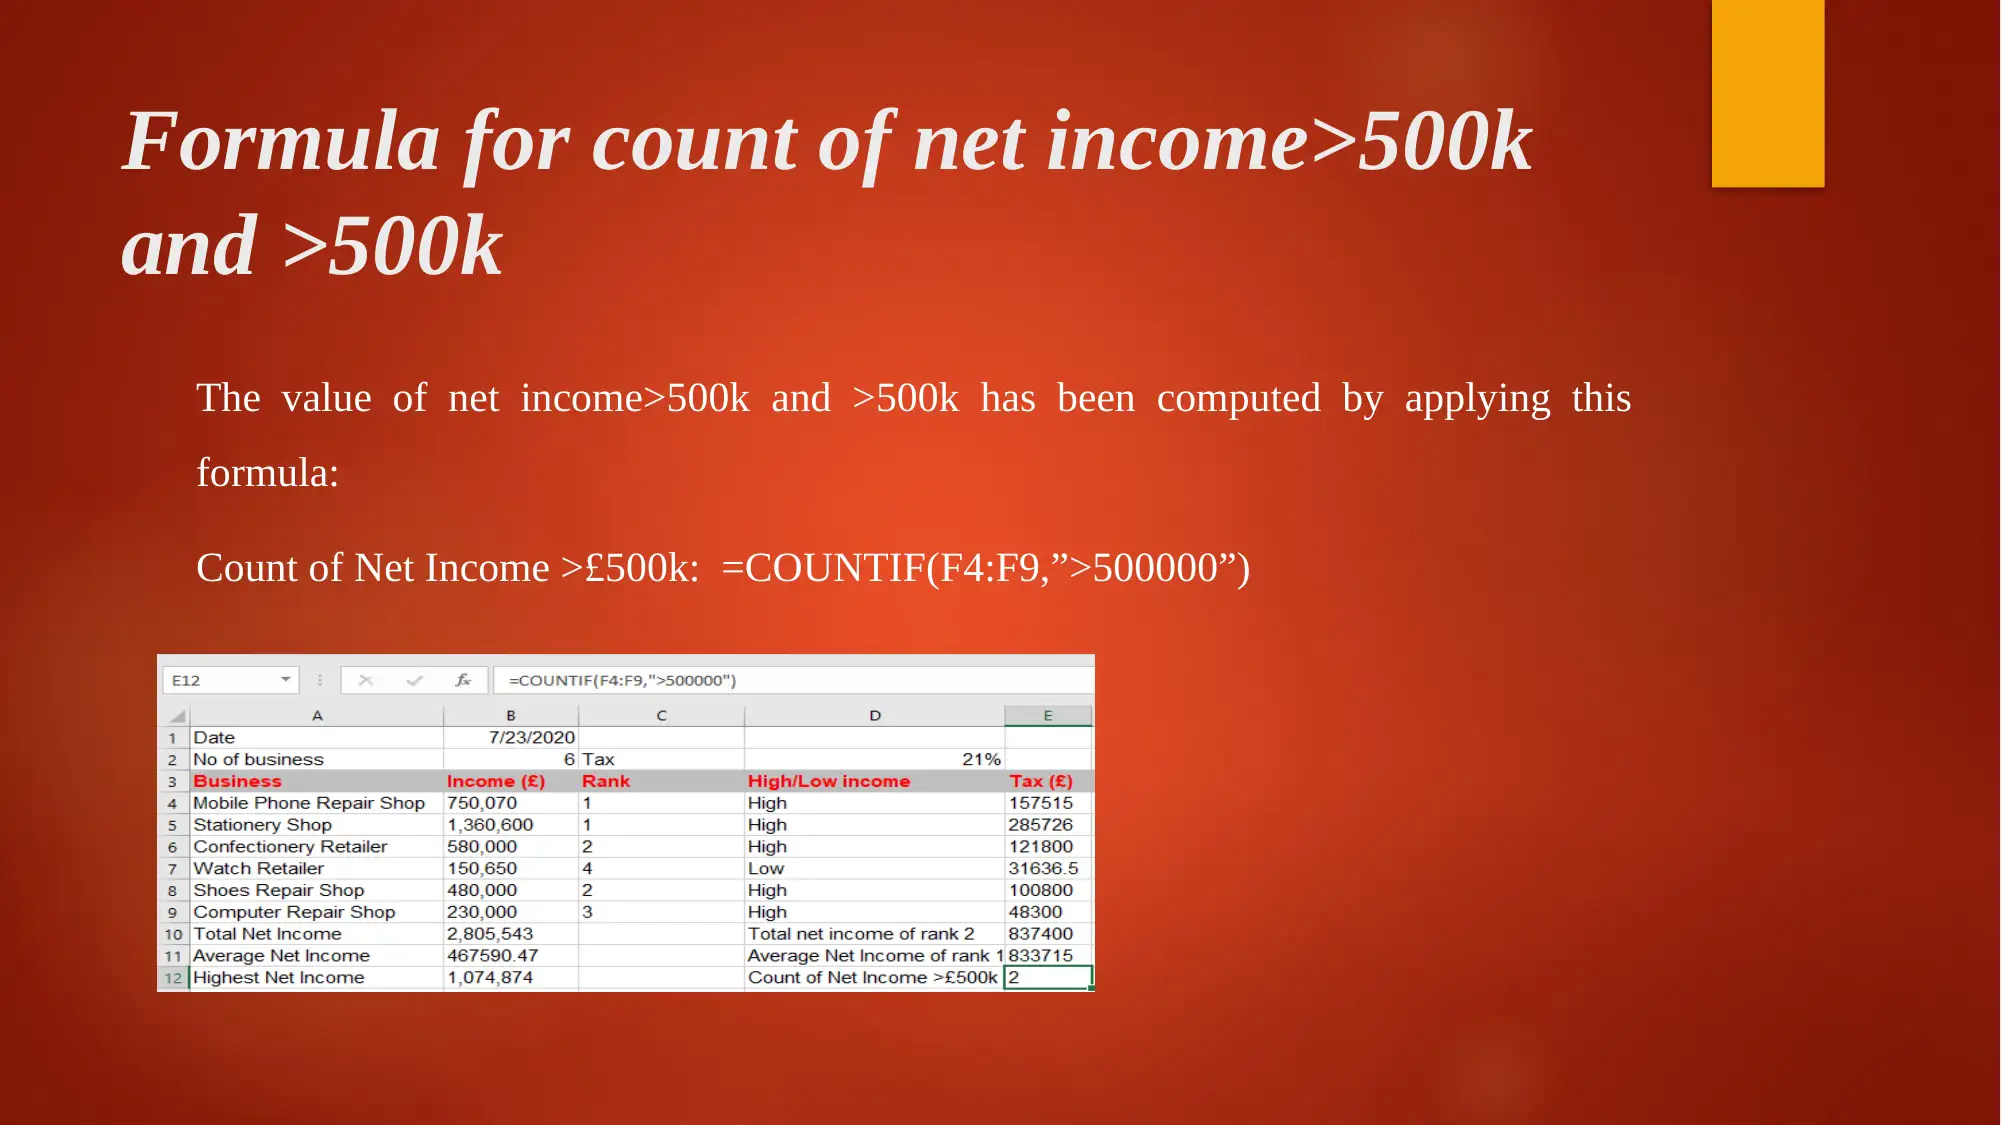
This presentation focuses on the application of Excel formulas for financial data analysis. It covers various formulas, including those for calculating dates, counting business instances, identifying high/low income, computing tax and net income, calculating total and average net income, determining highest and lowest net income, and using SUMIF and AVERAGEIF functions. The presentation demonstrates how these formulas are used to analyze a dataset, providing practical examples and calculations. It highlights the significance of Excel formulas in simplifying data analysis and making informed decisions. The assignment is a presentation that details how to use Excel formulas to analyze financial data effectively.


1 out of 14
Related Documents


Your All-in-One AI-Powered Toolkit for Academic Success.
+13062052269
info@desklib.com
Available 24*7 on WhatsApp / Email
![[object Object]](/_next/static/media/star-bottom.7253800d.svg)
Copyright © 2020–2026 A2Z Services. All Rights Reserved. Developed and managed by ZUCOL.