Excel Analysis: Retail Business Financial Performance Report

Verified

Added on  2020/12/29

|7
|681
|71
Practical Assignment
AI Summary
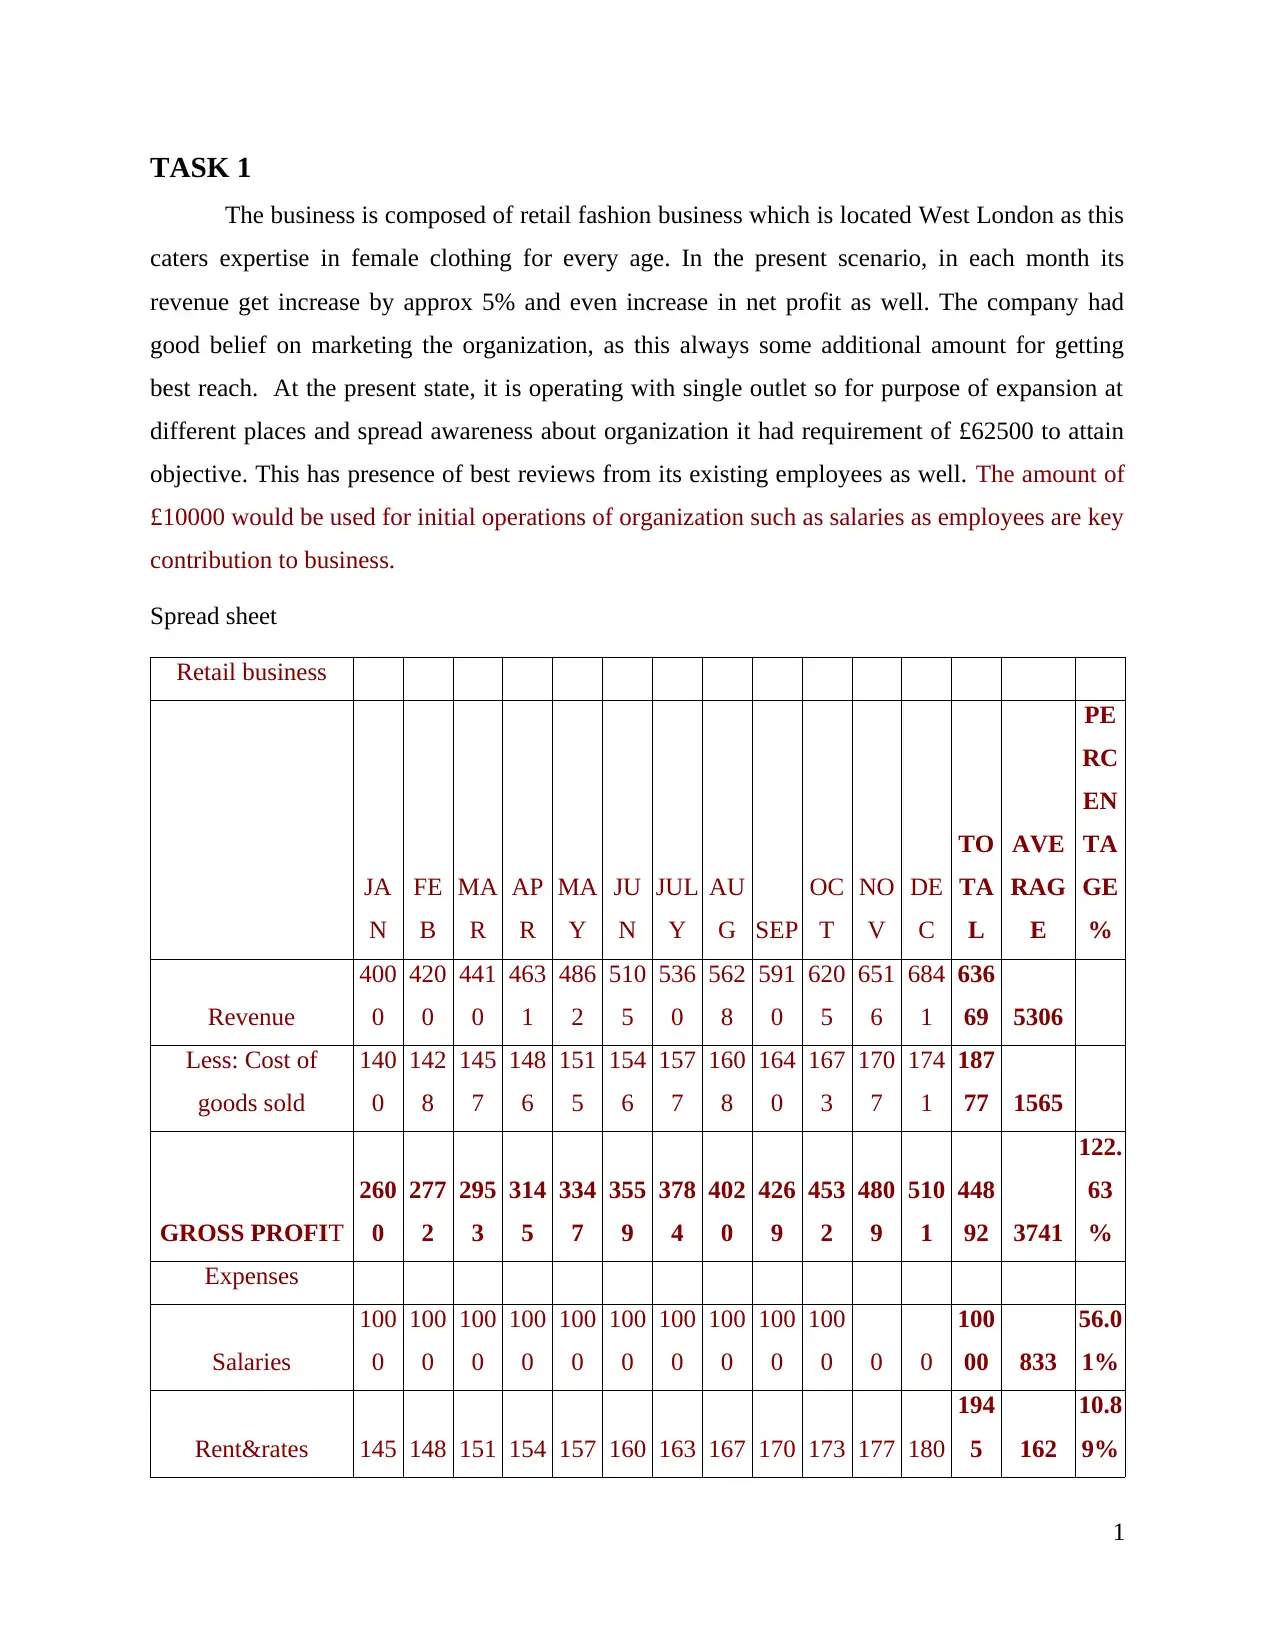
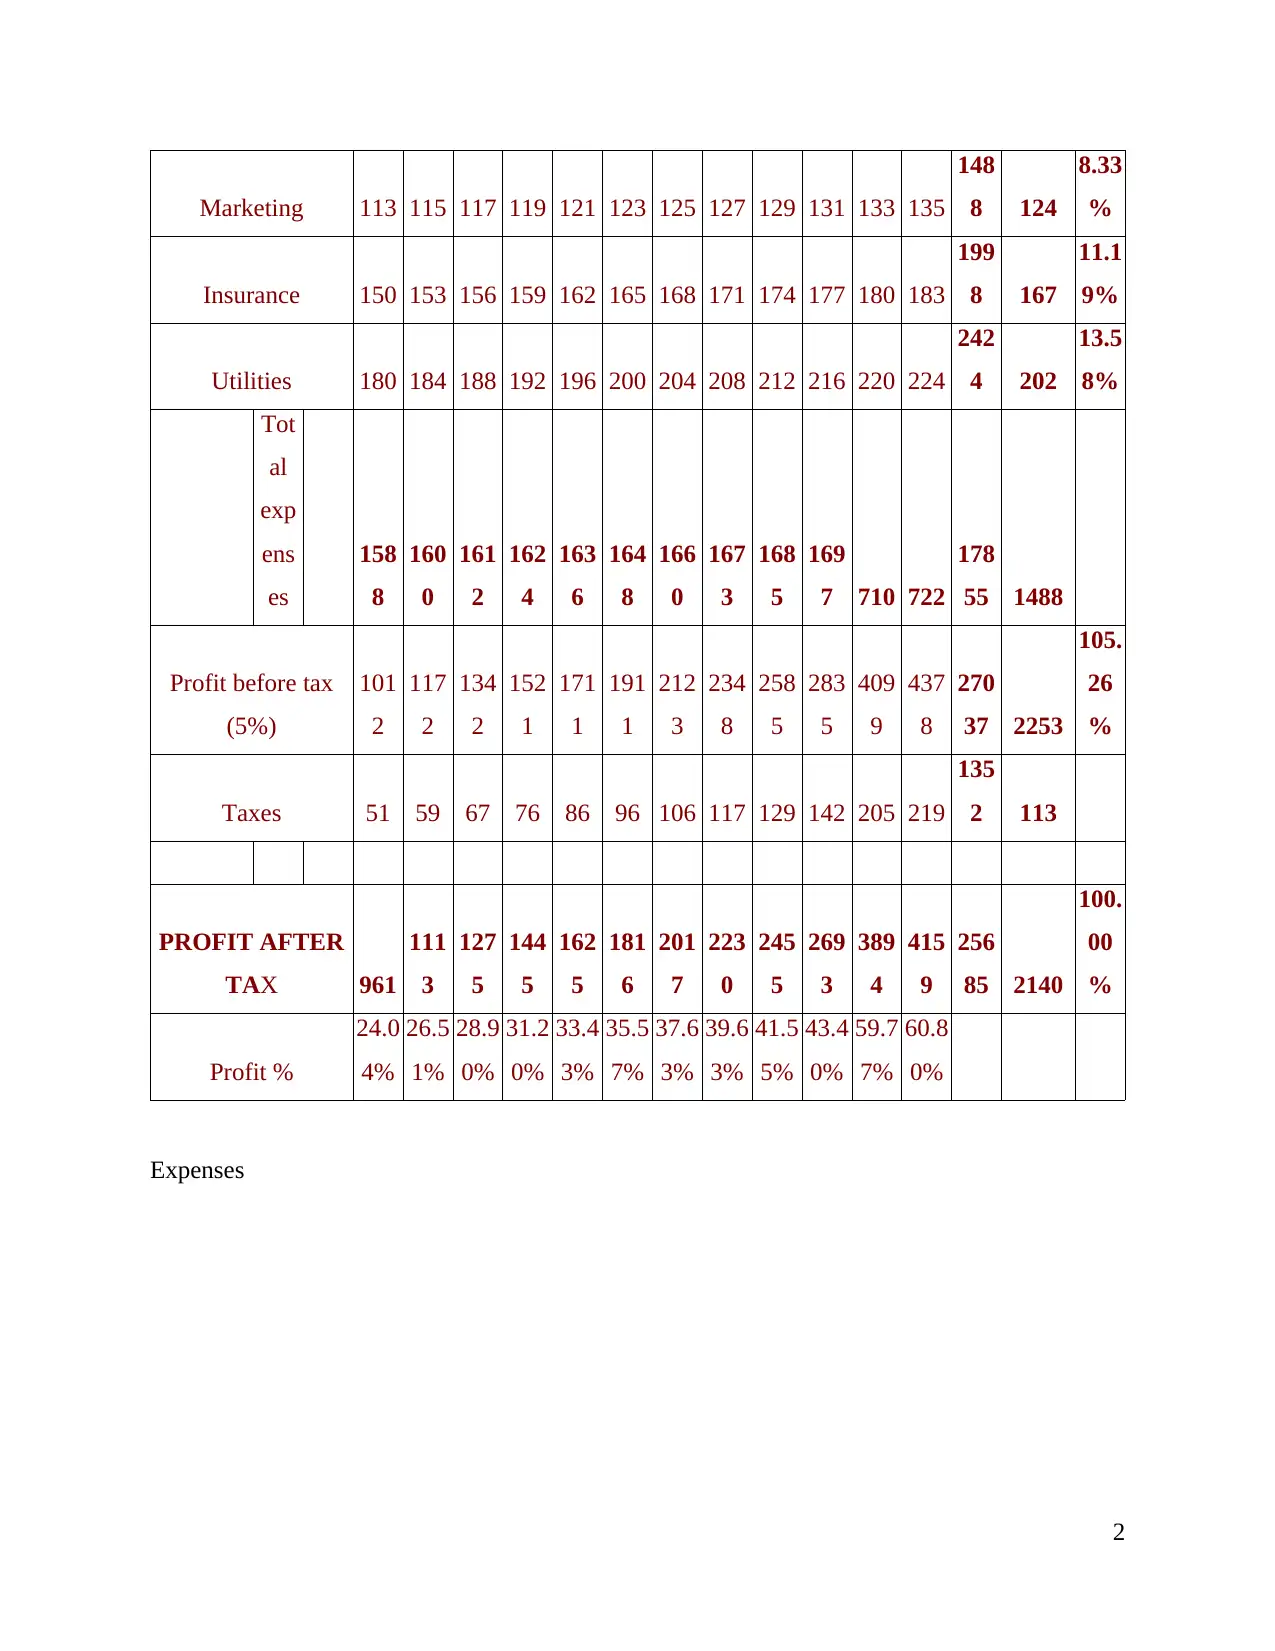
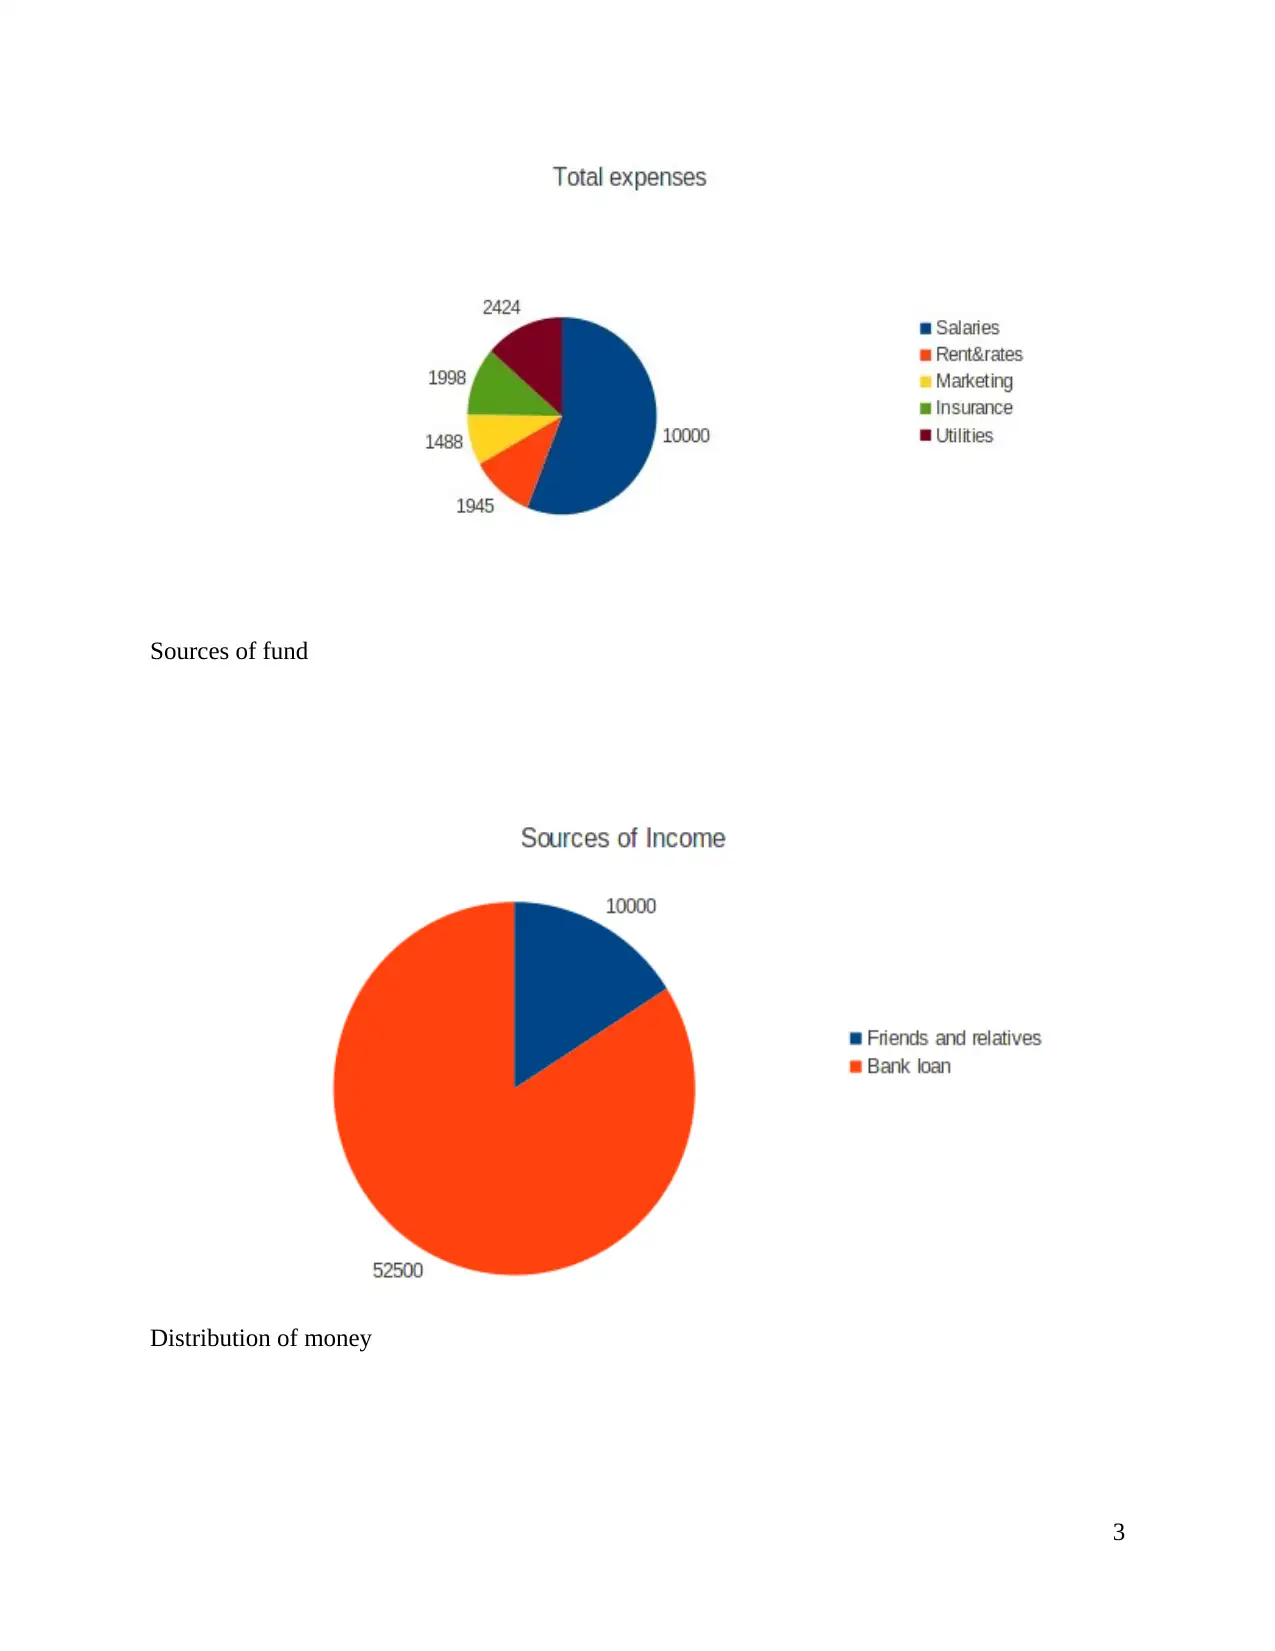
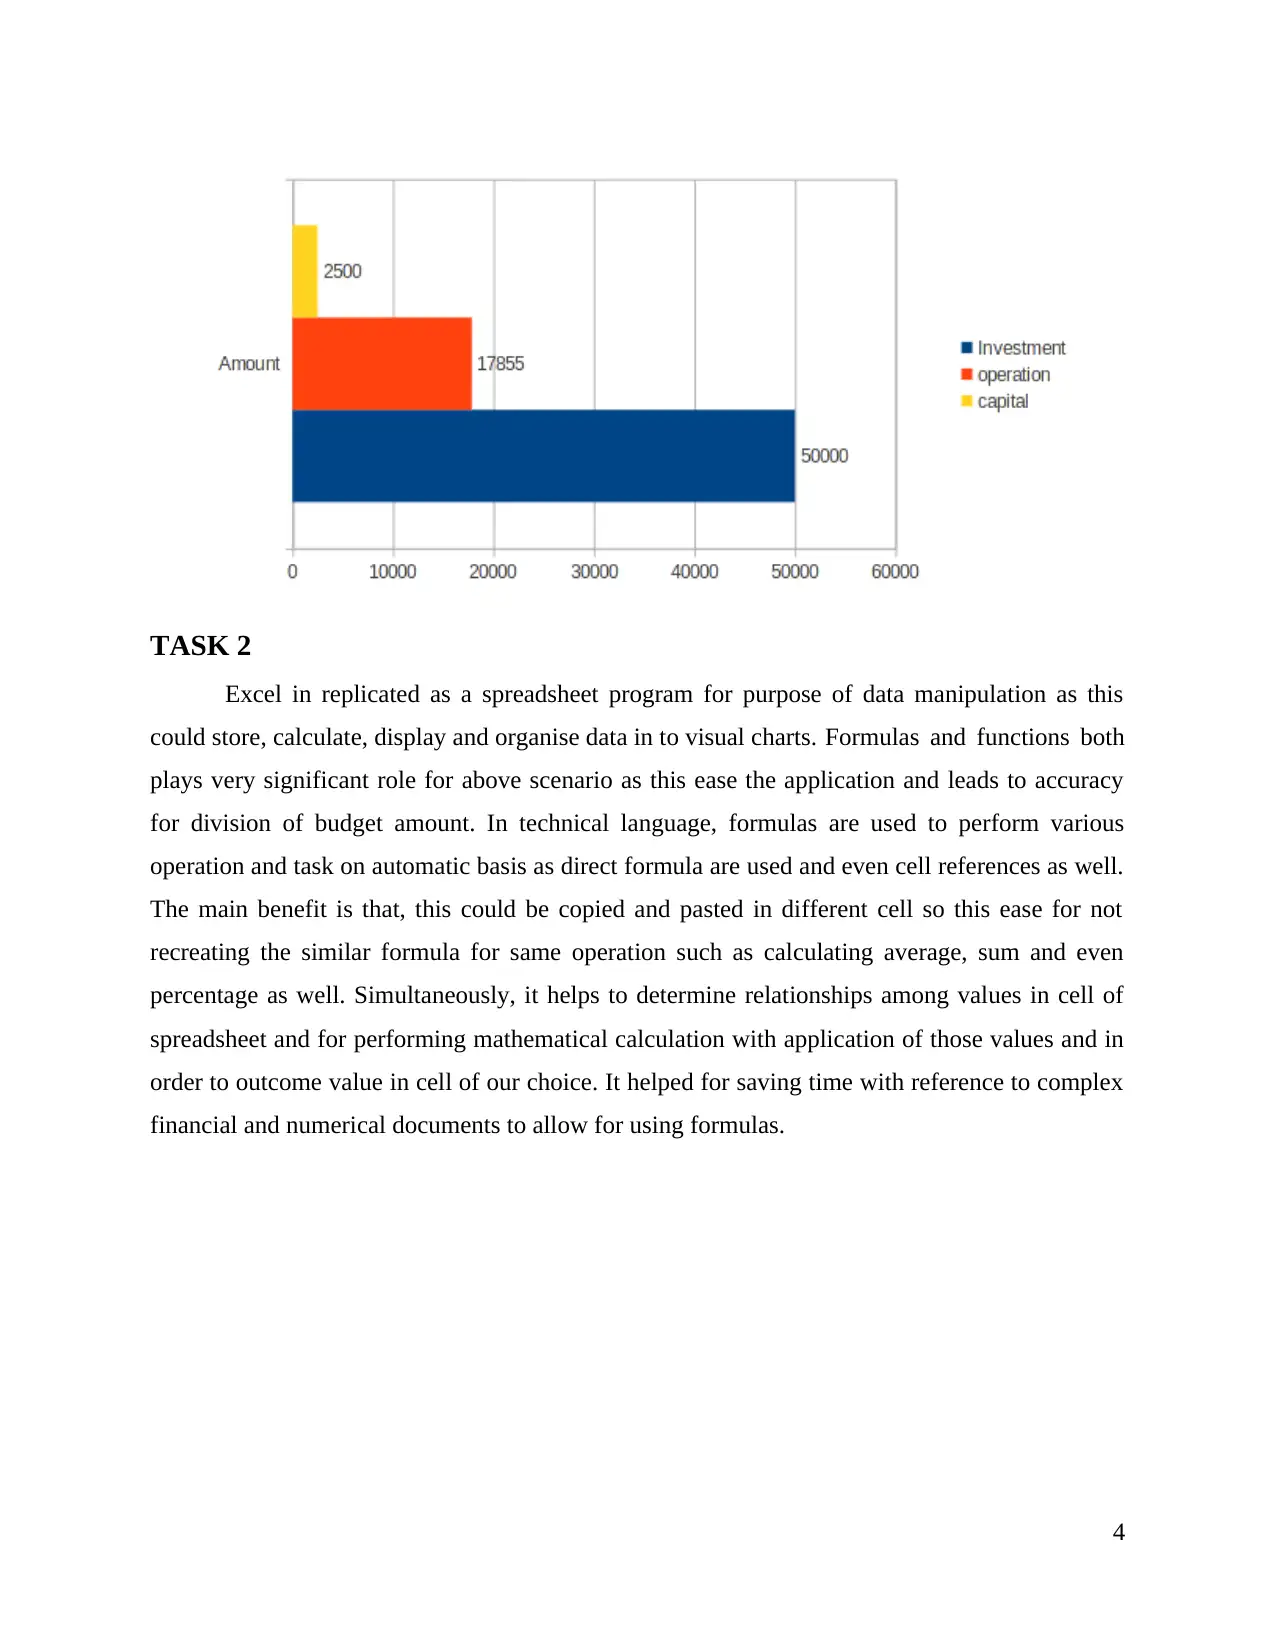
This assignment presents a financial analysis of a retail fashion business located in West London, specializing in female clothing. The analysis, conducted using Excel, examines the business's revenue, cost of goods sold, gross profit, and various expenses such as salaries, rent, marketing, insurance, and utilities over a year. The spreadsheet includes detailed calculations of monthly and total figures, along with percentage analysis, revealing the business's financial performance, including profit before and after tax. The analysis also covers the sources and distribution of funds, outlining the financial requirements for business expansion and operational costs. Furthermore, the assignment explains the role of Excel in data manipulation, highlighting the significance of formulas and functions for automating calculations and ensuring accuracy in financial reporting, including the ability to calculate averages, sums, and percentages efficiently.
Document Page
EXCEL ANALYSIS
tabler-icon-diamond-filled.svg

Secure Best Marks with AI Grader

Need help grading? Try our AI Grader for instant feedback on your assignments.
Document Page
TABLE OF CONTENTS
TASK 1............................................................................................................................................1
TASK 2............................................................................................................................................3
Document Page
TASK 1
The business is composed of retail fashion business which is located West London as this
caters expertise in female clothing for every age. In the present scenario, in each month its
revenue get increase by approx 5% and even increase in net profit as well. The company had
good belief on marketing the organization, as this always some additional amount for getting
best reach. At the present state, it is operating with single outlet so for purpose of expansion at
different places and spread awareness about organization it had requirement of £62500 to attain
objective. This has presence of best reviews from its existing employees as well. The amount of
£10000 would be used for initial operations of organization such as salaries as employees are key
contribution to business.
Spread sheet
Retail business
JA
N
FE
B
MA
R
AP
R
MA
Y
JU
N
JUL
Y
AU
G SEP
OC
T
NO
V
DE
C
TO
TA
L
AVE
RAG
E
PE
RC
EN
TA
GE
%
Revenue
400
0
420
0
441
0
463
1
486
2
510
5
536
0
562
8
591
0
620
5
651
6
684
1
636
69 5306
Less: Cost of
goods sold
140
0
142
8
145
7
148
6
151
5
154
6
157
7
160
8
164
0
167
3
170
7
174
1
187
77 1565
GROSS PROFIT
260
0
277
2
295
3
314
5
334
7
355
9
378
4
402
0
426
9
453
2
480
9
510
1
448
92 3741
122.
63
%
Expenses
Salaries
100
0
100
0
100
0
100
0
100
0
100
0
100
0
100
0
100
0
100
0 0 0
100
00 833
56.0
1%
Rent&rates 145 148 151 154 157 160 163 167 170 173 177 180
194
5 162
10.8
9%
1
Document Page
Marketing 113 115 117 119 121 123 125 127 129 131 133 135
148
8 124
8.33
%
Insurance 150 153 156 159 162 165 168 171 174 177 180 183
199
8 167
11.1
9%
Utilities 180 184 188 192 196 200 204 208 212 216 220 224
242
4 202
13.5
8%
Tot
al
exp
ens
es
158
8
160
0
161
2
162
4
163
6
164
8
166
0
167
3
168
5
169
7 710 722
178
55 1488
Profit before tax
(5%)
101
2
117
2
134
2
152
1
171
1
191
1
212
3
234
8
258
5
283
5
409
9
437
8
270
37 2253
105.
26
%
Taxes 51 59 67 76 86 96 106 117 129 142 205 219
135
2 113
PROFIT AFTER
TAX 961
111
3
127
5
144
5
162
5
181
6
201
7
223
0
245
5
269
3
389
4
415
9
256
85 2140
100.
00
%
Profit %
24.0
4%
26.5
1%
28.9
0%
31.2
0%
33.4
3%
35.5
7%
37.6
3%
39.6
3%
41.5
5%
43.4
0%
59.7
7%
60.8
0%
Expenses
2
tabler-icon-diamond-filled.svg

Secure Best Marks with AI Grader

Need help grading? Try our AI Grader for instant feedback on your assignments.
Document Page
Sources of fund
Distribution of money
3
Document Page
TASK 2
Excel in replicated as a spreadsheet program for purpose of data manipulation as this
could store, calculate, display and organise data in to visual charts. Formulas and functions both
plays very significant role for above scenario as this ease the application and leads to accuracy
for division of budget amount. In technical language, formulas are used to perform various
operation and task on automatic basis as direct formula are used and even cell references as well.
The main benefit is that, this could be copied and pasted in different cell so this ease for not
recreating the similar formula for same operation such as calculating average, sum and even
percentage as well. Simultaneously, it helps to determine relationships among values in cell of
spreadsheet and for performing mathematical calculation with application of those values and in
order to outcome value in cell of our choice. It helped for saving time with reference to complex
financial and numerical documents to allow for using formulas.
4
Document Page
5
chevron_up_icon
1 out of 7
circle_padding
hide_on_mobile
zoom_out_icon
[object Object]