Analyzing Supply Chain Management Decisions with Excel Calculations

Verified

Added on  2023/01/16

|20
|2922
|39
Report
AI Summary
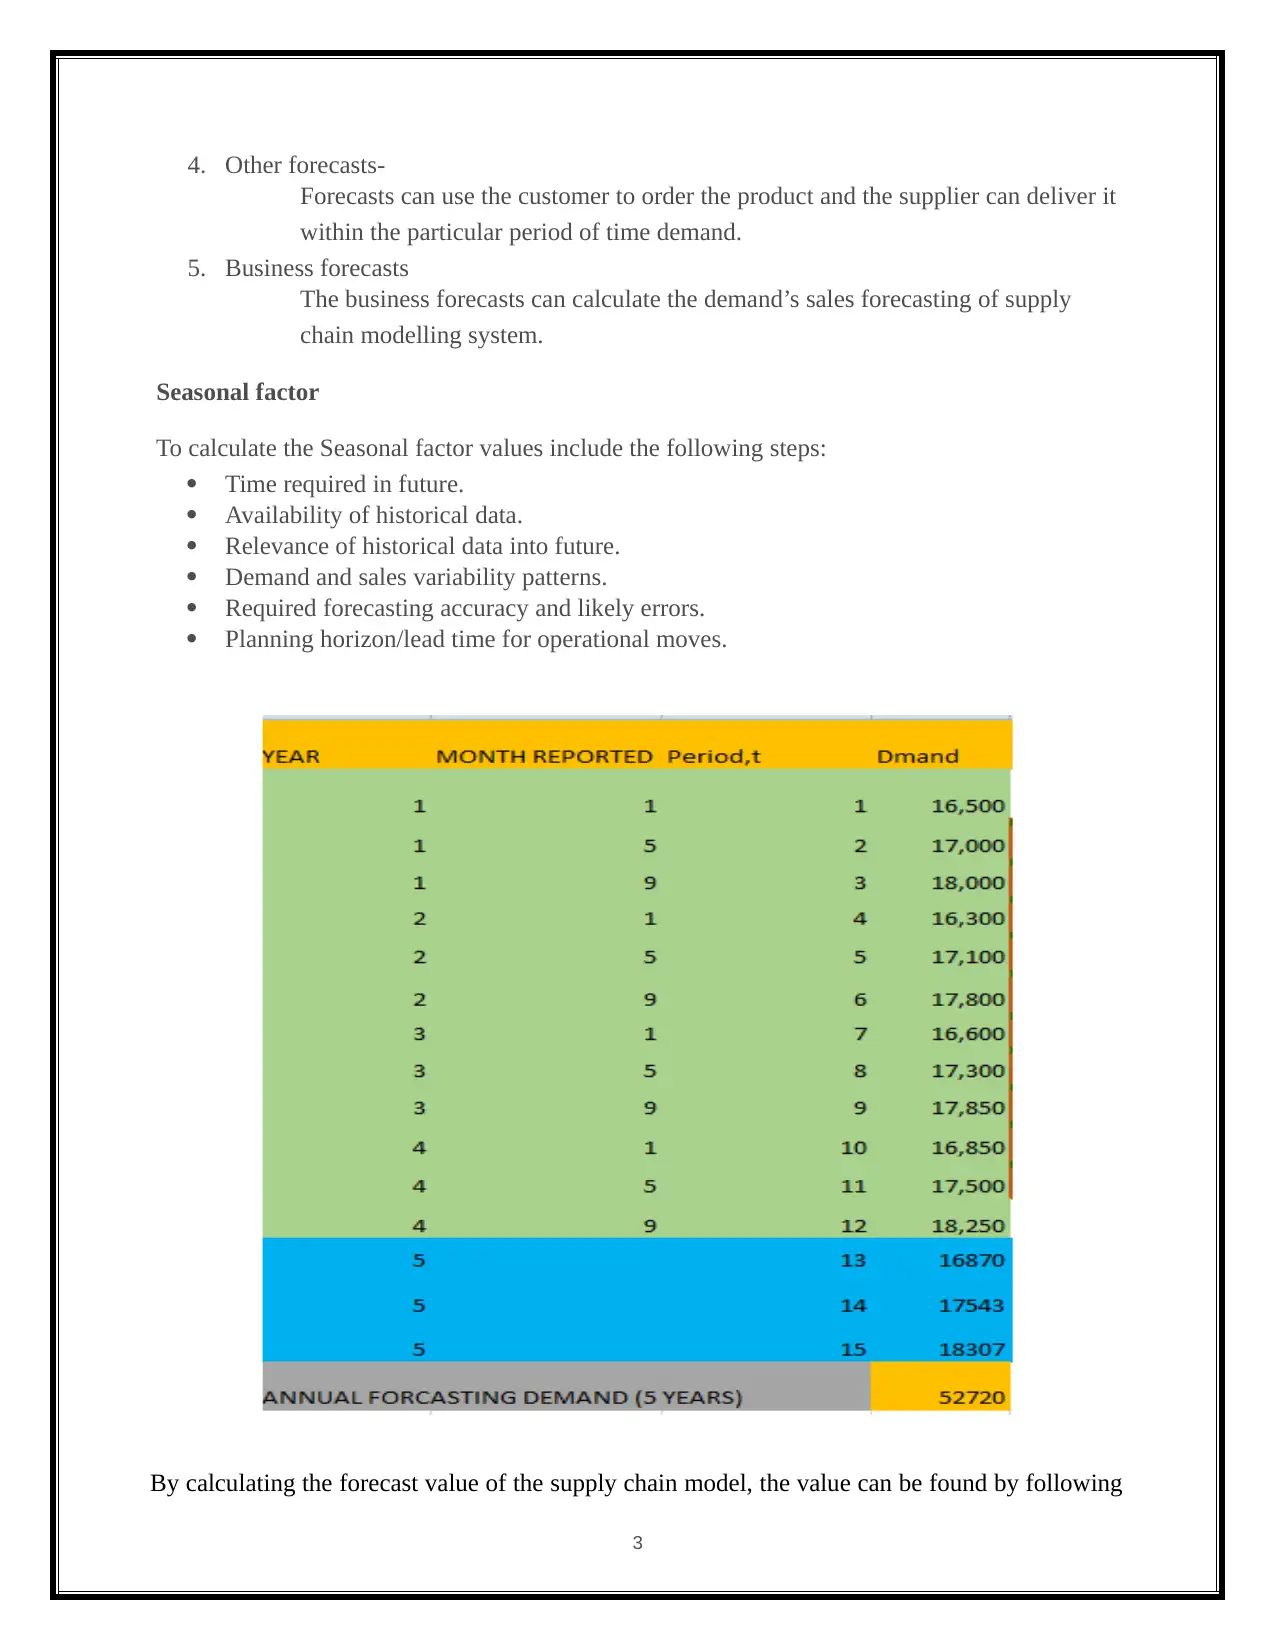
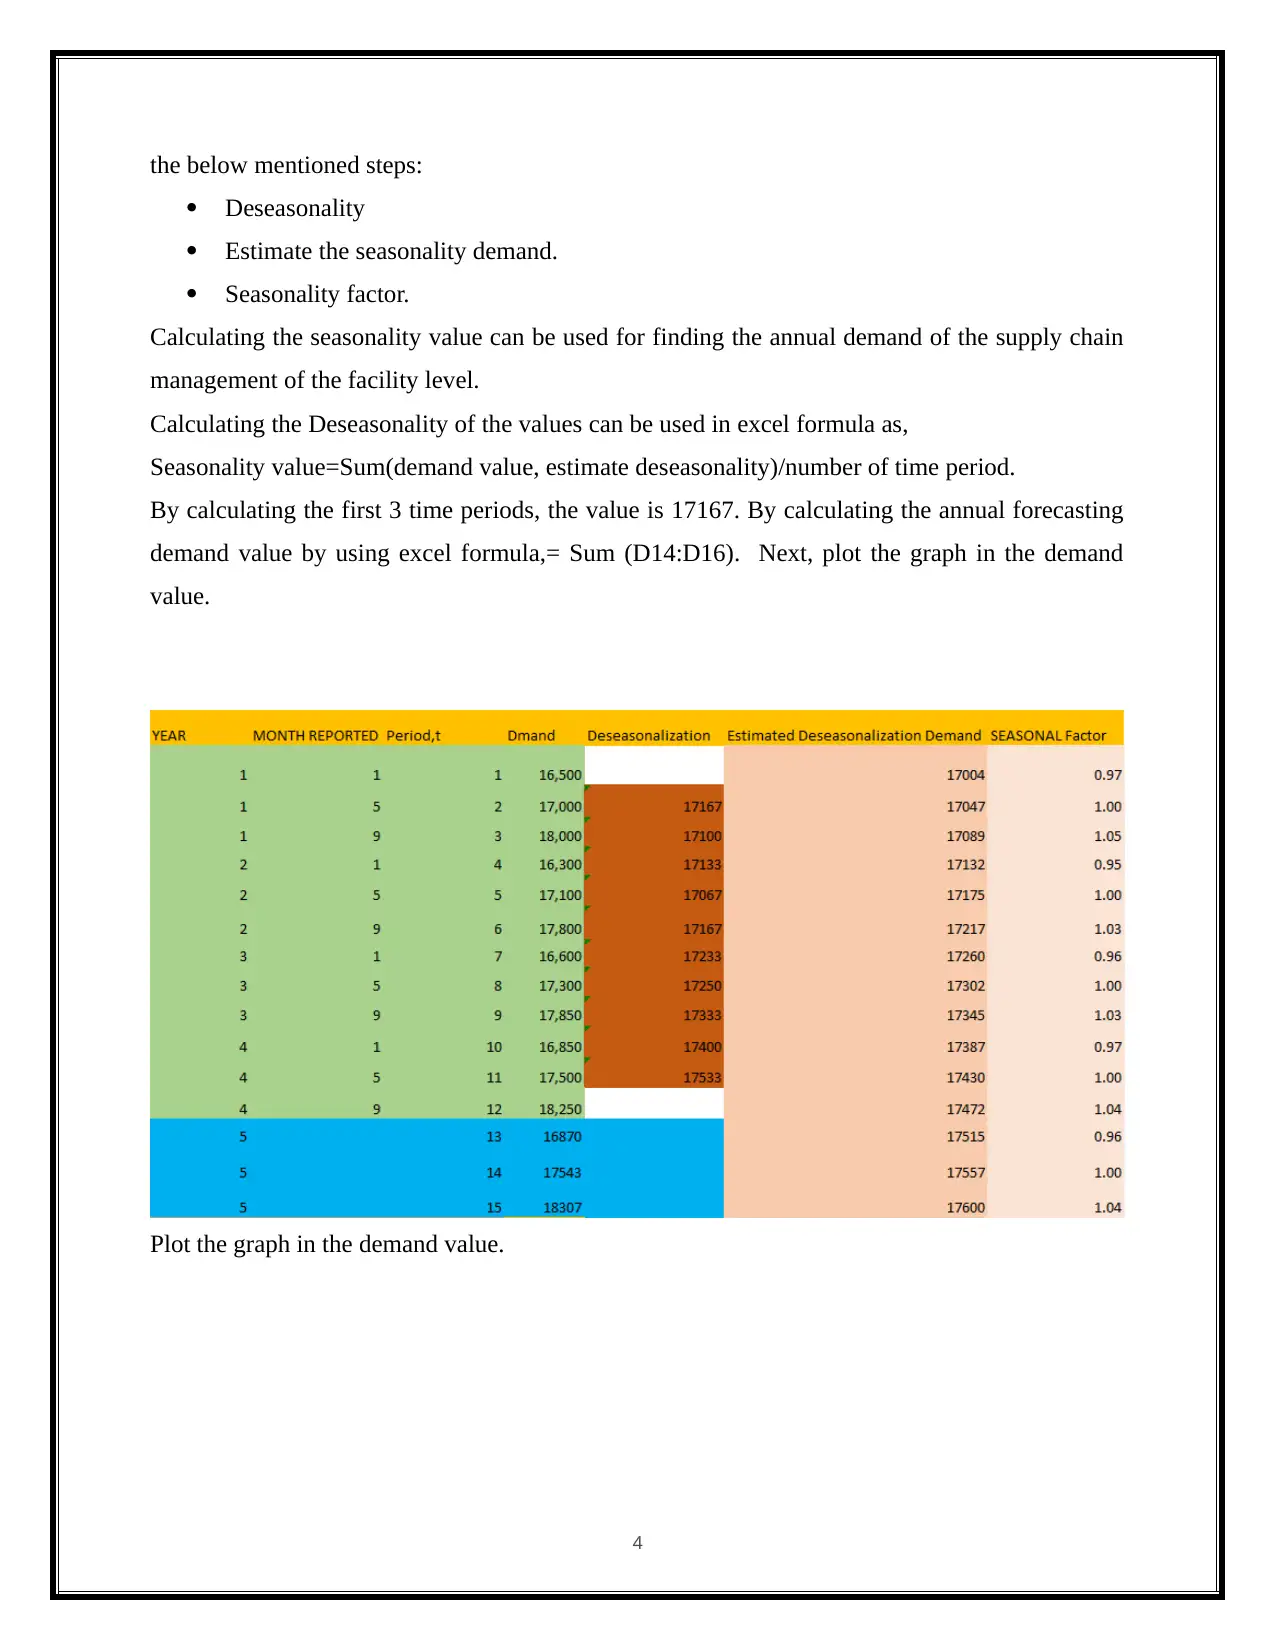
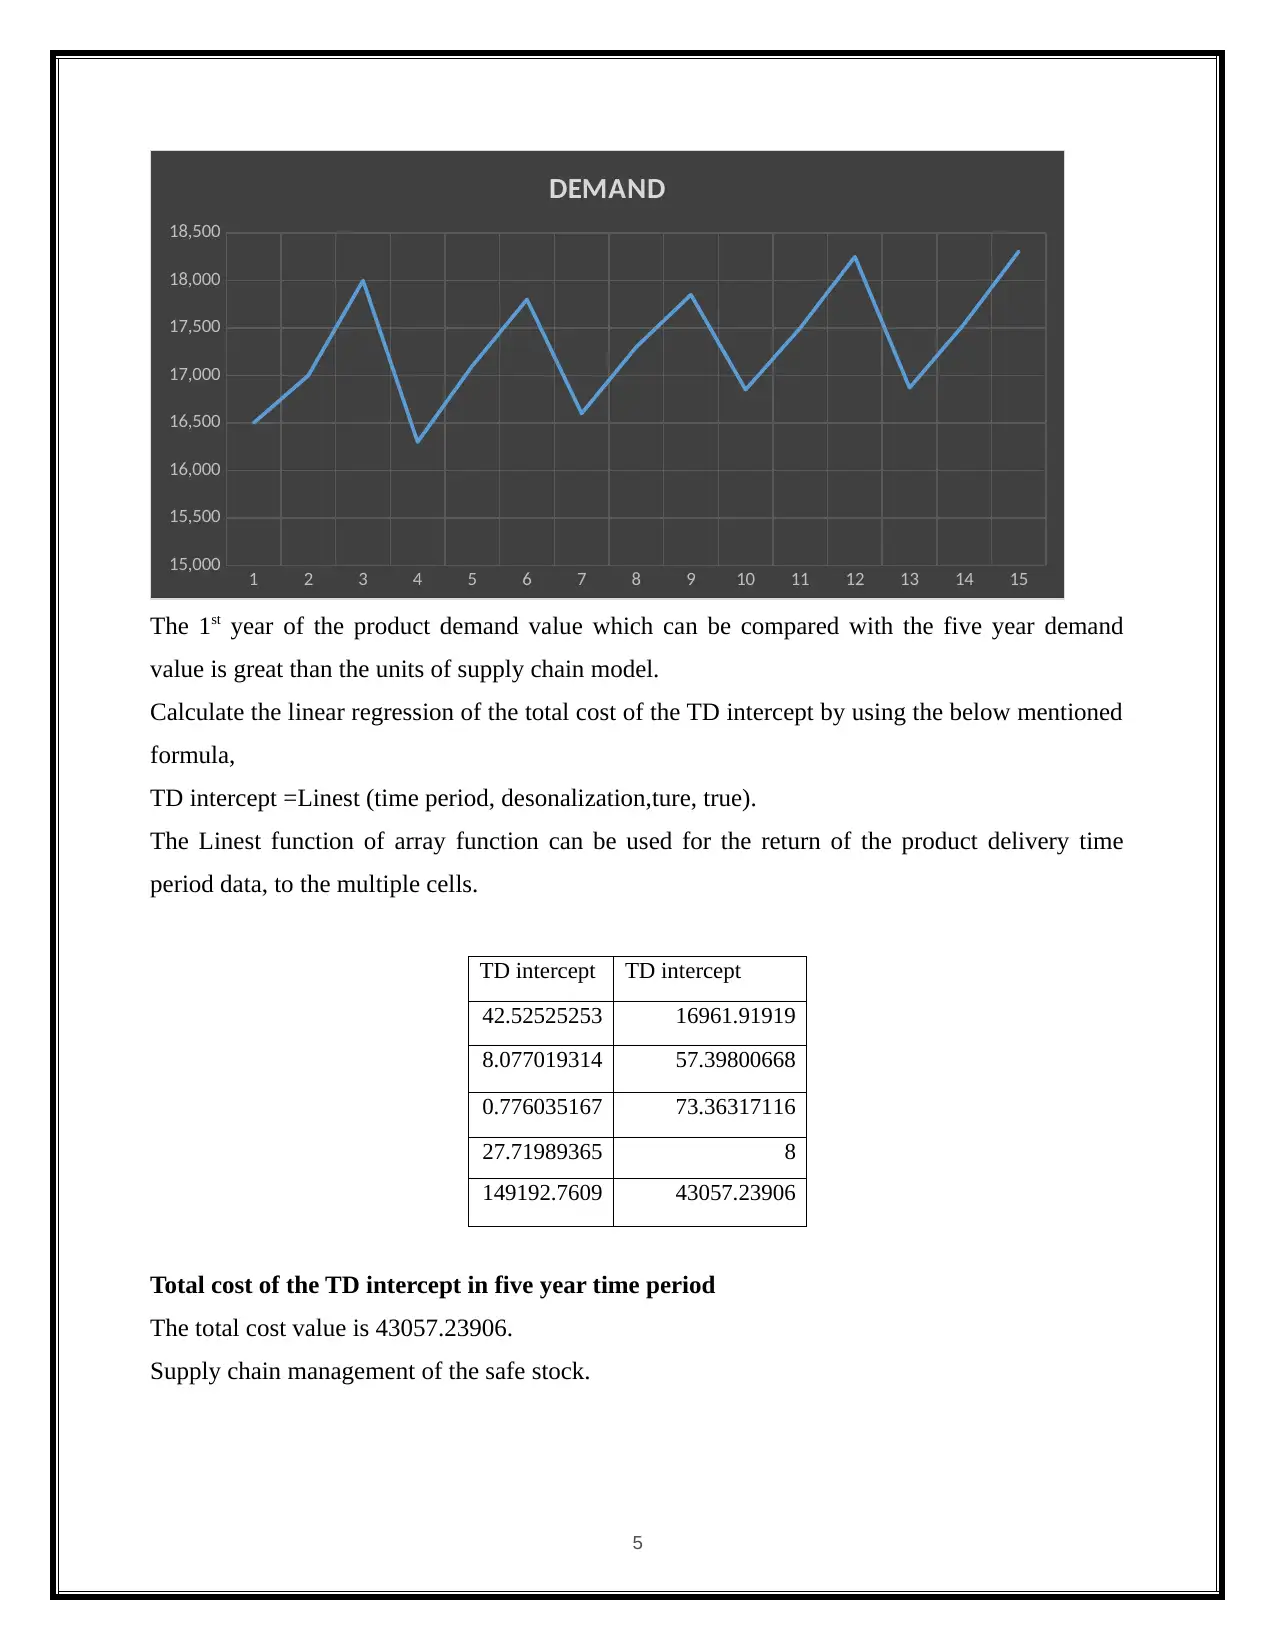
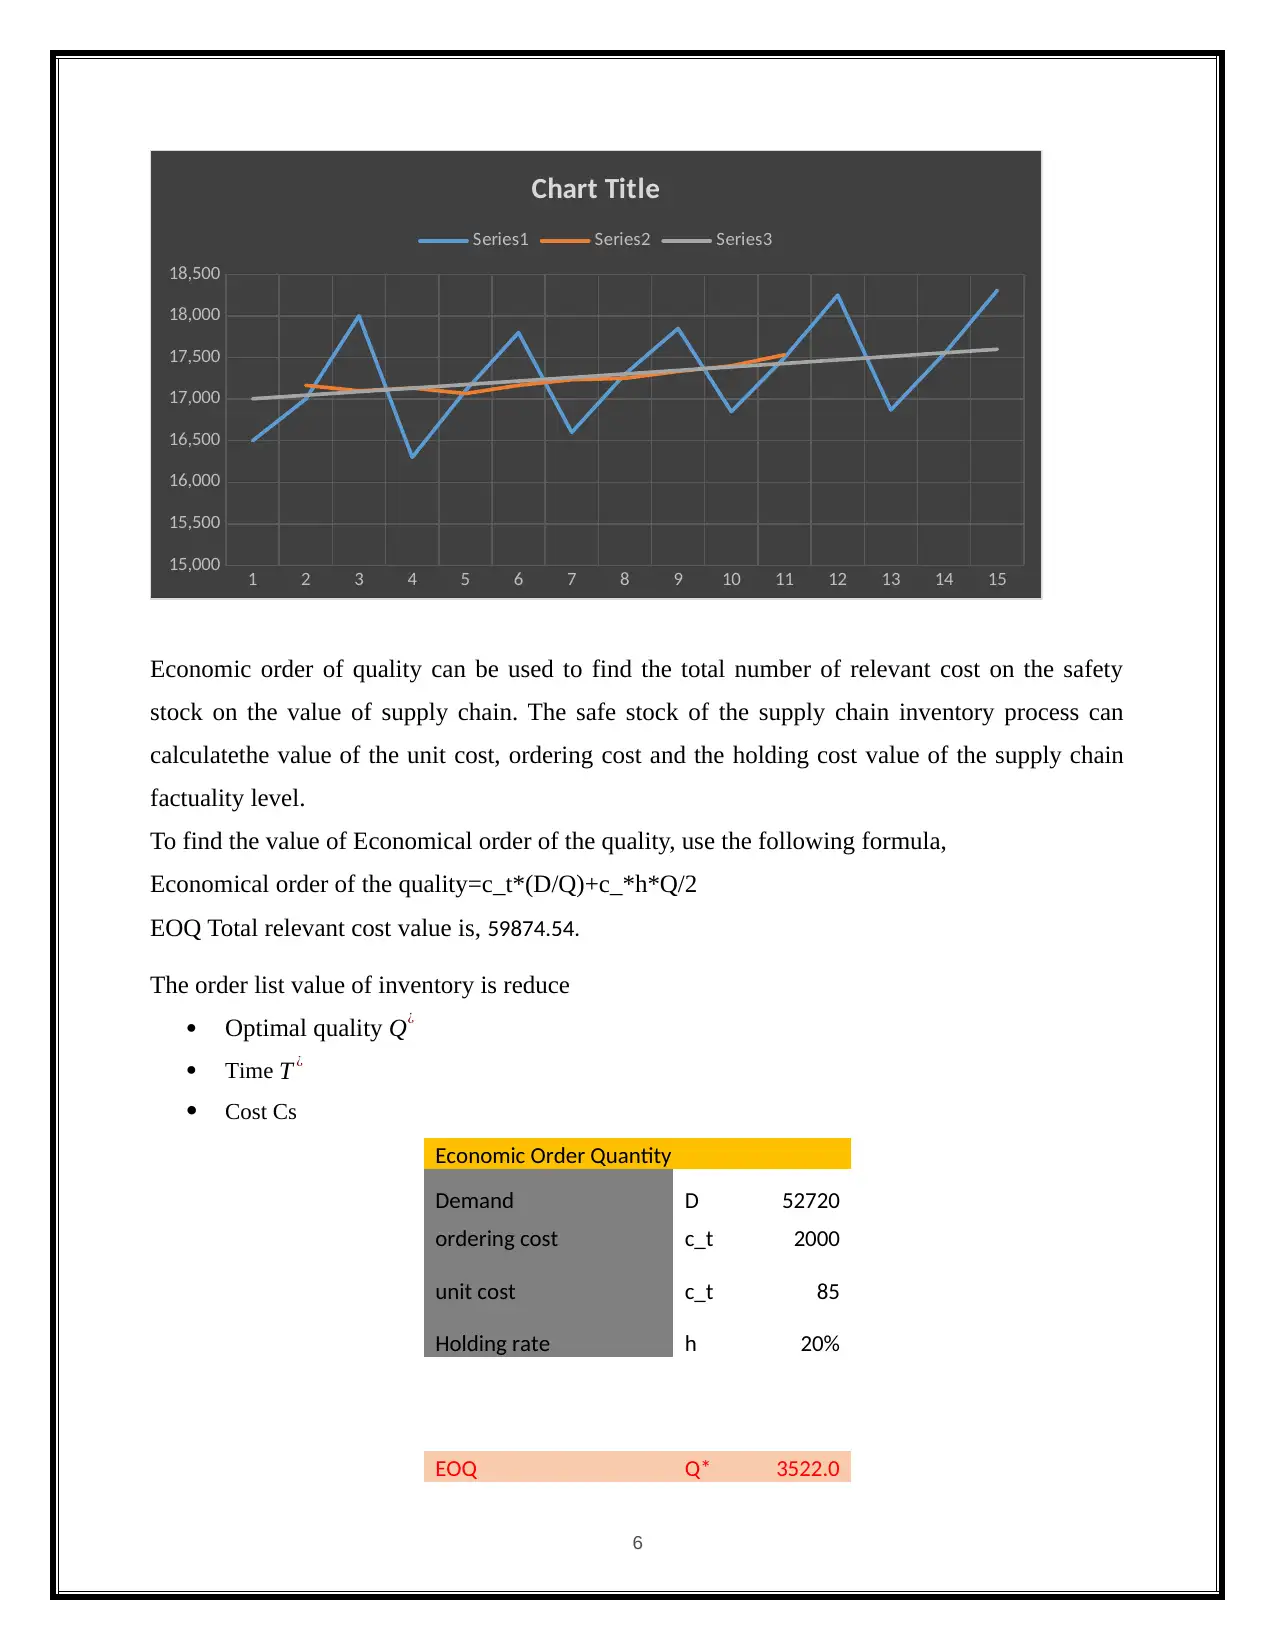
This report delves into the decision-making processes within a facility-level supply chain management system, employing Excel calculations to analyze various aspects. It begins by addressing the challenges encountered in supply chain management over recent years, focusing on seasonality analysis for annual demand forecasting, economic order quantity (EOQ) analysis for cost-effective ordering, and cycle service level analysis for supplier selection. The report aims to understand the supply chain model, analyze modeling techniques, and optimize the supply chain process, including calculating the critical ratio of cost values to identify data warehouse aspects. Furthermore, it interprets cost-time relationships, service levels, and investigates each stage of the supply chain, utilizing five years of supply chain data to forecast demand, deseasonalize data, estimate demand, and determine seasonality factors. The analysis includes calculating the total cost of the TD intercept, economic order quantity, and critical ratio to determine the number of days required to sign a warehouse contract, ultimately providing insights into optimizing cost, time, and service levels within the supply chain.
Document Page
Supply Chain Management
Name of the Student:
Name of School:
Register Number:
Date:
Class/year
Word count:
tabler-icon-diamond-filled.svg

Paraphrase This Document

Need a fresh take? Get an instant paraphrase of this document with our AI Paraphraser
Document Page
Table of Contents
Introduction........................................................................................................................................................... 1
Background........................................................................................................................................................... 1
Data collection Method.......................................................................................................................................... 1
Analysis and Evaluation......................................................................................................................................... 7
Conclusion........................................................................................................................................................... 17
Document Page
Introduction
The working of this report will discuss about the decision-making problems of facility-
level supply chain management system, by using excel calculation. The supply chain
management is a process where the supplier delivers the product to the customers. The purpose
here is to find some issues that occurred in supply chain management, in the past few years.
Analyzing the supply chain process model can include three stages like calculating the
seasonality wise analysis (annual demand), economical wise order quality analysis (EOQ), and
cycle service level (supplier selection) analysis of supply chain management system. The
objective of a decision-making problem is to understand the process of supply chain model,
analyzing the modelling techniques and optimizing the supply chain model. Additionally,
calculating the critical radio of the cost value to find the data warehouse aspects of supply chain
model. At the same time, the cost time, the service level will be interpreted and each stage of the
supply chain process will be investigated.
Background
The supply chain management of the inventory analysis has been implementing five
years of supply chain data analysis. The initial stage of the analysis can calculate the forecast of
the supply chain, which can find the deseasonality, estimating the demand on deseasonality and
seasonalization factor of 5 years. The annual demand table has been containing the year, month
period, time period and demand of the fields. Economic order quality contains fields on demand,
order cost, holding rate, and the unit cost of the fields. Supplier selection table is used for
calculating the values of critical radio of the total unit cost simultaneously to find how many
days are required for the storage of contractor warehouse.
Data collection Method
Forecasting demand:
The annual forecasting demand calculation can be used for the process of predicting a future
event. It can easily find the underlying basis of all the business decision such as:
1
Document Page
Production
Inventory
Personnel demand values
Facilities
To find the values of Horizons values of the forecasting can follow the below mentioned three
ways:
Short-range forecast
Medium range forecast
Long range forecast
Short range forecast:
To calculate the excel value for up to 1 year, generally less the 3 months.
Calculating the short-range forecast that can include the values of the purchasing value,
to analyze the job scheduling time, workforce level, job assignments, and production
levels. Forecasting usually employs different methodologies and longer term forecasting
values are more accurate.
Medium range forecast:
To find the medium range forecast calculating the values of 3 months to 3 years.
The supply chain modelling of the facility level can analyze the sales and production
planning, budgeting of the forecast demand value of the supply chain modelling
management.
Long range forecast
By calculating the 5 years values of the forecasting annual values of supply chain
management of the demand, the value is 52720.
The long range forecasting can analyze the data values on new product planning, facility
location, research and development of the forecast demand.
Types of forecasts
1. Economic forecasts
The economic forecasts can specify the economic growth, inflation rate, money
supply based on economic data trends of the product interventions.
2. Demographic forecasts
The demographic forecasting can be used for population aggregate and
disaggregate for the forecasts demand.
3. Technical forecasts
The Technical forecasting can be used for predicting the technological change of
the supply chain forecasts demand.
2
tabler-icon-diamond-filled.svg

Paraphrase This Document

Need a fresh take? Get an instant paraphrase of this document with our AI Paraphraser
Document Page
4. Other forecasts-
Forecasts can use the customer to order the product and the supplier can deliver it
within the particular period of time demand.
5. Business forecasts
The business forecasts can calculate the demand’s sales forecasting of supply
chain modelling system.
Seasonal factor
To calculate the Seasonal factor values include the following steps:
Time required in future.
Availability of historical data.
Relevance of historical data into future.
Demand and sales variability patterns.
Required forecasting accuracy and likely errors.
Planning horizon/lead time for operational moves.
By calculating the forecast value of the supply chain model, the value can be found by following
3
Document Page
the below mentioned steps:
Deseasonality
Estimate the seasonality demand.
Seasonality factor.
Calculating the seasonality value can be used for finding the annual demand of the supply chain
management of the facility level.
Calculating the Deseasonality of the values can be used in excel formula as,
Seasonality value=Sum(demand value, estimate deseasonality)/number of time period.
By calculating the first 3 time periods, the value is 17167. By calculating the annual forecasting
demand value by using excel formula,= Sum (D14:D16). Next, plot the graph in the demand
value.
Plot the graph in the demand value.
4
Document Page
1 2 3 4 5 6 7 8 9 10 11 12 13 14 15
15,000
15,500
16,000
16,500
17,000
17,500
18,000
18,500
DEMAND
The 1st year of the product demand value which can be compared with the five year demand
value is great than the units of supply chain model.
Calculate the linear regression of the total cost of the TD intercept by using the below mentioned
formula,
TD intercept =Linest (time period, desonalization,ture, true).
The Linest function of array function can be used for the return of the product delivery time
period data, to the multiple cells.
TD intercept TD intercept
42.52525253 16961.91919
8.077019314 57.39800668
0.776035167 73.36317116
27.71989365 8
149192.7609 43057.23906
Total cost of the TD intercept in five year time period
The total cost value is 43057.23906.
Supply chain management of the safe stock.
5
tabler-icon-diamond-filled.svg

Paraphrase This Document

Need a fresh take? Get an instant paraphrase of this document with our AI Paraphraser
Document Page
1 2 3 4 5 6 7 8 9 10 11 12 13 14 15
15,000
15,500
16,000
16,500
17,000
17,500
18,000
18,500
Chart Title
Series1 Series2 Series3
Economic order of quality can be used to find the total number of relevant cost on the safety
stock on the value of supply chain. The safe stock of the supply chain inventory process can
calculatethe value of the unit cost, ordering cost and the holding cost value of the supply chain
factuality level.
To find the value of Economical order of the quality, use the following formula,
Economical order of the quality=c_t*(D/Q)+c_*h*Q/2
EOQ Total relevant cost value is, 59874.54.
The order list value of inventory is reduce
Optimal quality Q¿
Time T ¿
Cost Cs
Economic Order Quantity
Demand D 52720
ordering cost c_t 2000
unit cost c_t 85
Holding rate h 20%
EOQ Q* 3522.0
6
Document Page
Total relevant Cost TRC*
59874.5
4
Analysis and Evaluation
Critical Ratio and Application
The critical ratio of the supply chain modelling of the facility levels can find the value of
shortage cost and exceed cost of the critical ratio of supply chain system.
The cycle service level can be used for the customer to order the product and the supplier can
calculate how much number of days is required to deliver the product to the customer of the
construct warehouse.
To calculate the critical ratio value, use the following steps:
The order list value of inventory is reduce
Optimal quality Q¿
Time T ¿
Cost Cs
cs is denoted as the shortage cost
ce: is denoted as the exceed cost
P is donated as the ordering cost
Unit cost is 65
Selling cost is 2000
Cs=p-c=2000-85=1935
ce =65
Critical radio value is= Cs
Cs+ ce = 1935
193565 =66
7
Document Page
The critical ratio of the supply chain value is 66.
To find the value of QB¿
Q¿ vs. critical radio
1 2 3 4 5 6 7 8 9 10
0
20
40
60
80
100
120
Series2
Series1
Optimization of supply chain model:
For analyzing the optimization cost,
Optimization cost= =SQRT(2*c_t*D/(c_*h))
8
tabler-icon-diamond-filled.svg

Paraphrase This Document

Need a fresh take? Get an instant paraphrase of this document with our AI Paraphraser
Document Page
To analyze the total relevant cost value, use the following formula,
Total cost Relevant= =c_t*(D/Q)+c_*h*Q/2
9
Document Page
YEAR
MONTH
REPORTED Period,t
Dm
and
Deseasona
lization
Estimated
Deseasonalization
Demand
SEASONA
L Factor
1 1 1
16,5
00 17004 0.97
1 5 2
17,0
00 17167 17047 1.00
1 9 3
18,0
00 17100 17089 1.05
2 1 4
16,3
00 17133 17132 0.95
2 5 5
17,1
00 17067 17175 1.00
2 9 6
17,8
00 17167 17217 1.03
3 1 7
16,6
00 17233 17260 0.96
3 5 8 17,3 17250 17302 1.00
10
chevron_up_icon
1 out of 20
circle_padding
hide_on_mobile
zoom_out_icon
[object Object]