Data Analysis Report: Excel and SPSS for Supermarket and Clinic Data
VerifiedAdded on 2023/01/04
|20
|3254
|86
Report
AI Summary
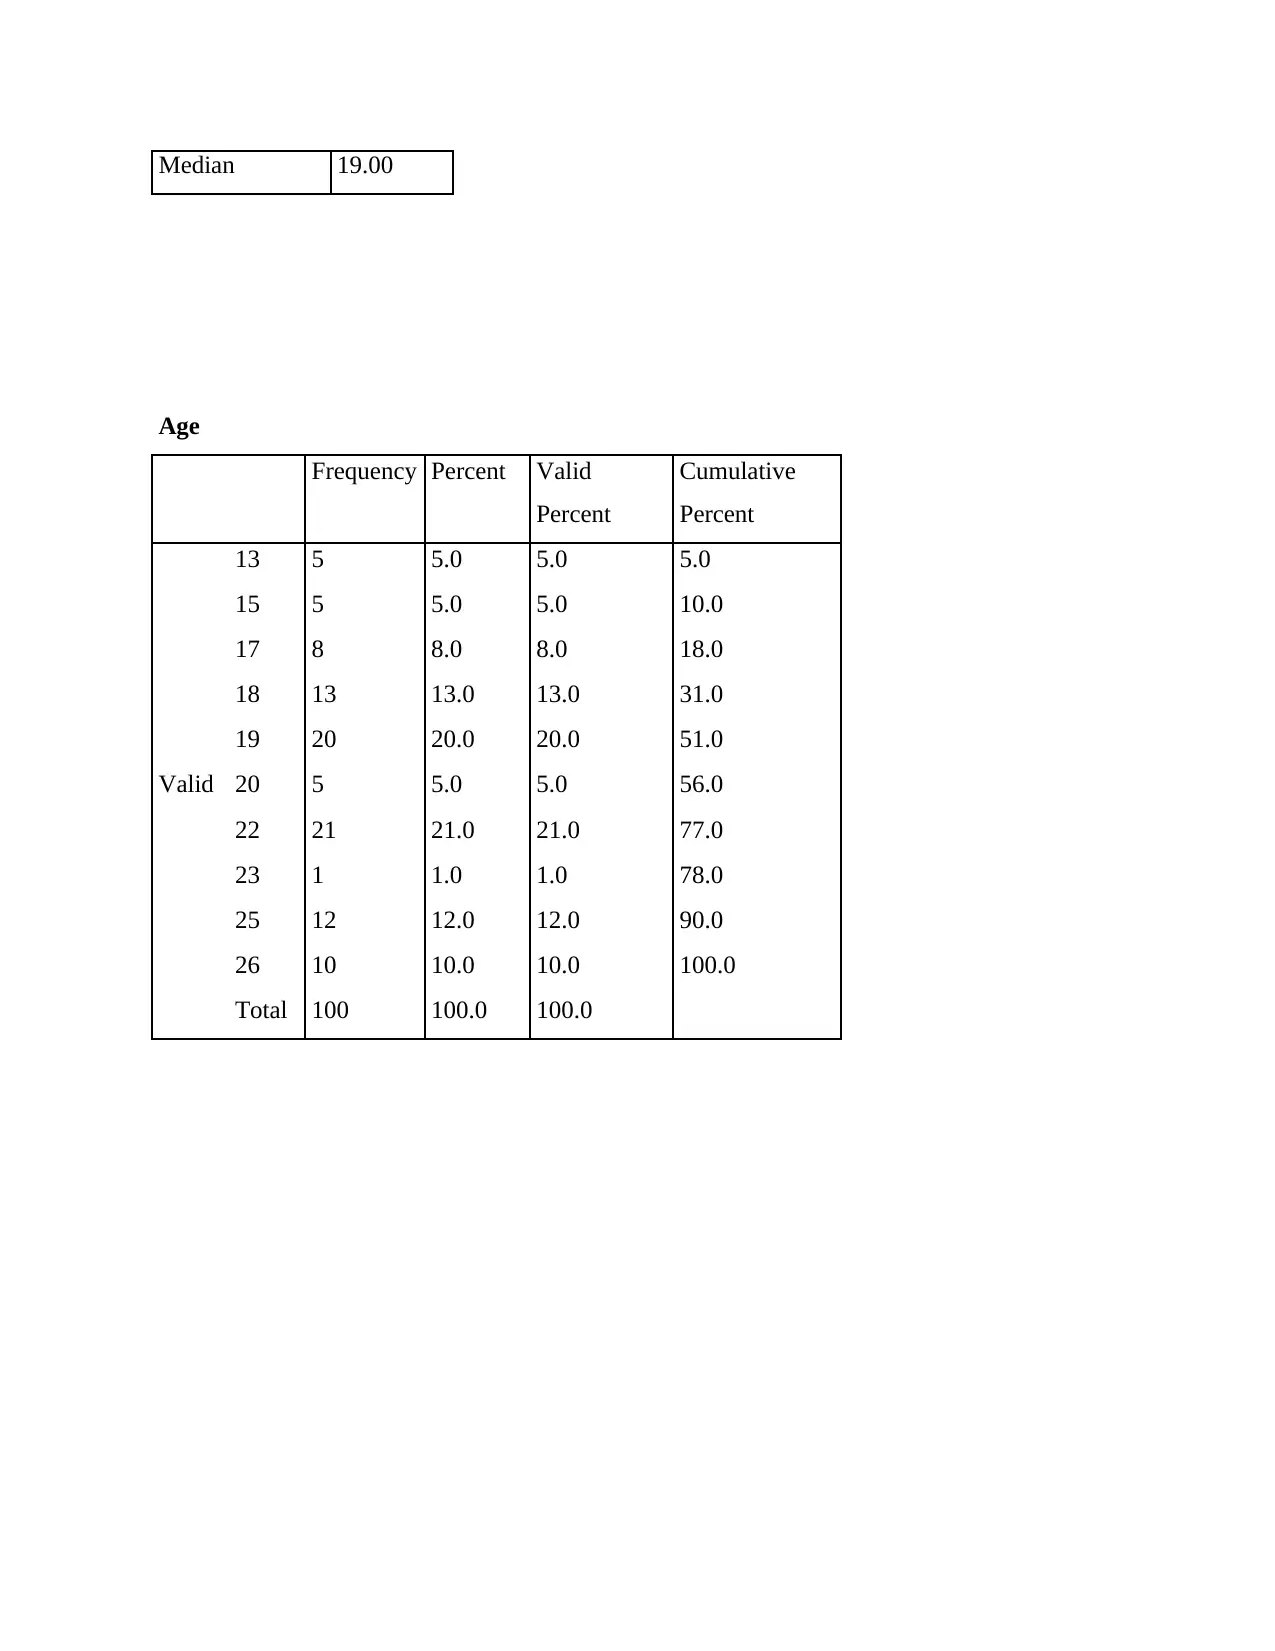
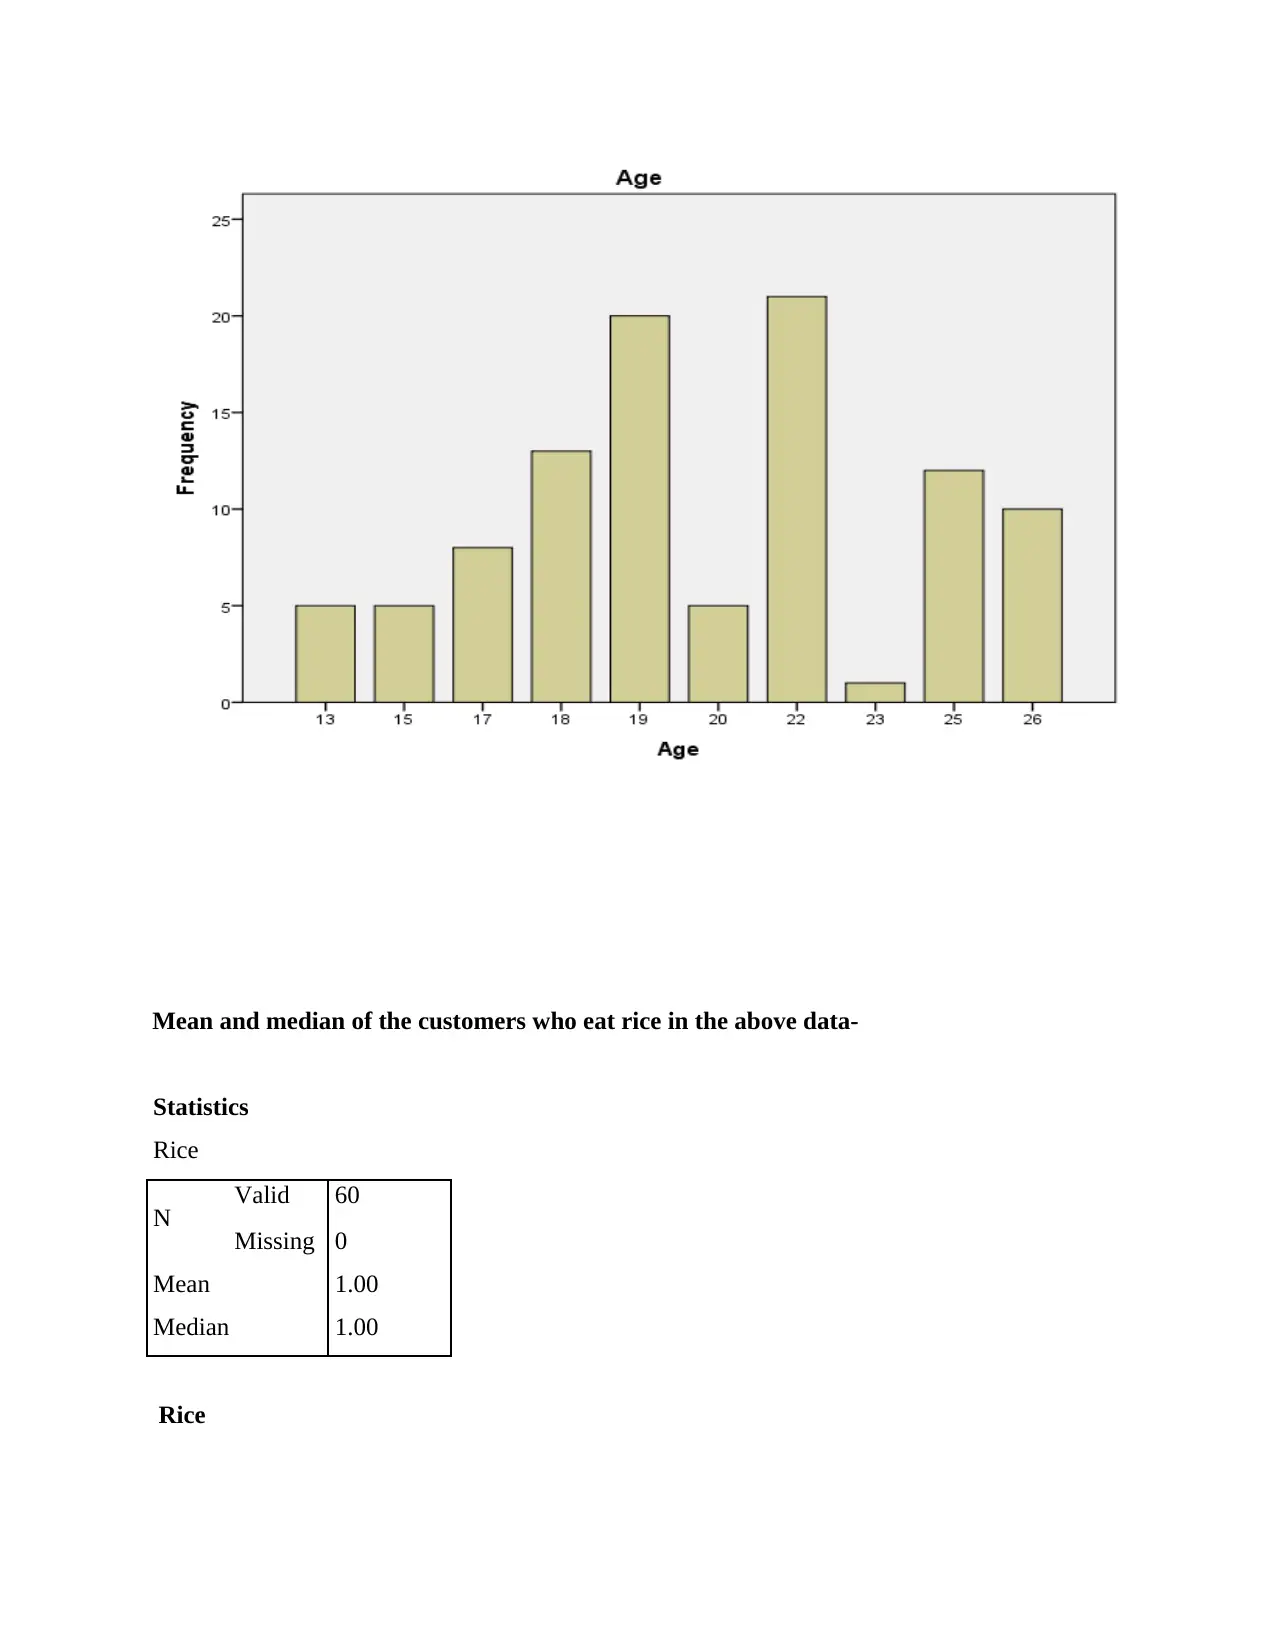
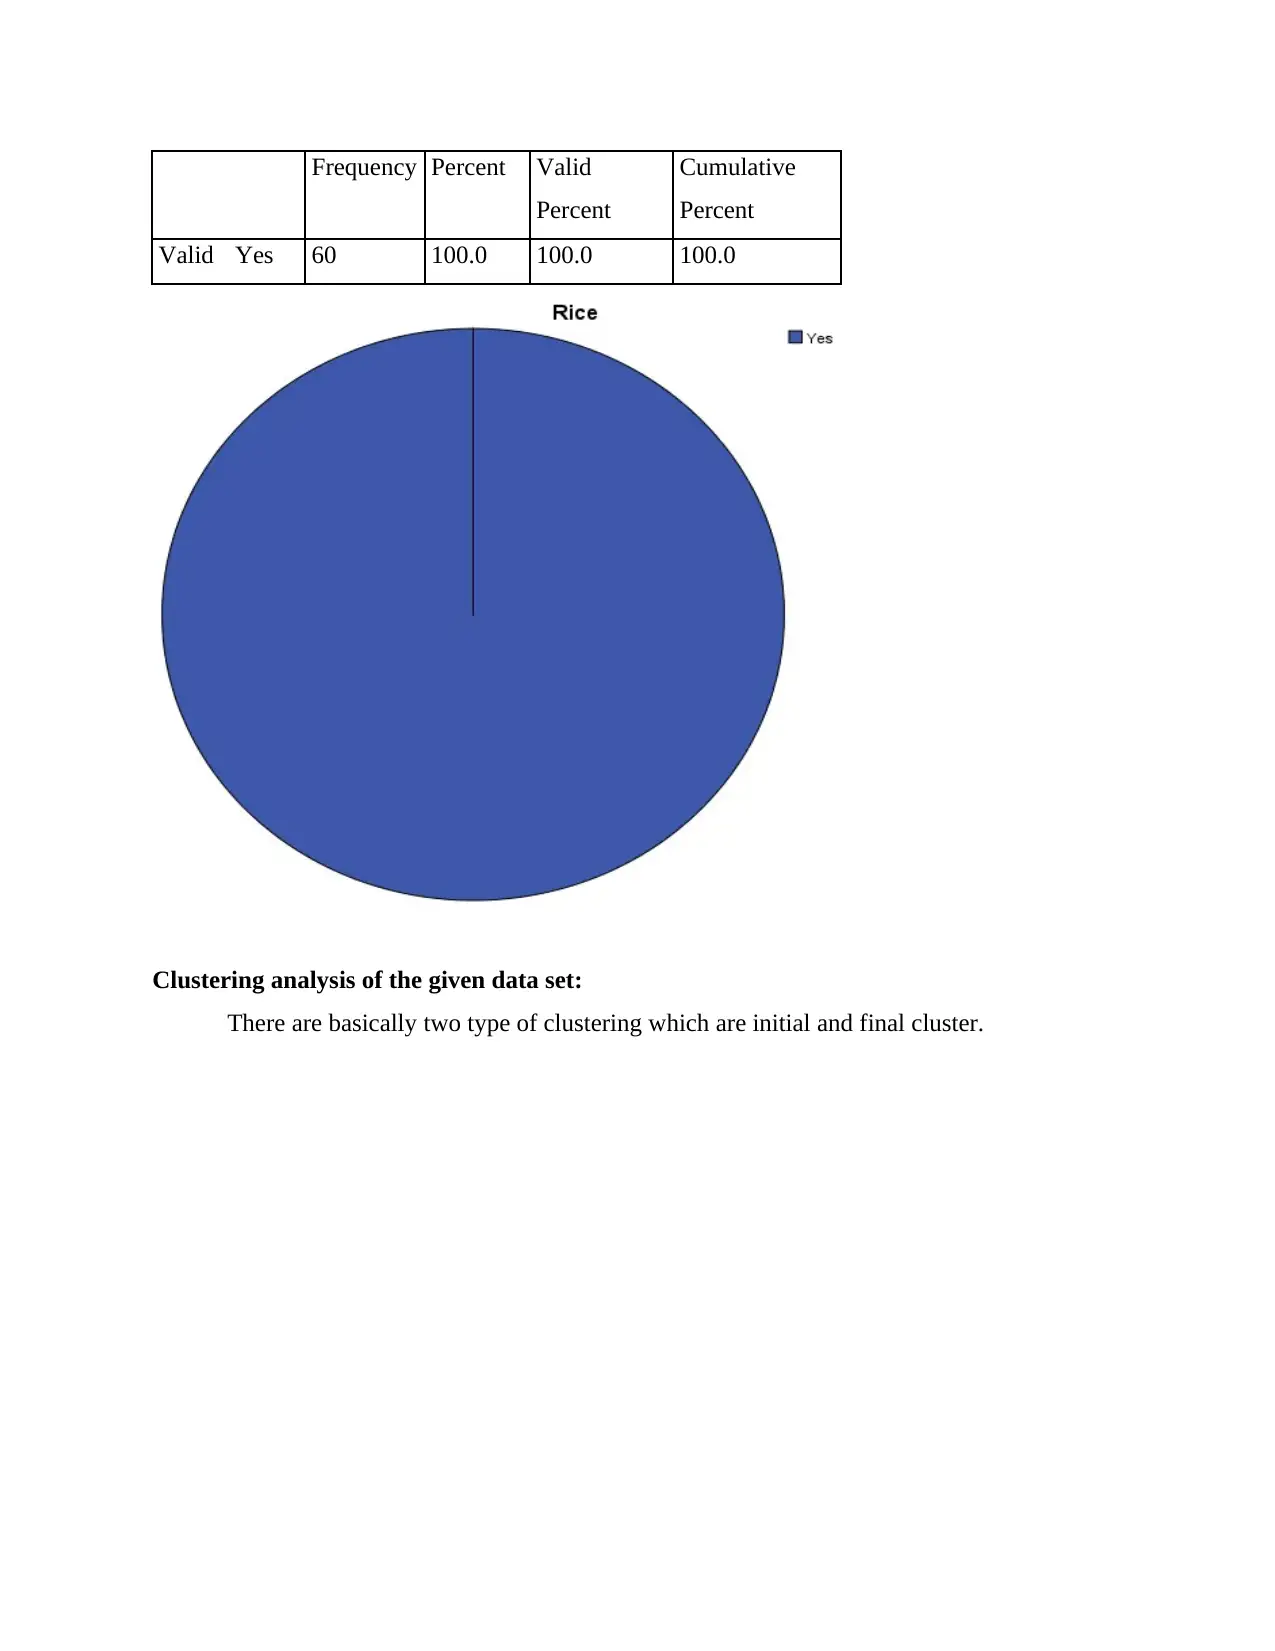
This report presents a comprehensive analysis of data using Excel and SPSS, focusing on supermarket and clinic datasets. The report is divided into two parts; the first part details the significance of Excel in data handling, including the application of IF functions, pivot tables, and conditional formatting for pre-processing, analysis, and visualization. It also provides a sales decline analysis based on the given data. The second part delves into SPSS, exploring clustering techniques and data mining methods like classification. The report presents examples for clustering techniques and analysis of customer data, including gender, rice consumption, and age statistics, along with a discussion on popular data mining methods. The analysis includes the use of tables and charts to visualize the data, providing a clear and concise understanding of the data analysis process. The report concludes with a critical evaluation of the importance of SPSS in comparison to Excel.

DATA HANDLING
Paraphrase This Document
Need a fresh take? Get an instant paraphrase of this document with our AI Paraphraser

Table of Contents
INTRODUCTION...........................................................................................................................3
MAIN BODY..................................................................................................................................3
Part 1...........................................................................................................................................3
PART 2.......................................................................................................................................8
CONCLUSION.............................................................................................................................16
REFRENCES.................................................................................................................................17

INTRODUCTION
Data analysis is an important statement for every corporation which helps the
organisation take better decision in all departments. For making helpful and accurate decisions, it
is necessary to use suitable data analysis method with the help tools such as excel or any other
instrument. This report is divided into two parts where the first part includes elaborate content
about data of a supermarket which is analysed by using various types of features of excel such as
IF, PIVOT TABLES and others. The second part of this report includes data of a clinic which is
analysed by the usage of SPSS roles. Critical evaluation of the significance of SPSS in
comparison to excel along with analysis of various data mining techniques is provided.
MAIN BODY
Part 1
Significance of excel: In the current age of information, there is a broad spectrum of excel roles
is present which are utilised by large number of corporations and individual persons for the
purpose of effective presentation and analysis of data which helps them take better decisions
(Cotton, 2018) . Several of the major elements which highlight the significance of excel with
principle of data analysis, data processing and presentation of data are provided below:
Pre-processing data- The subject of pre-processing data is defined as showcasing the
collected data in a way which is easy to understand by any individual. Pre-processing of data is
associated transformation of raw data easily to make it comprehensible for everyone. Excel has a
crucial part in this area as due to the aid of excel, incomprehensible raw data is transformed and
the complex quality of this data is eliminated and the information is showcased in
⊘ This is a preview!⊘
Do you want full access?
Subscribe today to unlock all pages.

Trusted by 1+ million students worldwide

comprehensible way which is easy to comprehend and useful results can be constructed from
such data (Farlow, 2020) . The filter function present in excel is helpful in sorting the data in
nuclear form and provides much required assistance in pre-processing of raw information.
Analysis of the data- This is one of the various highly significant functions present in
excel which are helpful in proper analysis of data. The phrase of data analysis refers to the
procedure of evaluation of data collection by the usage of various methods such as mean, mode,
median and other appropriate technical methods. This procedure is successfully accomplished by
the assistance of various instruments and tools present in excel (Filipowicz, 2019) . Different
types of procedures such as finding the mean of large data collection are easily completed by
application of =MEAN formula present in the excel sheet. With the assistance of such tools, the
procedure of data analysis becomes swift and the possibility of human errors is reduced by high
amount due to calculation being completed effectively in the excel sheet (Srivastava, 2020) .
This practice saves time as unnecessary time wastage is reduced and the results can be used to
take important decisions and improve the decision making process.
Visualising the data- Effective presentation of data also refers to showcasing data which
is not only easy to comprehend but also captivating and attention garbing. This objective of
enhancing the visual component of the data, is easily accomplished by effective usage of graphs
and tables which are present in the excel sheet. Excel sheet provides the users ability to construct
and include various charts such as pie charts, bar chart, line chart and many others. The
procedure to construct detailed accurate and attention grabbing charts is very easy as the users
are required to choose the kind of chart they wish to use and select it (Sumathi and Anitha,
2018) . This process can be completed by everyone and provides various corporations and
individuals required aid in presenting their information set in a visually appealing manner by
building charts swiftly and effectively. Excel gives the users another option of table construction
with different colours to make the visual element of the presentation highly appealing.
These are several of major benefits which are provided by excel for set of information. Aside
from the described functions, practically various type of functions which assist in the usage of
the various roles provided previously. The detailed account of each of these roles is given below:
IF function- One of the most basic chores in excel is the IF function and it helps the users make
logical differentiation between quality and attributes of the substance and the expectation of the
Paraphrase This Document
Need a fresh take? Get an instant paraphrase of this document with our AI Paraphraser

user . The IF claim can result in two situations which are the first outcome is if differentiation is
accurate and the secondary if the outcome of the user is inaccurate.
The four-component period clause is present in the IF function or the IF statement in excel
(Zhou and et. al., 2016) . This makes it easier to find in the present situation, the amount by
which revenue and benefit suns are reduced at what time the buyer's alteration is and also the
total enforcement of the IF function at each point which is very helpful to the user.
Cut or paste of the taxable twenty-four hour period, net income and profit again on
different pages for the first instance.
Identification of information from long ago in the primary structure of quality assurance
claim.
Usage of kinds of 'IF component.' Formulating code of sort = if ( virus type B2>B3)
If distinctions are satisfied by the receiver than keep adding a cell key which is checked
along with others.
Semi-colon Productive: choose “Rise”
Remove the multi-pack: and press the continue option if the needed outcome is not
present.
If the characteristic emphasises the worth of B3, the utility of B1 implies that the standard might
be way more crucial than B3 if the result of B3 is comparatively improved than that of the
section B3. Due to the unavailability of this option users receive the layout of cell B4 after
pressing the enter key (Konstantopoulos and Pantziou 2018) . After watching this result change
the deal from D4 to distant D8400.
If the users are aware about which type of H Lookup and V Backup will be present in the
process, their unhappiness will be reduced. One of the most significant attributes which are if the
consumers will appreciate it or if they dislike it. They will investigate the matter more closely
and with more vivid detail as their interaction will be in smaller amounts.
PIVOT table: This phrase refers to a table of statistics present in excel which presents
the data of an elaborate and detailed table in more summarised form. This summarised content
may include sums, estimations averages or various other statistical operations collected together
to provide comprehensible manner by the pivot table. In the context of data analysis this table is
process which is used to sum up, place, change the structure, group together , compute or

calculate the aggregate value of the data present in a more detailed table (Leardi, 2017) . This
table allows the users to effectively use data elaborate calculations and columns to bunched.
LOOKUP function- This characteristic is available in the LOOKUP and Comparison
function in excel sheet. This feature executes an abrasive equalized LOOKUP in single row or
single column extent and gives back the proportionate value from some other single row or
single column . Technically modern variants of the LOOKUP function include HLOOKUP and
VLOOKUP (Ness and Sorbie, 2019) . The major difference between these two variants of the
LOOKUP function is that the VLOKUP is only limited to horizontal lookups while LOOKUP
function includes options for both vertical and horizontal lookups.
Conditional formatting- This type of formatting makes highlighting more important cells
or collection of cells, bring attention to odd values and assists the user in showcasing important
data sets with the use of data bars, colour schemes and icon arrangements that are propositioned
to specified sets of information (Price, 2016) . The visual aspects of various cells is altered in
accordance to the conditions of the user. Eventually decide (CF) is a procedure which allows
users to code a component or a row series altering the measurement of output or equitation to the
obligation of tax . For instance the vision of the cell and if the output of the cell corresponds to
the specified conditions of the format, and if the selected model is present in the cell. MS Excel
guarantees high device protection assisting the workers to keep track of their capacity. The three
files of MS Excel were kept inside a brilliant database with utilisation of necessary visual
application (Simske, 2017) . The generic details related to a file along with organised data is
available in MS Spread as the location is saved. MS excel provides effective solution to the
record keeping issue.
Sales decline of the provided data arrangement:
⊘ This is a preview!⊘
Do you want full access?
Subscribe today to unlock all pages.

Trusted by 1+ million students worldwide

The information from the illustration express that the organisation had mediocre pay and
last-place investment in the month of January. On the other hand in the year 2012 more than
twice the highest total income was reported. These statistics imply that profits are vary by
significant amount; the establishment faced heavy loses in the years from 2009 to 2010 .
Accurate net income improved after 2009 and the company faced no further reduction.
Paraphrase This Document
Need a fresh take? Get an instant paraphrase of this document with our AI Paraphraser

PART 2
2.1 Elaborate the specific examples for clustering techniques.
How many customers eat rice?
Rice
Frequency Percent Valid
Percent
Cumulative
Percent
Valid
No 45 45 45 40.0
Yes 55 55 55 100.0
Total 100 100.0 100.0
The table and graph show that out of 100 customer, 55% customers eat rice and 45% do
eat rice.
How many customers are male and female?
Gender
Frequency Percent Valid
Percent
Cumulative
Percent
Valid Male 50 50.0 50.0 50.0

Female 50 50.0 50.0 100.0
Total 100 100.0 100.0
The above table and diagram show that out of 100 customers there are 50% customers
are male and 50% customers are female.
Mean, median of the ages of the above data-
Statistics
Age
N Valid 100
Missing 0
Mean 20.35
Total 100 100.0 100.0
The above table and diagram show that out of 100 customers there are 50% customers
are male and 50% customers are female.
Mean, median of the ages of the above data-
Statistics
Age
N Valid 100
Missing 0
Mean 20.35
⊘ This is a preview!⊘
Do you want full access?
Subscribe today to unlock all pages.

Trusted by 1+ million students worldwide

Median 19.00
Age
Frequency Percent Valid
Percent
Cumulative
Percent
Valid
13 5 5.0 5.0 5.0
15 5 5.0 5.0 10.0
17 8 8.0 8.0 18.0
18 13 13.0 13.0 31.0
19 20 20.0 20.0 51.0
20 5 5.0 5.0 56.0
22 21 21.0 21.0 77.0
23 1 1.0 1.0 78.0
25 12 12.0 12.0 90.0
26 10 10.0 10.0 100.0
Total 100 100.0 100.0
Age
Frequency Percent Valid
Percent
Cumulative
Percent
Valid
13 5 5.0 5.0 5.0
15 5 5.0 5.0 10.0
17 8 8.0 8.0 18.0
18 13 13.0 13.0 31.0
19 20 20.0 20.0 51.0
20 5 5.0 5.0 56.0
22 21 21.0 21.0 77.0
23 1 1.0 1.0 78.0
25 12 12.0 12.0 90.0
26 10 10.0 10.0 100.0
Total 100 100.0 100.0
Paraphrase This Document
Need a fresh take? Get an instant paraphrase of this document with our AI Paraphraser

Mean and median of the customers who eat rice in the above data-
Statistics
Rice
N Valid 60
Missing 0
Mean 1.00
Median 1.00
Rice
Statistics
Rice
N Valid 60
Missing 0
Mean 1.00
Median 1.00
Rice

Frequency Percent Valid
Percent
Cumulative
Percent
Valid Yes 60 100.0 100.0 100.0
Clustering analysis of the given data set:
There are basically two type of clustering which are initial and final cluster.
Percent
Cumulative
Percent
Valid Yes 60 100.0 100.0 100.0
Clustering analysis of the given data set:
There are basically two type of clustering which are initial and final cluster.
⊘ This is a preview!⊘
Do you want full access?
Subscribe today to unlock all pages.

Trusted by 1+ million students worldwide
1 out of 20
Related Documents

Your All-in-One AI-Powered Toolkit for Academic Success.
+13062052269
info@desklib.com
Available 24*7 on WhatsApp / Email
Unlock your academic potential
Copyright © 2020–2025 A2Z Services. All Rights Reserved. Developed and managed by ZUCOL.