Excel and SPSS: Data Pre-processing, Analysis, and Visualization
VerifiedAdded on 2023/06/13
|16
|3681
|370
Report
AI Summary
This report explores data analysis techniques using Excel and SPSS. Part one focuses on Excel's role in data preprocessing, analysis (sorting, filtering, pivot tables, what-if analysis, conditional formatting), and visualization (pie charts, bar charts, histograms). It demonstrates Excel's capabilities using crime data. Part two delves into descriptive statistics like mean and median and introduces data mining and text mining methods applicable in business contexts. The report also includes analysis of ice cream flavor preferences using SPSS, determining the number of students who prefer vanilla, the male/female ratio, and mean/median preferences for chocolate and strawberry. The document concludes by explaining common data mining and text mining methods, highlighting their applications in various industries.

2 Coursework
Paraphrase This Document
Need a fresh take? Get an instant paraphrase of this document with our AI Paraphraser
Table of Contents
INTRODUCTION...........................................................................................................................2
MAIN BODY...................................................................................................................................2
PART 1............................................................................................................................................2
PART 2:...........................................................................................................................................7
CONCLUSION..............................................................................................................................13
REFERENCES..............................................................................................................................15
1
INTRODUCTION
Data is a form of raw facts and figures which is useful in every type of organisation. The
information is extracted from the raw data. This report is divided into two parts. In part one, it
includes the importance of excel for the purpose of analysing and interpreting the data set. Excel
is a part of Microsoft windows which is useful for the complex calculations. It is represented in
the form of spreadsheet (Adinugroho, and Sari, 2018). There are various techniques of the
Microsoft excel such as pre-processing, analysing and visualising the data is also explained in
this report. The use of pivot table, look up and if function by using the given crime data is also
included in this report. In task two, it encompasses the use of descriptive statistics such as mean,
median is taken into consideration. The concept of data mining and text mining methods is
included in the report. The SPSS is a software which helps in performing complex calculations
and interpreting the information for taking various decisions. SPSS and excel both are helpful
tools to take operational, financial and strategical decisions of nay organisation.
MAIN BODY
PART 1
Evaluating the use of excel for pre-processing, analysing and visualising the data.
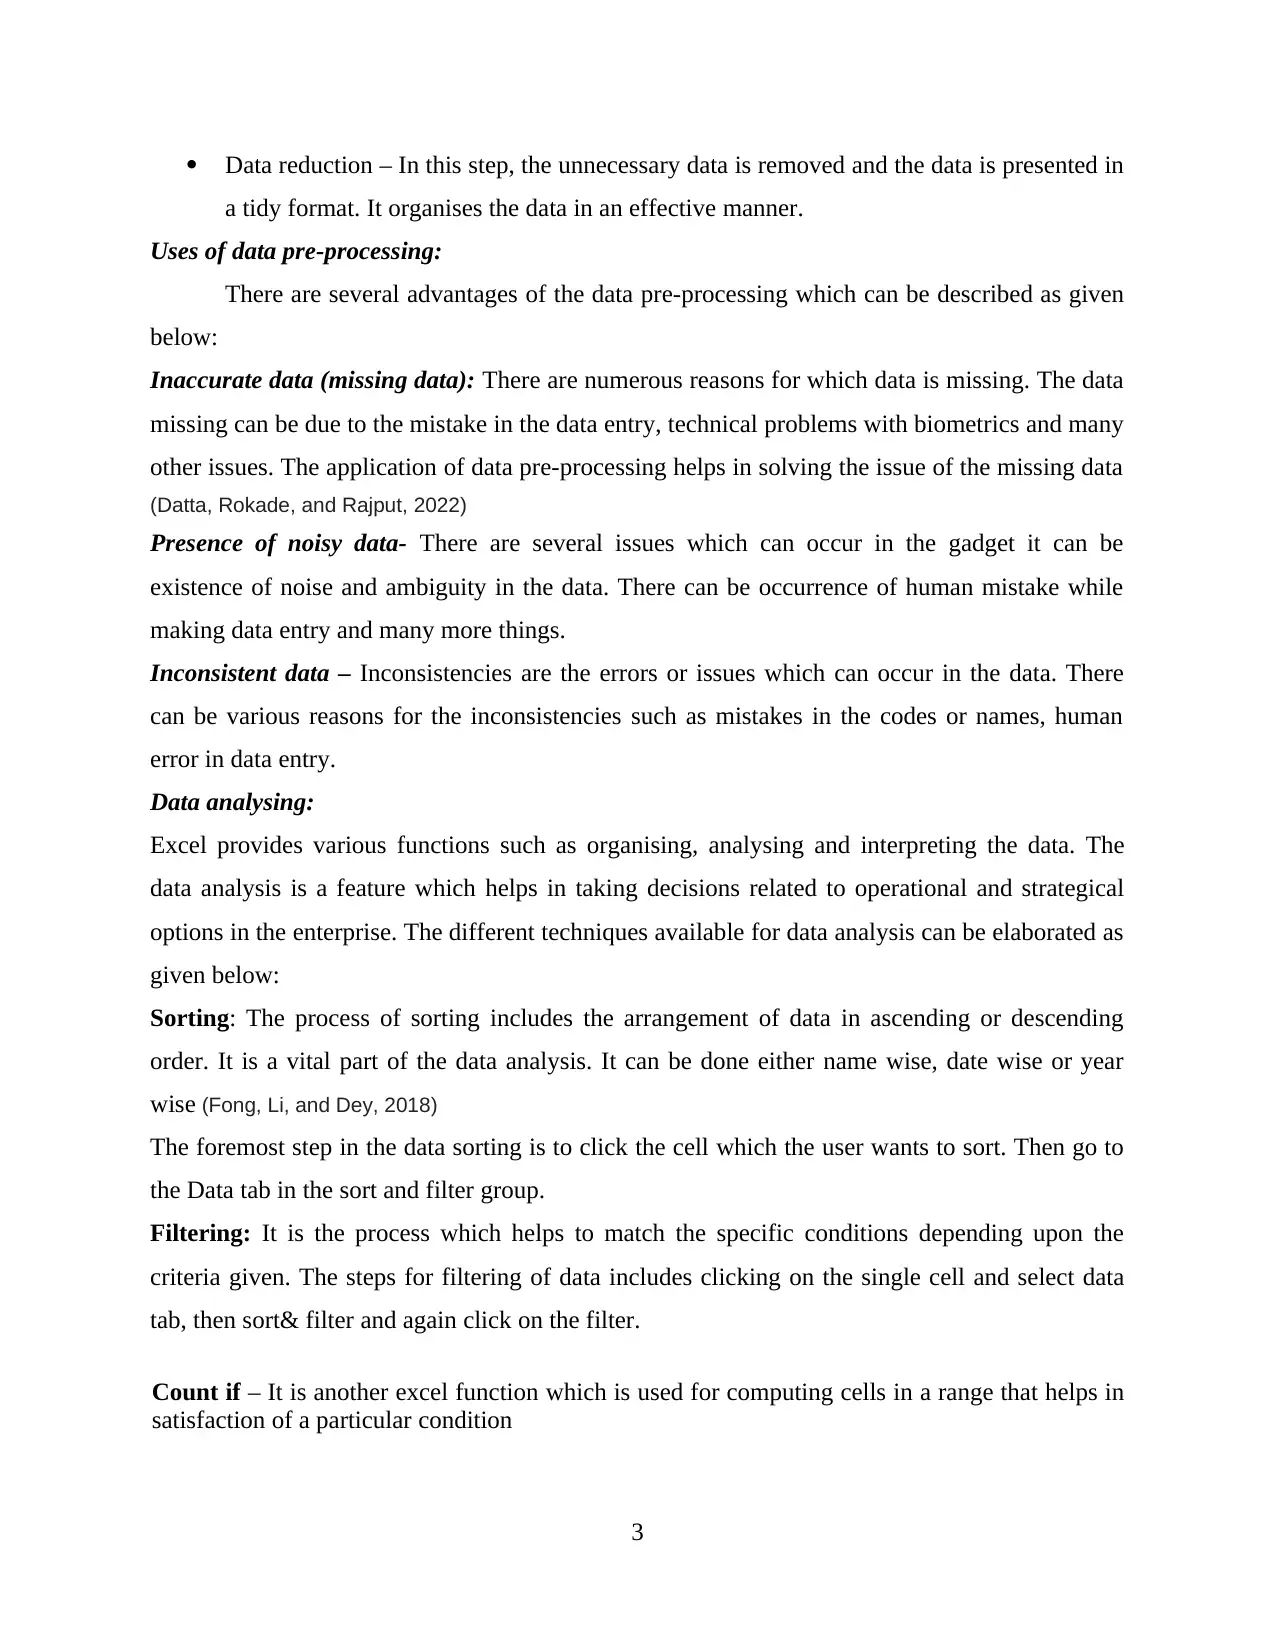
a) Data pre-processing: It involves various steps which convert the raw data into structured
form of data. The raw data is not useful for the analysis. Hence, there are various phases
of the data pre-processing There are various steps which are included in the data pre-
processing can be described as given below:
Data cleaning – it consists missing data, noise, outliers and make a copy of the wrong
records (Chen, Lee, and Chen, 2020).
Data integration – The data is available in the heterogeneous form which means data is
not sorted according to the required category. In this step, it filters the data into the same
class or group which helps in reaching to the conclusions.
Data transformation – There are variety of scales available in the data. The different
scales are nominal, ordinal, interval and ratio. The nominal and ordinal deals with the
qualitative aspects of the data whereas interval and ratio includes quantitative aspects. It
eases by transforming one scale to another.
2
Data is a form of raw facts and figures which is useful in every type of organisation. The
information is extracted from the raw data. This report is divided into two parts. In part one, it
includes the importance of excel for the purpose of analysing and interpreting the data set. Excel
is a part of Microsoft windows which is useful for the complex calculations. It is represented in
the form of spreadsheet (Adinugroho, and Sari, 2018). There are various techniques of the
Microsoft excel such as pre-processing, analysing and visualising the data is also explained in
this report. The use of pivot table, look up and if function by using the given crime data is also
included in this report. In task two, it encompasses the use of descriptive statistics such as mean,
median is taken into consideration. The concept of data mining and text mining methods is
included in the report. The SPSS is a software which helps in performing complex calculations
and interpreting the information for taking various decisions. SPSS and excel both are helpful
tools to take operational, financial and strategical decisions of nay organisation.
MAIN BODY
PART 1
Evaluating the use of excel for pre-processing, analysing and visualising the data.
a) Data pre-processing: It involves various steps which convert the raw data into structured
form of data. The raw data is not useful for the analysis. Hence, there are various phases
of the data pre-processing There are various steps which are included in the data pre-
processing can be described as given below:
Data cleaning – it consists missing data, noise, outliers and make a copy of the wrong
records (Chen, Lee, and Chen, 2020).
Data integration – The data is available in the heterogeneous form which means data is
not sorted according to the required category. In this step, it filters the data into the same
class or group which helps in reaching to the conclusions.
Data transformation – There are variety of scales available in the data. The different
scales are nominal, ordinal, interval and ratio. The nominal and ordinal deals with the
qualitative aspects of the data whereas interval and ratio includes quantitative aspects. It
eases by transforming one scale to another.
2
⊘ This is a preview!⊘
Do you want full access?
Subscribe today to unlock all pages.
Trusted by 1+ million students worldwide
Data reduction – In this step, the unnecessary data is removed and the data is presented in
a tidy format. It organises the data in an effective manner.
Uses of data pre-processing:
There are several advantages of the data pre-processing which can be described as given
below:
Inaccurate data (missing data): There are numerous reasons for which data is missing. The data
missing can be due to the mistake in the data entry, technical problems with biometrics and many
other issues. The application of data pre-processing helps in solving the issue of the missing data
(Datta, Rokade, and Rajput, 2022)
Presence of noisy data- There are several issues which can occur in the gadget it can be
existence of noise and ambiguity in the data. There can be occurrence of human mistake while
making data entry and many more things.
Inconsistent data – Inconsistencies are the errors or issues which can occur in the data. There
can be various reasons for the inconsistencies such as mistakes in the codes or names, human
error in data entry.
Data analysing:
Excel provides various functions such as organising, analysing and interpreting the data. The
data analysis is a feature which helps in taking decisions related to operational and strategical
options in the enterprise. The different techniques available for data analysis can be elaborated as
given below:
Sorting: The process of sorting includes the arrangement of data in ascending or descending
order. It is a vital part of the data analysis. It can be done either name wise, date wise or year
wise (Fong, Li, and Dey, 2018)
The foremost step in the data sorting is to click the cell which the user wants to sort. Then go to
the Data tab in the sort and filter group.
Filtering: It is the process which helps to match the specific conditions depending upon the
criteria given. The steps for filtering of data includes clicking on the single cell and select data
tab, then sort& filter and again click on the filter.
Count if – It is another excel function which is used for computing cells in a range that helps in
satisfaction of a particular condition
3
Paraphrase This Document
Need a fresh take? Get an instant paraphrase of this document with our AI Paraphraser
Sum if: This is a function which is used to add the values of given data set. The addition of
values depends upon the specific condition.
Pivot table: It is the powerful tool for the analysis. It takes the data in large volume and helps to
bring valuable facts to the attention of the researcher.
What if analysis: It is a tool which applies different scenarios by putting different formulas.
Scenarios are the different conditions which are applied on the data.
Solver – It is a tool which helps to find out the solutions to every problems and take decisions on
the behalf of that solution.
Conditional formatting: It is a feature which allows to highlight the cells by using specific
colour which depends on the value of the cell.
Analysis tool Pak: It is an additional tool of excel which provides tool related to finance,
statistical and engineering data analysis.
Visualising data: It is the graphical representation of information and data. It uses various
methods such as charts, graphs and maps. There are various tools which can be used for
visualising the data are as follows:
Pie chart: It is a type of graph which presents the data in circular manner which is
divided into various sectors (Kirilenko, Stepchenkova, and Li, 2018)
Bar chart: It is a type of chart which reflects the data in rectangular bars with height or
length. The vertical type of chart is known as column chart and it can be plotted vertically
or horizontally.
Histograms: It arranges the data in different ranges. It helps in summarising discrete or
continuous data that is used to measure on a scale which is interval.
Areas charts: It displays quantitative data. It shows the progression of variable of
different times.
Scatter plots: It is a diagram which shows the relationship between different variables. It
shows whether a linear or nonlinear, strong or weak, positive or negative.
There are better advantages of data visualisation tools:
Better agreement: In every situation, there are two different situations.
A superior method: It presents the information in a pictorial structure. It will help to give
comprehensive view of the data.
Simple sharing of data: It will help to share the data with multiple people.
4
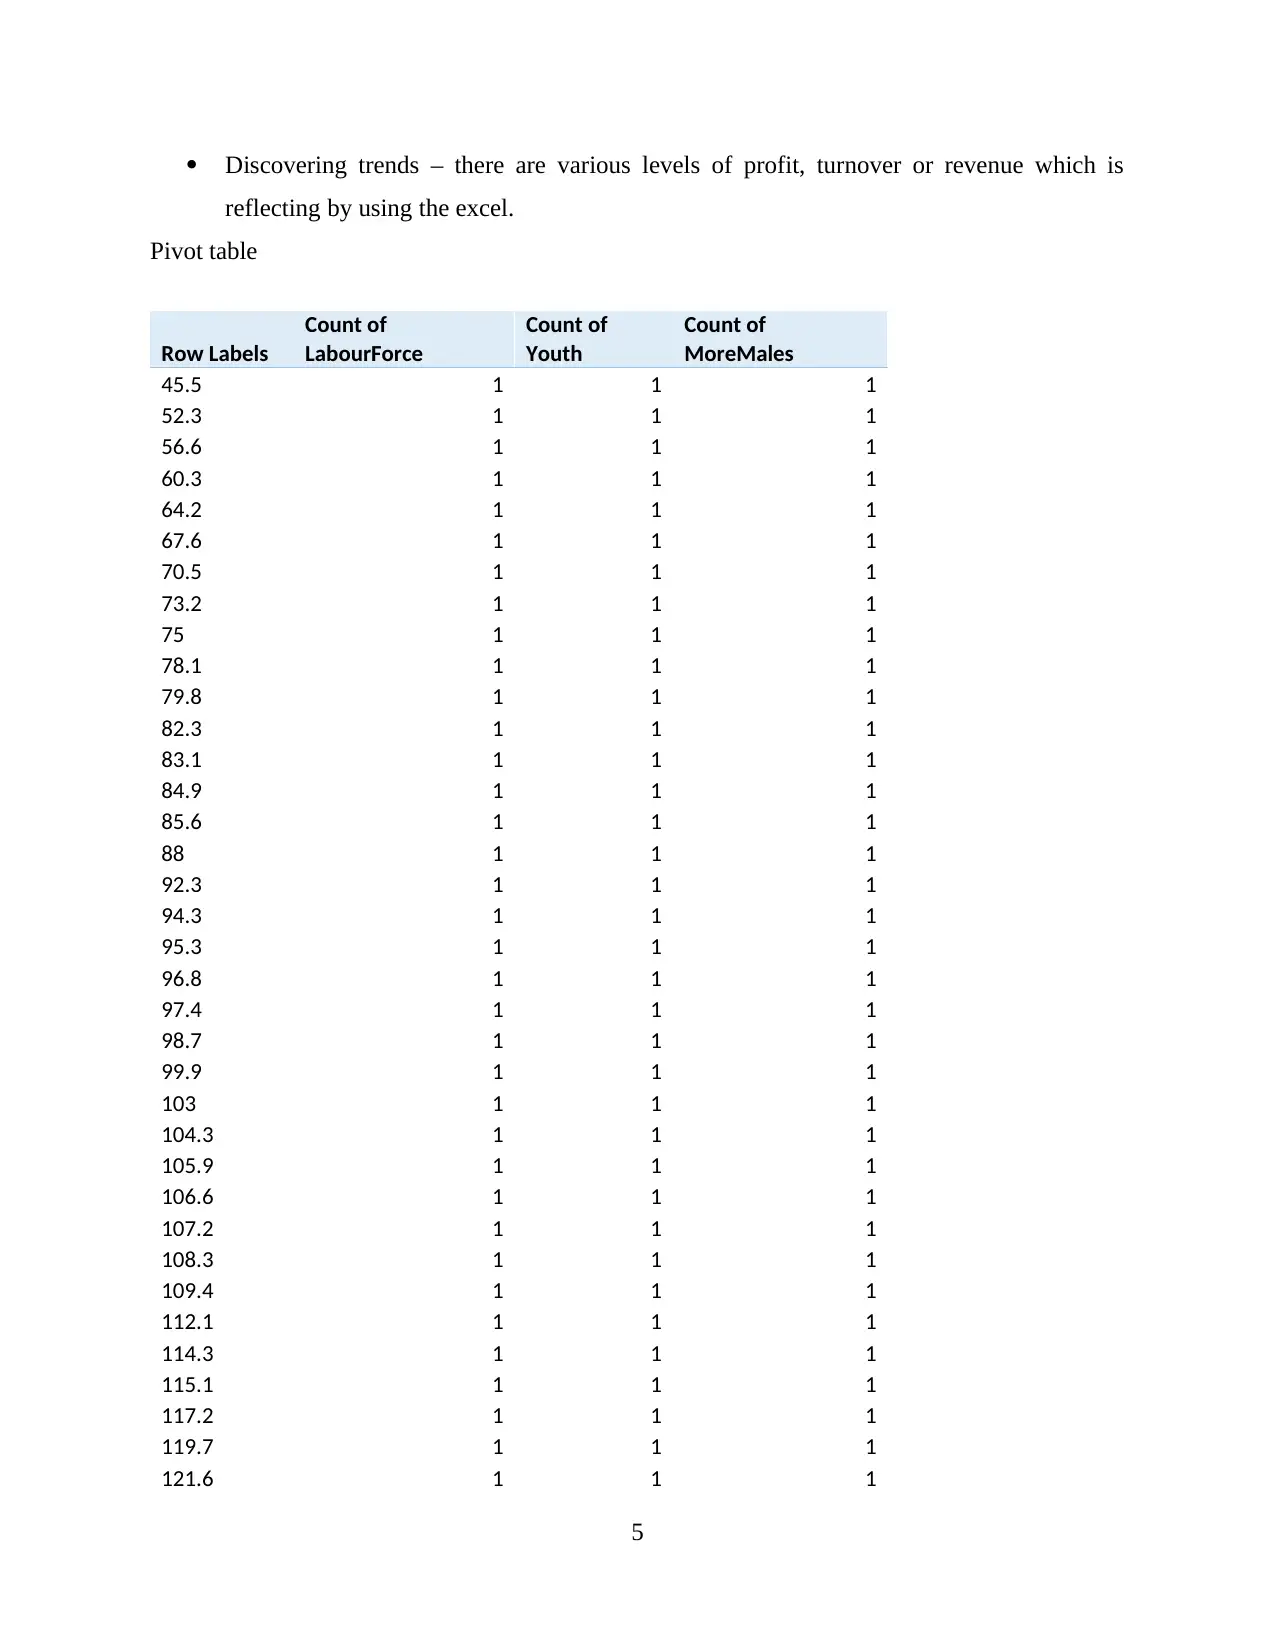
Discovering trends – there are various levels of profit, turnover or revenue which is
reflecting by using the excel.
Pivot table
Row Labels
Count of
LabourForce
Count of
Youth
Count of
MoreMales
45.5 1 1 1
52.3 1 1 1
56.6 1 1 1
60.3 1 1 1
64.2 1 1 1
67.6 1 1 1
70.5 1 1 1
73.2 1 1 1
75 1 1 1
78.1 1 1 1
79.8 1 1 1
82.3 1 1 1
83.1 1 1 1
84.9 1 1 1
85.6 1 1 1
88 1 1 1
92.3 1 1 1
94.3 1 1 1
95.3 1 1 1
96.8 1 1 1
97.4 1 1 1
98.7 1 1 1
99.9 1 1 1
103 1 1 1
104.3 1 1 1
105.9 1 1 1
106.6 1 1 1
107.2 1 1 1
108.3 1 1 1
109.4 1 1 1
112.1 1 1 1
114.3 1 1 1
115.1 1 1 1
117.2 1 1 1
119.7 1 1 1
121.6 1 1 1
5
⊘ This is a preview!⊘
Do you want full access?
Subscribe today to unlock all pages.
Trusted by 1+ million students worldwide
123.4 1 1 1
127.2 1 1 1
132.4 1 1 1
135.5 1 1 1
137.8 1 1 1
140.8 1 1 1
145.4 1 1 1
149.3 1 1 1
154.3 1 1 1
157.7 1 1 1
161.8 1 1 1
Grand Total 47 47 47
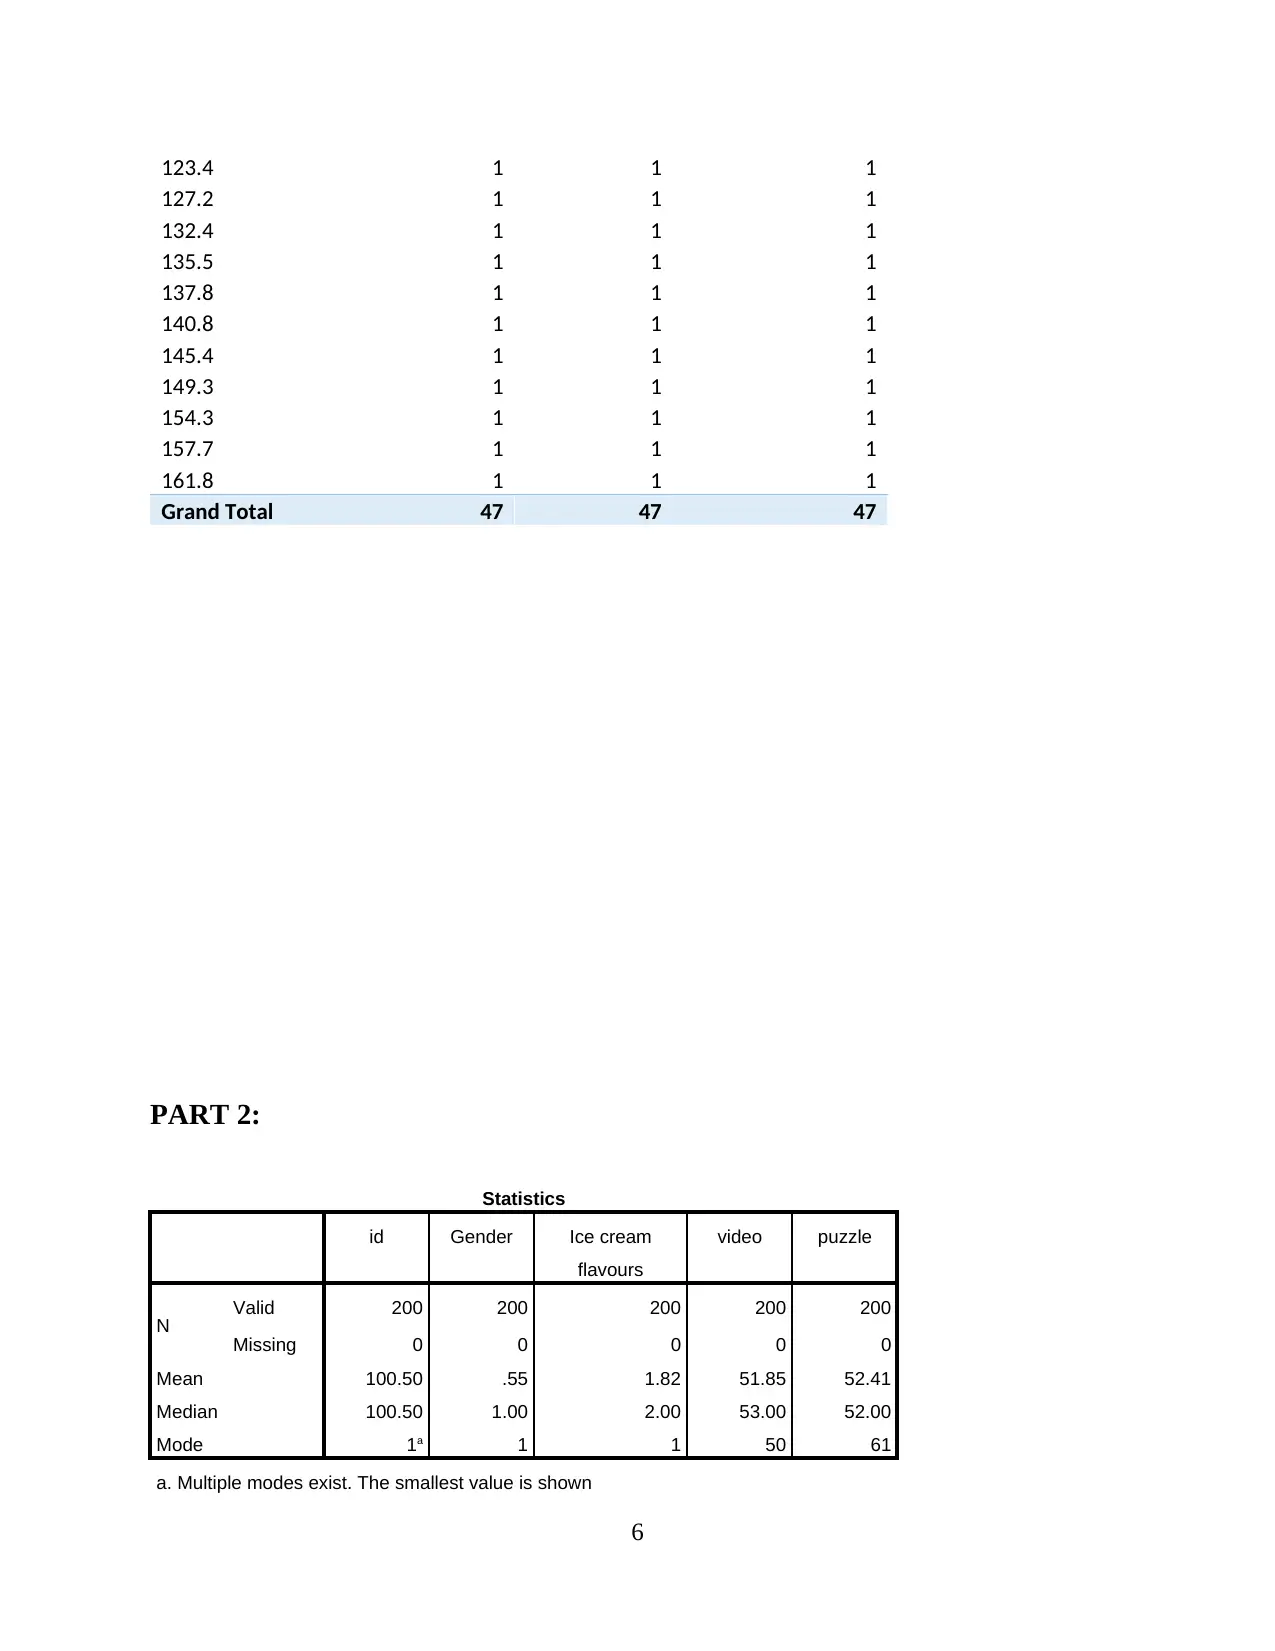
PART 2:
Statistics
id Gender Ice cream
flavours
video puzzle
N Valid 200 200 200 200 200
Missing 0 0 0 0 0
Mean 100.50 .55 1.82 51.85 52.41
Median 100.50 1.00 2.00 53.00 52.00
Mode 1a 1 1 50 61
a. Multiple modes exist. The smallest value is shown
6
127.2 1 1 1
132.4 1 1 1
135.5 1 1 1
137.8 1 1 1
140.8 1 1 1
145.4 1 1 1
149.3 1 1 1
154.3 1 1 1
157.7 1 1 1
161.8 1 1 1
Grand Total 47 47 47
PART 2:
Statistics
id Gender Ice cream
flavours
video puzzle
N Valid 200 200 200 200 200
Missing 0 0 0 0 0
Mean 100.50 .55 1.82 51.85 52.41
Median 100.50 1.00 2.00 53.00 52.00
Mode 1a 1 1 50 61
a. Multiple modes exist. The smallest value is shown
6
Paraphrase This Document
Need a fresh take? Get an instant paraphrase of this document with our AI Paraphraser
Gender
Frequency Percent Valid Percent Cumulative
Percent
Valid
Male 91 45.5 45.5 45.5
Female 109 54.5 54.5 100.0
Total 200 100.0 100.0
Ice cream flavours
Frequency Percent Valid Percent Cumulative
Percent
Valid Vanilla 95 47.5 47.5 47.5
Chocolate 47 23.5 23.5 71.0
7
Frequency Percent Valid Percent Cumulative
Percent
Valid
Male 91 45.5 45.5 45.5
Female 109 54.5 54.5 100.0
Total 200 100.0 100.0
Ice cream flavours
Frequency Percent Valid Percent Cumulative
Percent
Valid Vanilla 95 47.5 47.5 47.5
Chocolate 47 23.5 23.5 71.0
7
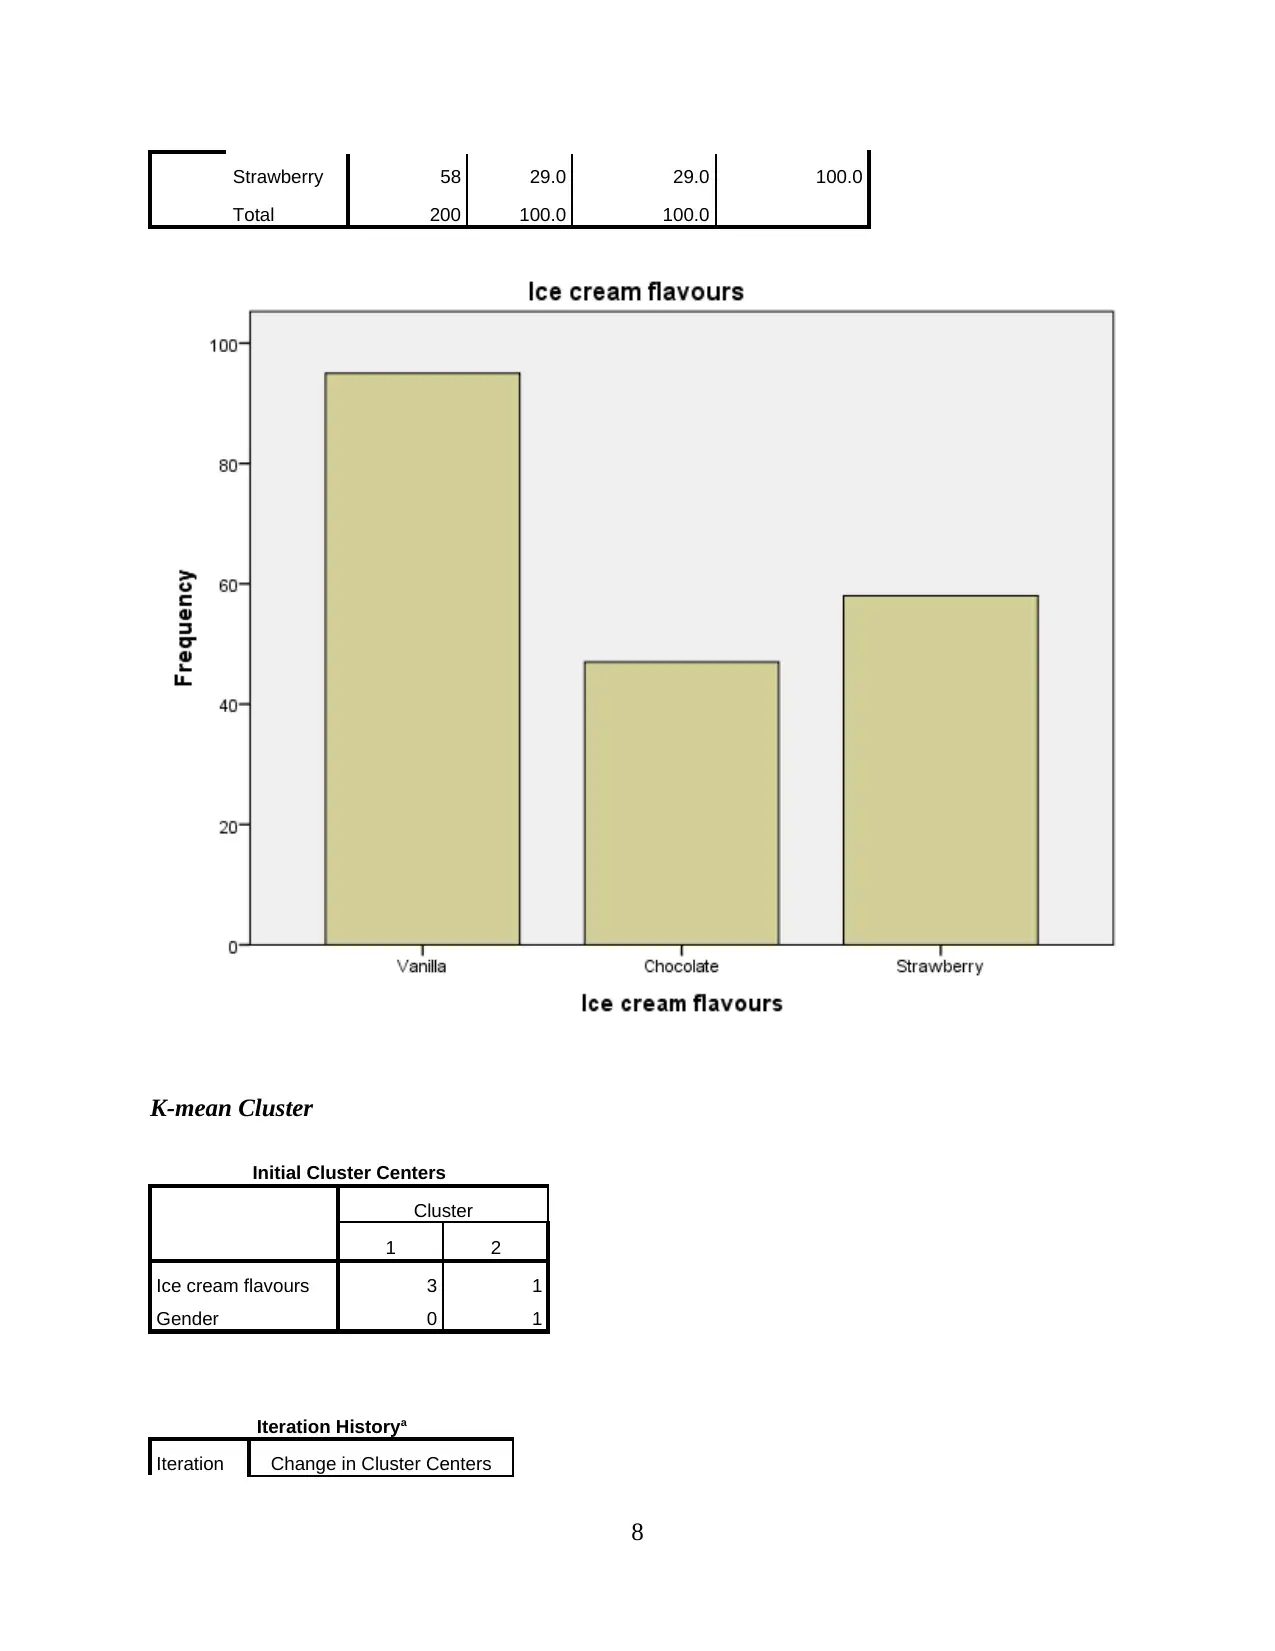
Strawberry 58 29.0 29.0 100.0
Total 200 100.0 100.0
K-mean Cluster
Initial Cluster Centers
Cluster
1 2
Ice cream flavours 3 1
Gender 0 1
Iteration Historya
Iteration Change in Cluster Centers
8
Total 200 100.0 100.0
K-mean Cluster
Initial Cluster Centers
Cluster
1 2
Ice cream flavours 3 1
Gender 0 1
Iteration Historya
Iteration Change in Cluster Centers
8
⊘ This is a preview!⊘
Do you want full access?
Subscribe today to unlock all pages.
Trusted by 1+ million students worldwide
1 2
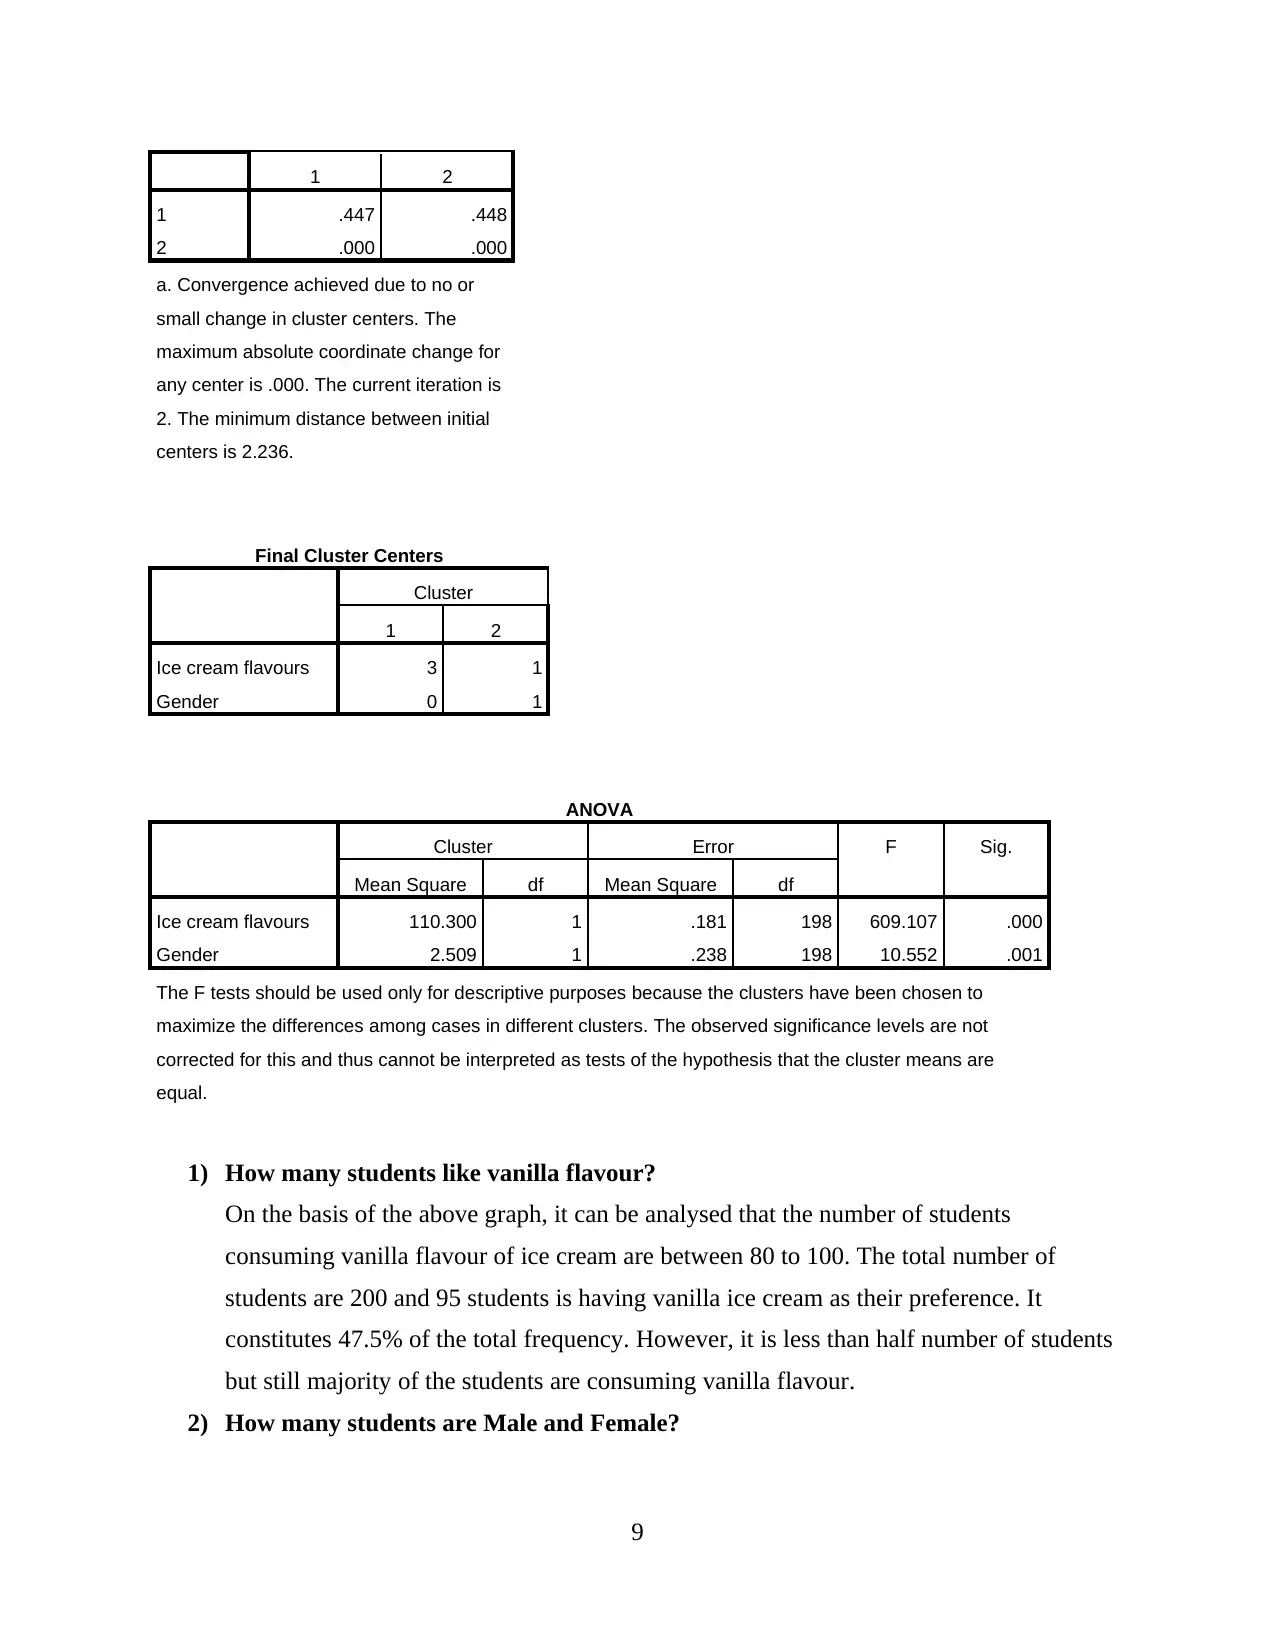
1 .447 .448
2 .000 .000
a. Convergence achieved due to no or
small change in cluster centers. The
maximum absolute coordinate change for
any center is .000. The current iteration is
2. The minimum distance between initial
centers is 2.236.
Final Cluster Centers
Cluster
1 2
Ice cream flavours 3 1
Gender 0 1
ANOVA
Cluster Error F Sig.
Mean Square df Mean Square df
Ice cream flavours 110.300 1 .181 198 609.107 .000
Gender 2.509 1 .238 198 10.552 .001
The F tests should be used only for descriptive purposes because the clusters have been chosen to
maximize the differences among cases in different clusters. The observed significance levels are not
corrected for this and thus cannot be interpreted as tests of the hypothesis that the cluster means are
equal.
1) How many students like vanilla flavour?
On the basis of the above graph, it can be analysed that the number of students
consuming vanilla flavour of ice cream are between 80 to 100. The total number of
students are 200 and 95 students is having vanilla ice cream as their preference. It
constitutes 47.5% of the total frequency. However, it is less than half number of students
but still majority of the students are consuming vanilla flavour.
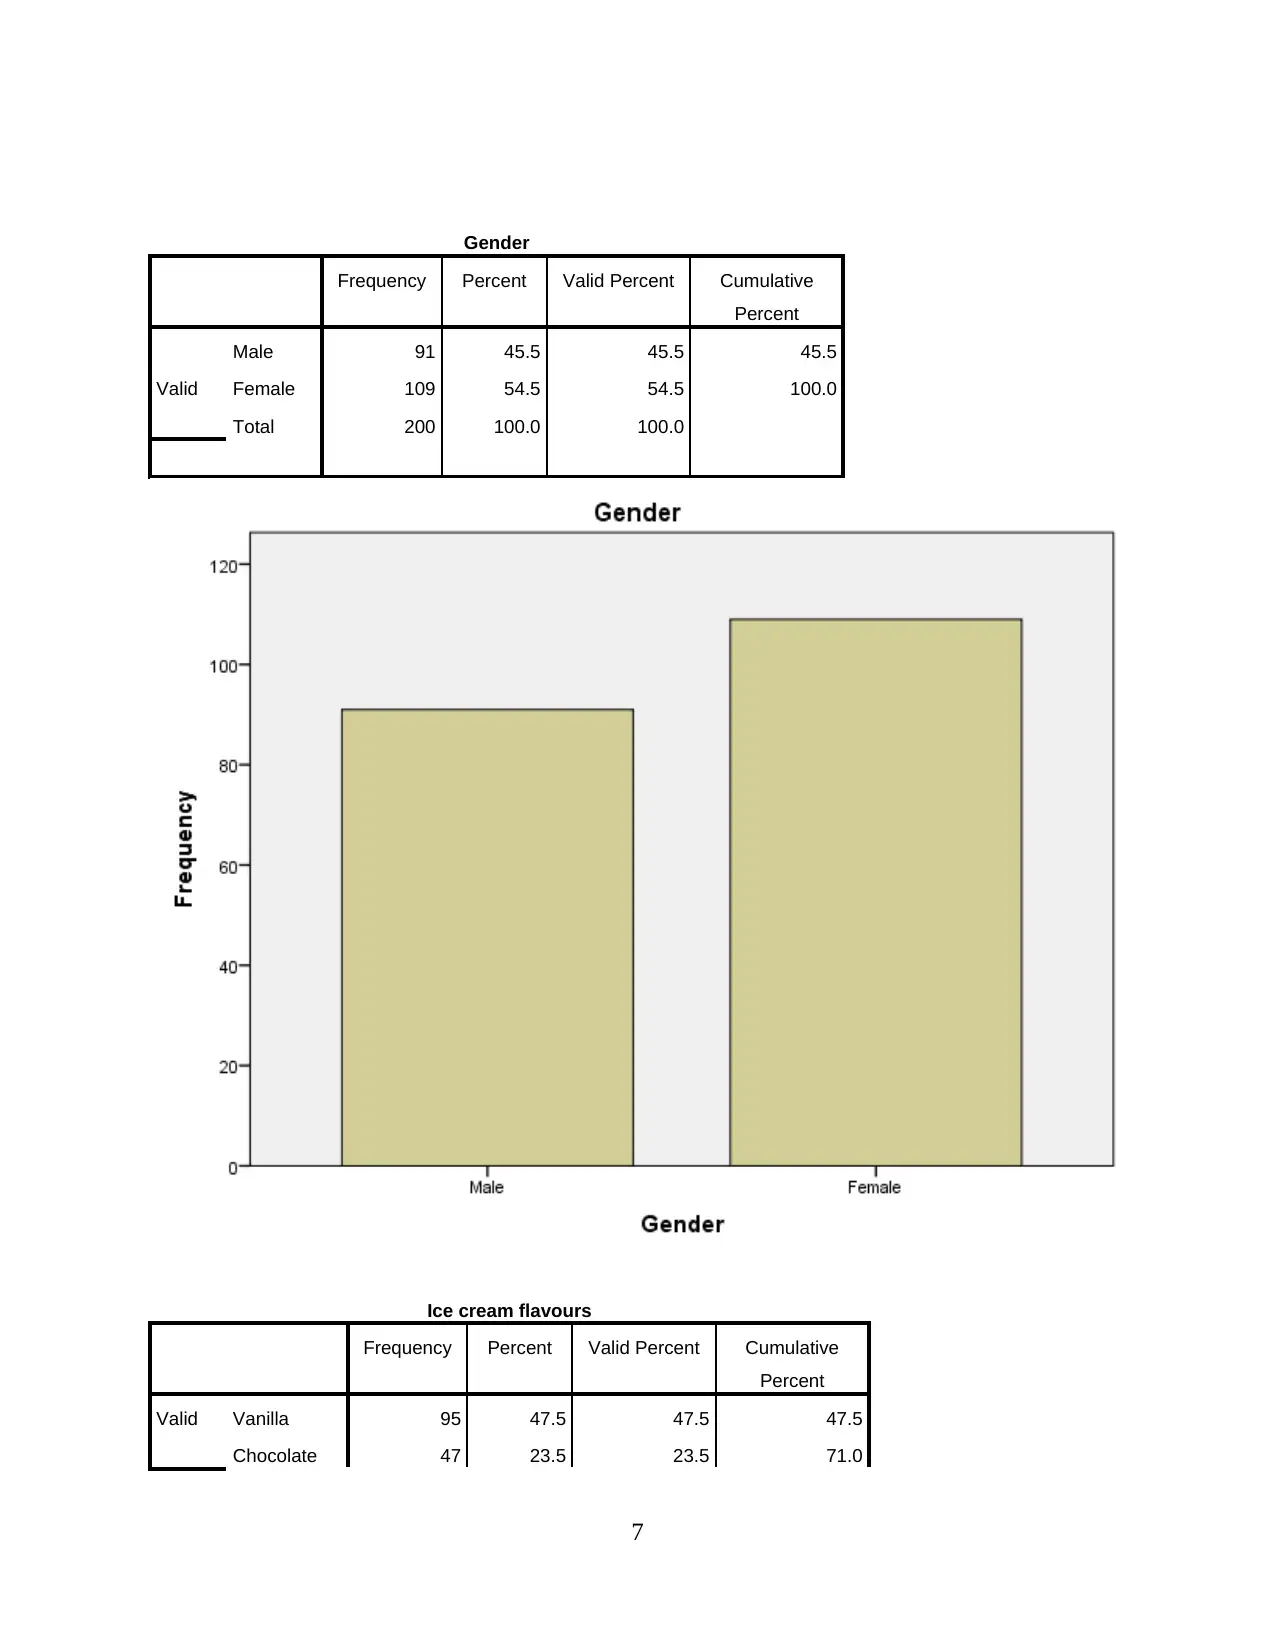
2) How many students are Male and Female?
9
1 .447 .448
2 .000 .000
a. Convergence achieved due to no or
small change in cluster centers. The
maximum absolute coordinate change for
any center is .000. The current iteration is
2. The minimum distance between initial
centers is 2.236.
Final Cluster Centers
Cluster
1 2
Ice cream flavours 3 1
Gender 0 1
ANOVA
Cluster Error F Sig.
Mean Square df Mean Square df
Ice cream flavours 110.300 1 .181 198 609.107 .000
Gender 2.509 1 .238 198 10.552 .001
The F tests should be used only for descriptive purposes because the clusters have been chosen to
maximize the differences among cases in different clusters. The observed significance levels are not
corrected for this and thus cannot be interpreted as tests of the hypothesis that the cluster means are
equal.
1) How many students like vanilla flavour?
On the basis of the above graph, it can be analysed that the number of students
consuming vanilla flavour of ice cream are between 80 to 100. The total number of
students are 200 and 95 students is having vanilla ice cream as their preference. It
constitutes 47.5% of the total frequency. However, it is less than half number of students
but still majority of the students are consuming vanilla flavour.
2) How many students are Male and Female?
9
Paraphrase This Document
Need a fresh take? Get an instant paraphrase of this document with our AI Paraphraser
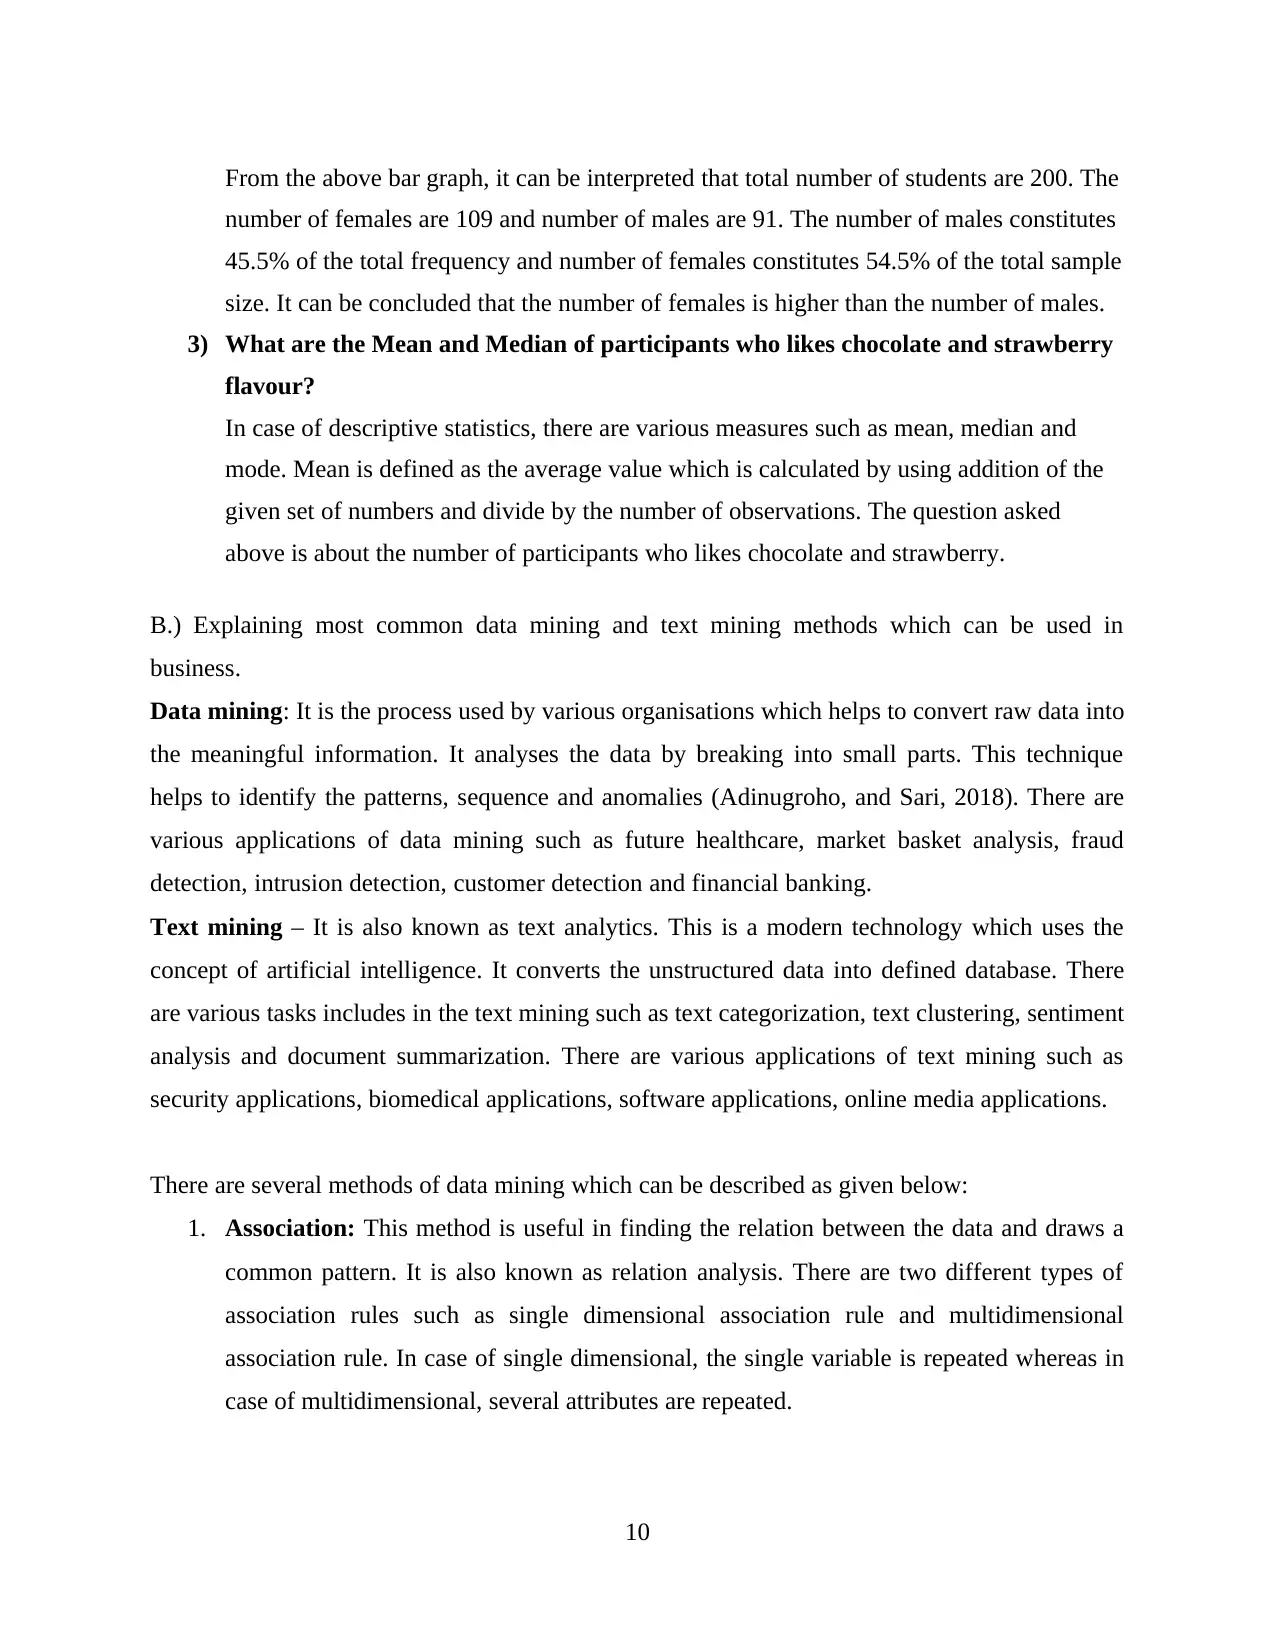
From the above bar graph, it can be interpreted that total number of students are 200. The
number of females are 109 and number of males are 91. The number of males constitutes
45.5% of the total frequency and number of females constitutes 54.5% of the total sample
size. It can be concluded that the number of females is higher than the number of males.
3) What are the Mean and Median of participants who likes chocolate and strawberry
flavour?
In case of descriptive statistics, there are various measures such as mean, median and
mode. Mean is defined as the average value which is calculated by using addition of the
given set of numbers and divide by the number of observations. The question asked
above is about the number of participants who likes chocolate and strawberry.
B.) Explaining most common data mining and text mining methods which can be used in
business.
Data mining: It is the process used by various organisations which helps to convert raw data into
the meaningful information. It analyses the data by breaking into small parts. This technique
helps to identify the patterns, sequence and anomalies (Adinugroho, and Sari, 2018). There are
various applications of data mining such as future healthcare, market basket analysis, fraud
detection, intrusion detection, customer detection and financial banking.
Text mining – It is also known as text analytics. This is a modern technology which uses the
concept of artificial intelligence. It converts the unstructured data into defined database. There
are various tasks includes in the text mining such as text categorization, text clustering, sentiment
analysis and document summarization. There are various applications of text mining such as
security applications, biomedical applications, software applications, online media applications.
There are several methods of data mining which can be described as given below:
1. Association: This method is useful in finding the relation between the data and draws a
common pattern. It is also known as relation analysis. There are two different types of
association rules such as single dimensional association rule and multidimensional
association rule. In case of single dimensional, the single variable is repeated whereas in
case of multidimensional, several attributes are repeated.
10
2. Classification: it is a method which differentiate the items into groups or classes. It is a
twostep process such as training phase and classification phase.
There are different techniques of text mining which can be described as given below:
1. Clustering: It is method in which textual information is organized into subgroups. It
is a process which helps in distribution of data. Data algorithms are the step by the
step procedure of the problem to be solved (Sanchez-Franco, Cepeda-Carrion, and
Roldan, 2019). These algorithms are further presented into flowcharts. The tools used
for formation of clusters are carrot and rapid miner.
2. Summarisation: It is a technique which helps to compress the data by integrating the
data from several sources. It helps in preparing the reports in a summarised form
which helps to keep the overall meaning same and produce an information in a
concise format. The tools used for summarisation of data are Tropic tracking tool,
sentence Ext tool.
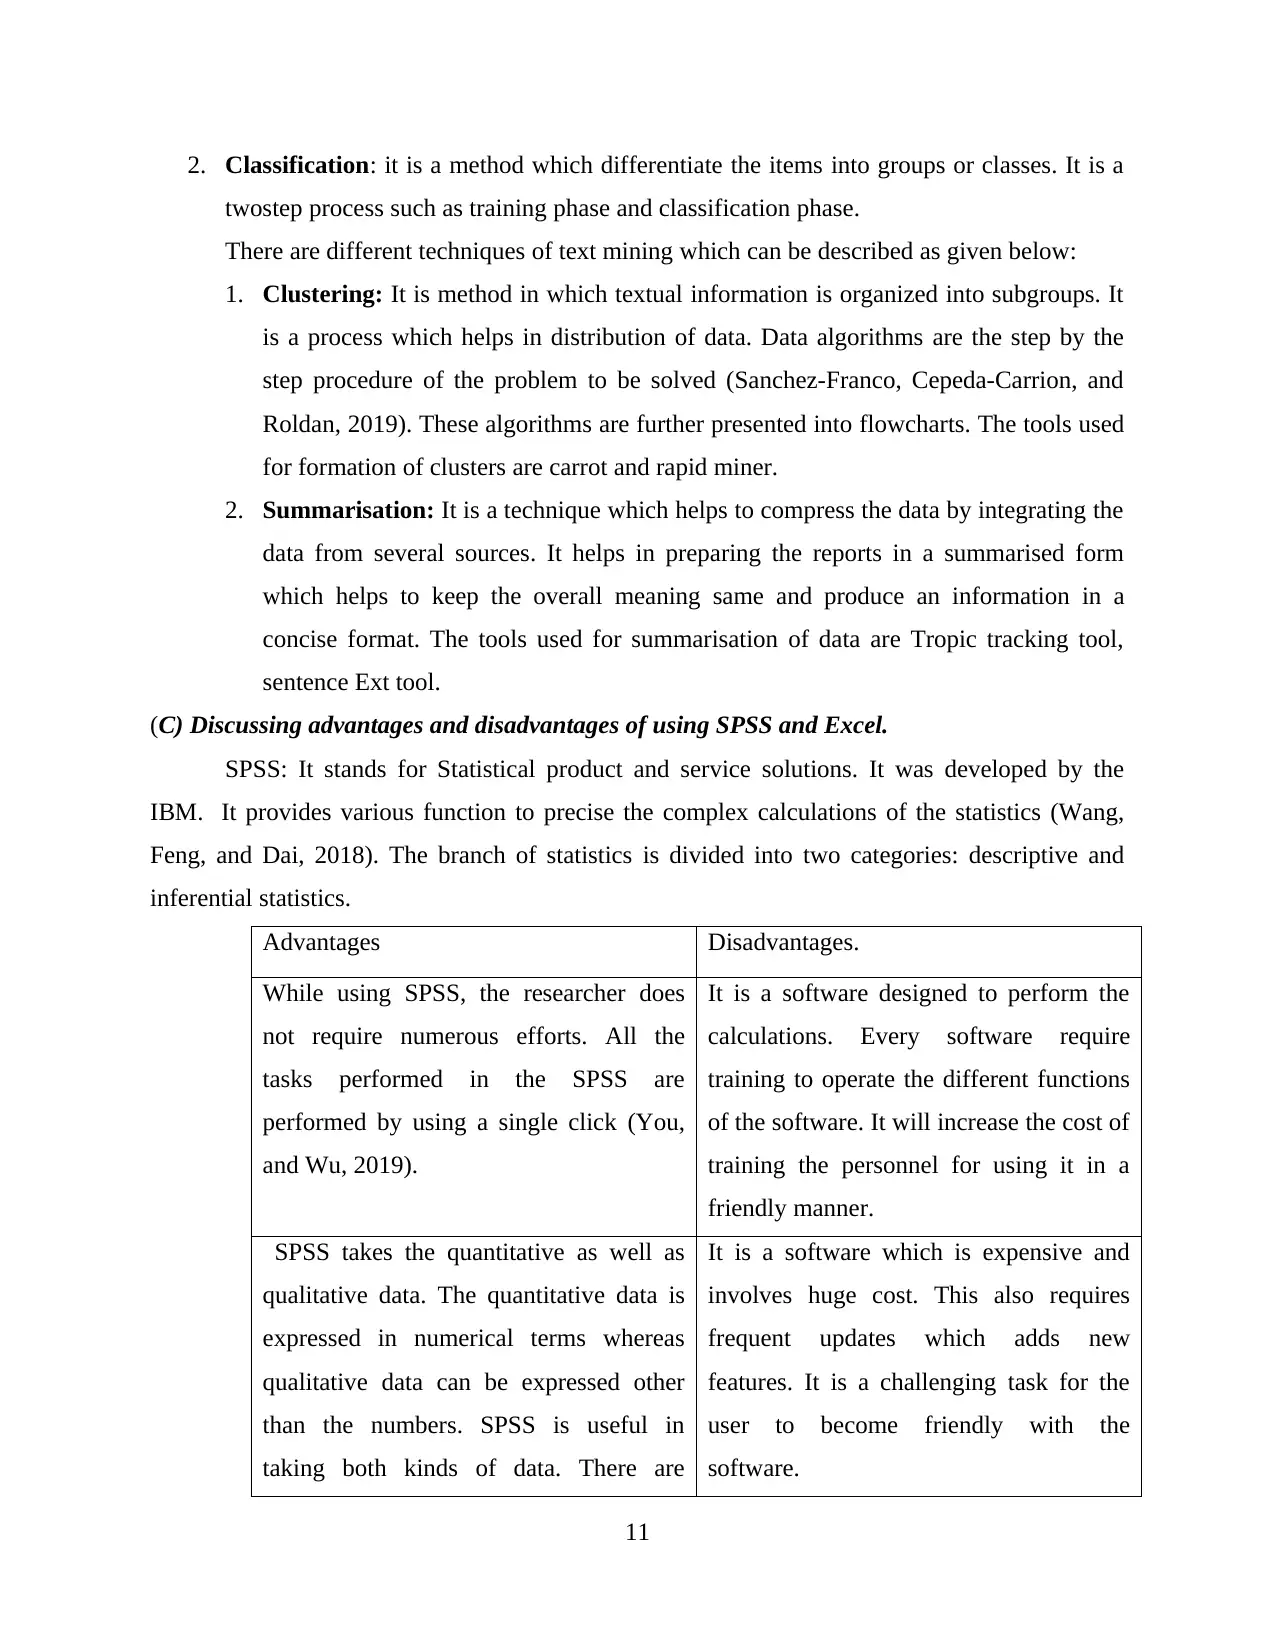
(C) Discussing advantages and disadvantages of using SPSS and Excel.
SPSS: It stands for Statistical product and service solutions. It was developed by the
IBM. It provides various function to precise the complex calculations of the statistics (Wang,
Feng, and Dai, 2018). The branch of statistics is divided into two categories: descriptive and
inferential statistics.
Advantages Disadvantages.
While using SPSS, the researcher does
not require numerous efforts. All the
tasks performed in the SPSS are
performed by using a single click (You,
and Wu, 2019).
It is a software designed to perform the
calculations. Every software require
training to operate the different functions
of the software. It will increase the cost of
training the personnel for using it in a
friendly manner.
SPSS takes the quantitative as well as
qualitative data. The quantitative data is
expressed in numerical terms whereas
qualitative data can be expressed other
than the numbers. SPSS is useful in
taking both kinds of data. There are
It is a software which is expensive and
involves huge cost. This also requires
frequent updates which adds new
features. It is a challenging task for the
user to become friendly with the
software.
11
twostep process such as training phase and classification phase.
There are different techniques of text mining which can be described as given below:
1. Clustering: It is method in which textual information is organized into subgroups. It
is a process which helps in distribution of data. Data algorithms are the step by the
step procedure of the problem to be solved (Sanchez-Franco, Cepeda-Carrion, and
Roldan, 2019). These algorithms are further presented into flowcharts. The tools used
for formation of clusters are carrot and rapid miner.
2. Summarisation: It is a technique which helps to compress the data by integrating the
data from several sources. It helps in preparing the reports in a summarised form
which helps to keep the overall meaning same and produce an information in a
concise format. The tools used for summarisation of data are Tropic tracking tool,
sentence Ext tool.
(C) Discussing advantages and disadvantages of using SPSS and Excel.
SPSS: It stands for Statistical product and service solutions. It was developed by the
IBM. It provides various function to precise the complex calculations of the statistics (Wang,
Feng, and Dai, 2018). The branch of statistics is divided into two categories: descriptive and
inferential statistics.
Advantages Disadvantages.
While using SPSS, the researcher does
not require numerous efforts. All the
tasks performed in the SPSS are
performed by using a single click (You,
and Wu, 2019).
It is a software designed to perform the
calculations. Every software require
training to operate the different functions
of the software. It will increase the cost of
training the personnel for using it in a
friendly manner.
SPSS takes the quantitative as well as
qualitative data. The quantitative data is
expressed in numerical terms whereas
qualitative data can be expressed other
than the numbers. SPSS is useful in
taking both kinds of data. There are
It is a software which is expensive and
involves huge cost. This also requires
frequent updates which adds new
features. It is a challenging task for the
user to become friendly with the
software.
11
⊘ This is a preview!⊘
Do you want full access?
Subscribe today to unlock all pages.
Trusted by 1+ million students worldwide
1 out of 16
Related Documents


Your All-in-One AI-Powered Toolkit for Academic Success.
+13062052269
info@desklib.com
Available 24*7 on WhatsApp / Email
![[object Object]](/_next/static/media/star-bottom.7253800d.svg)
Unlock your academic potential
Copyright © 2020–2026 A2Z Services. All Rights Reserved. Developed and managed by ZUCOL.