McDonald's Performance: An Excel-Driven Statistical Analysis Report
VerifiedAdded on 2023/06/12
|7
|1204
|459
Report
AI Summary
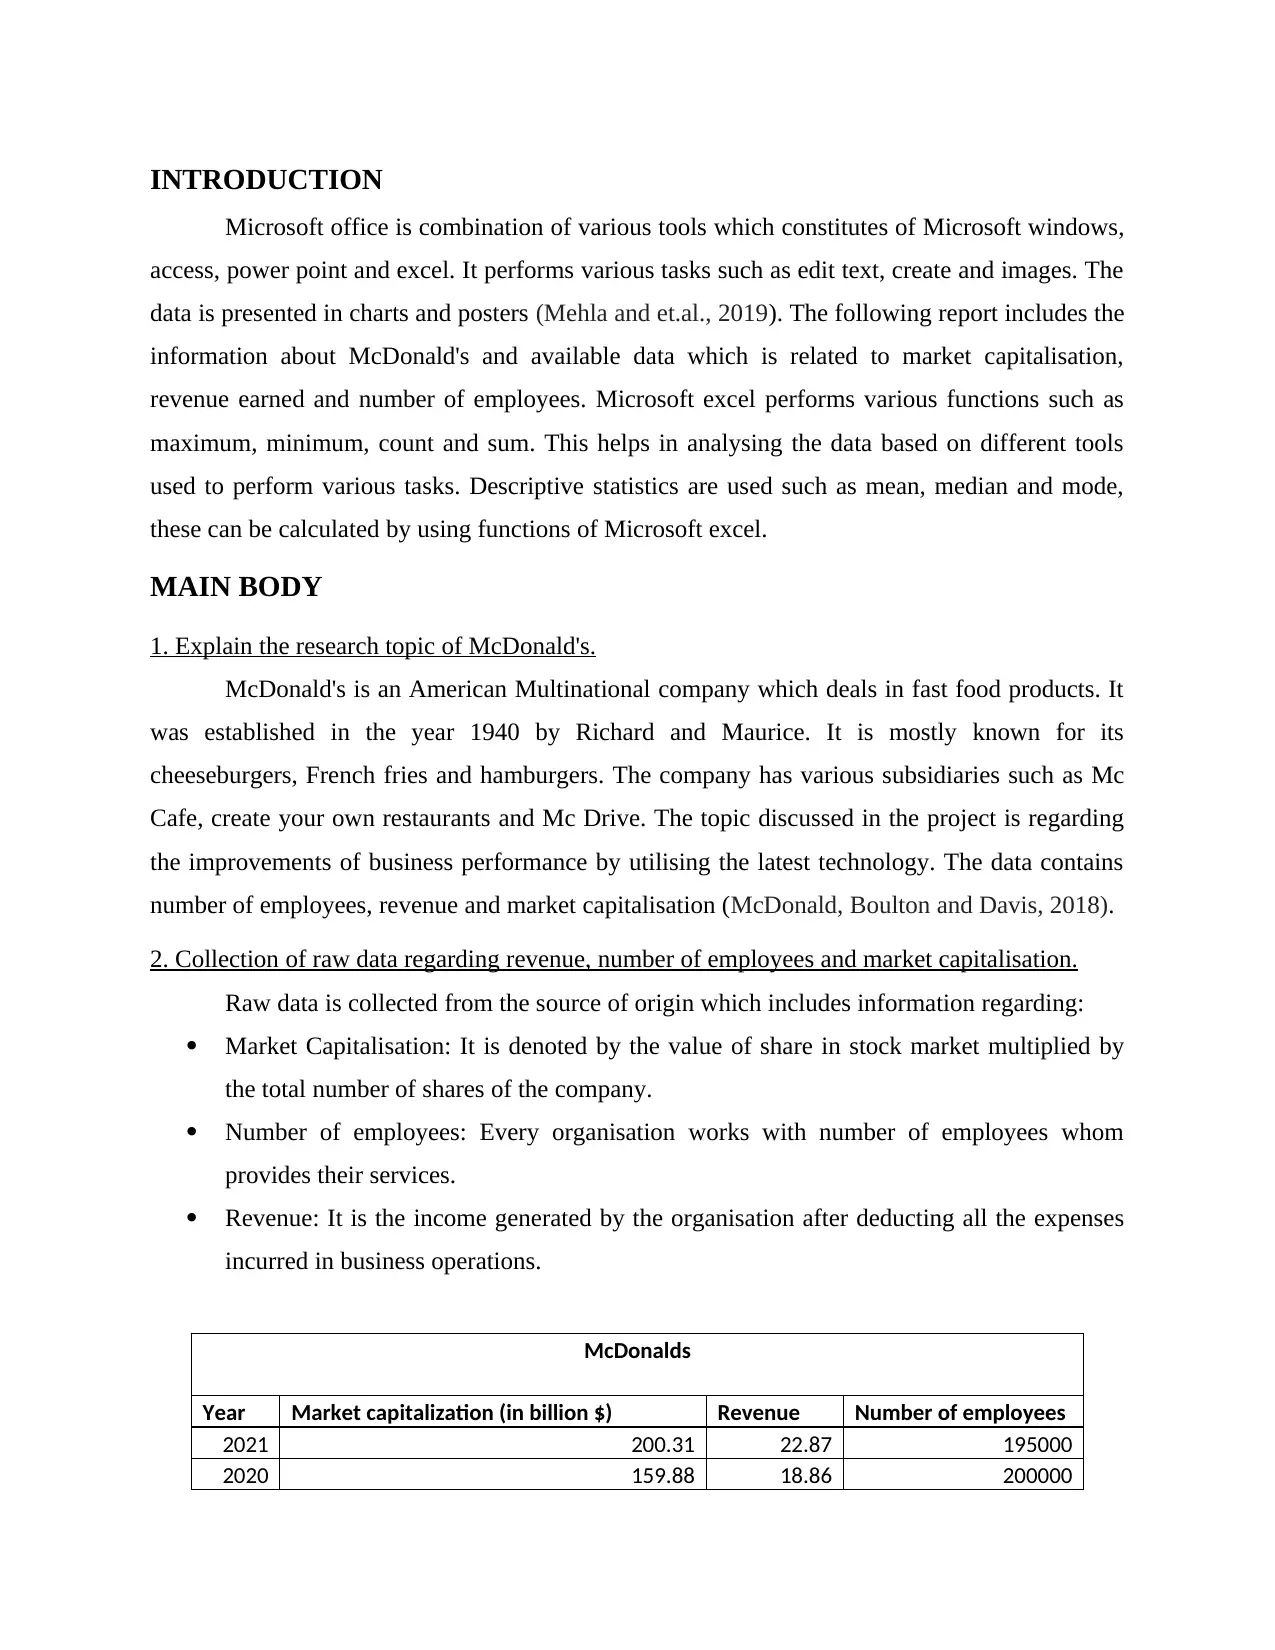
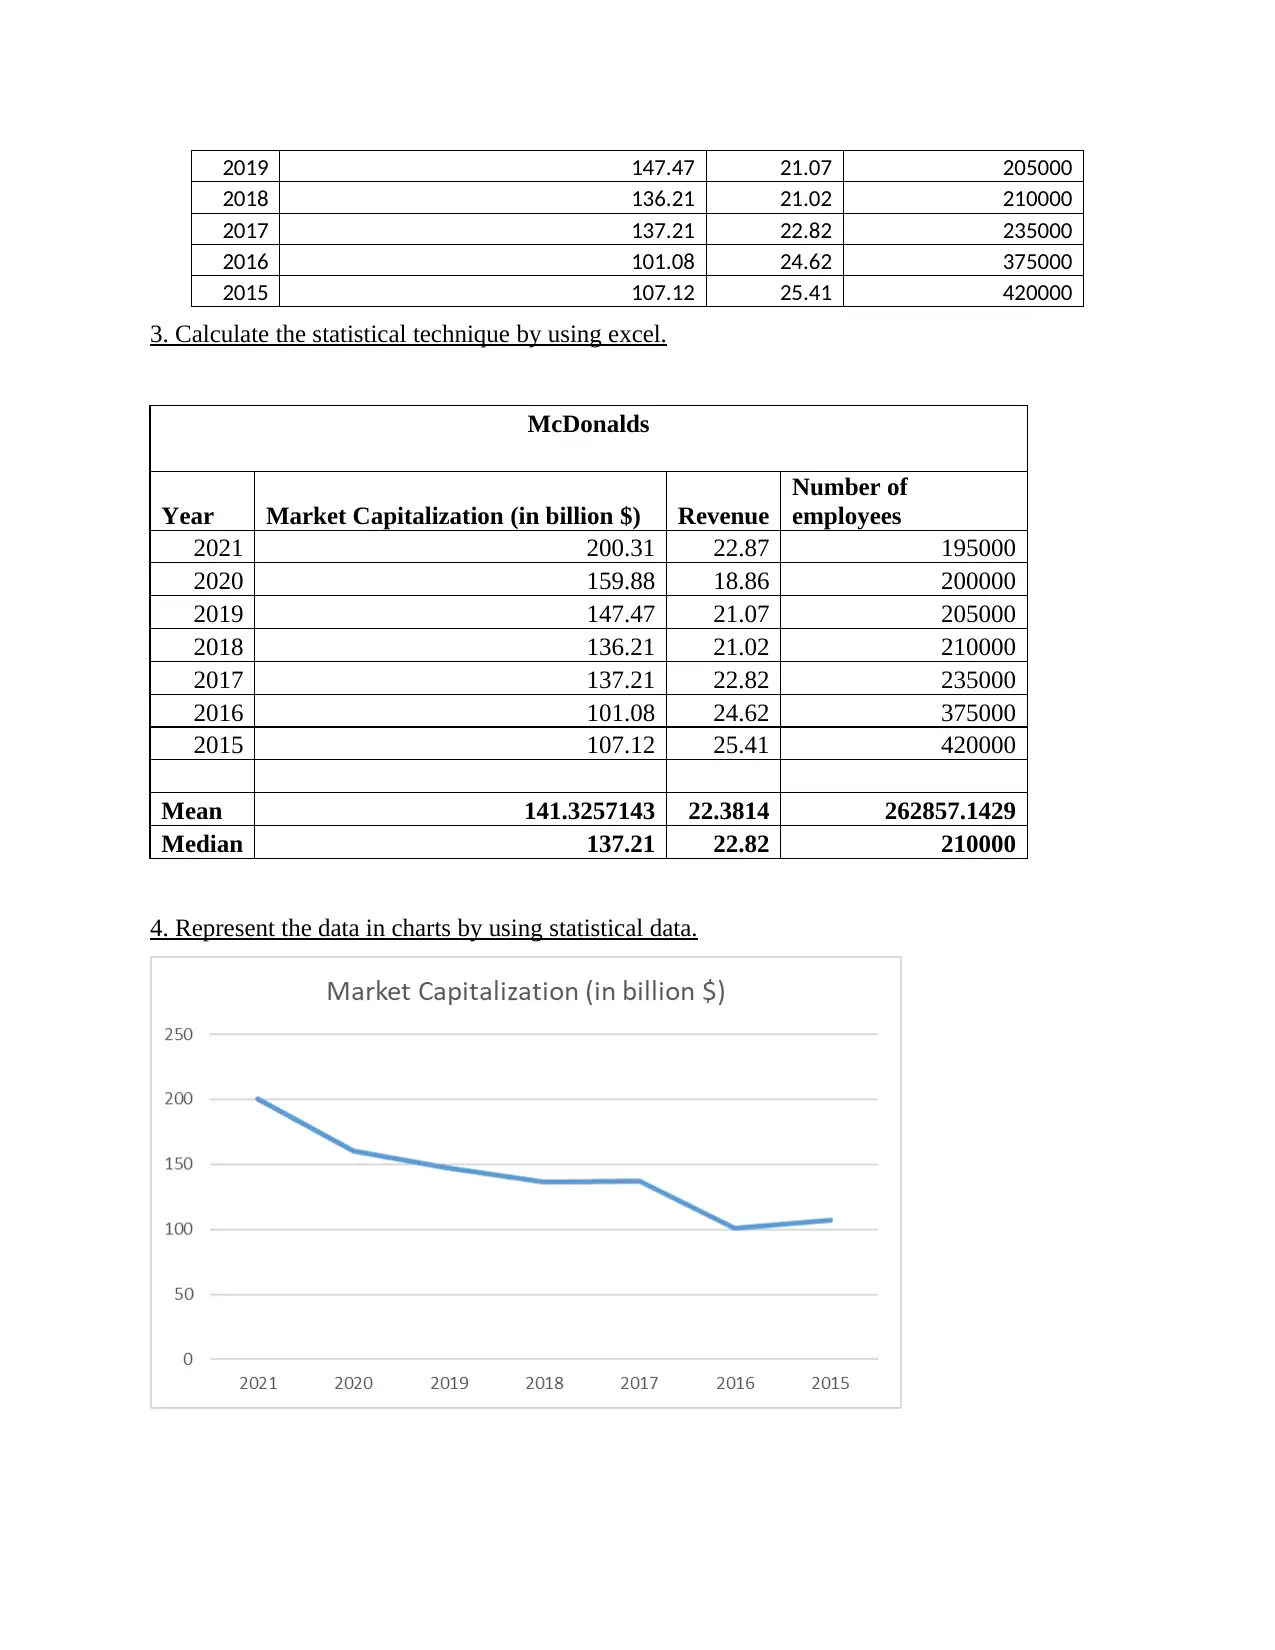
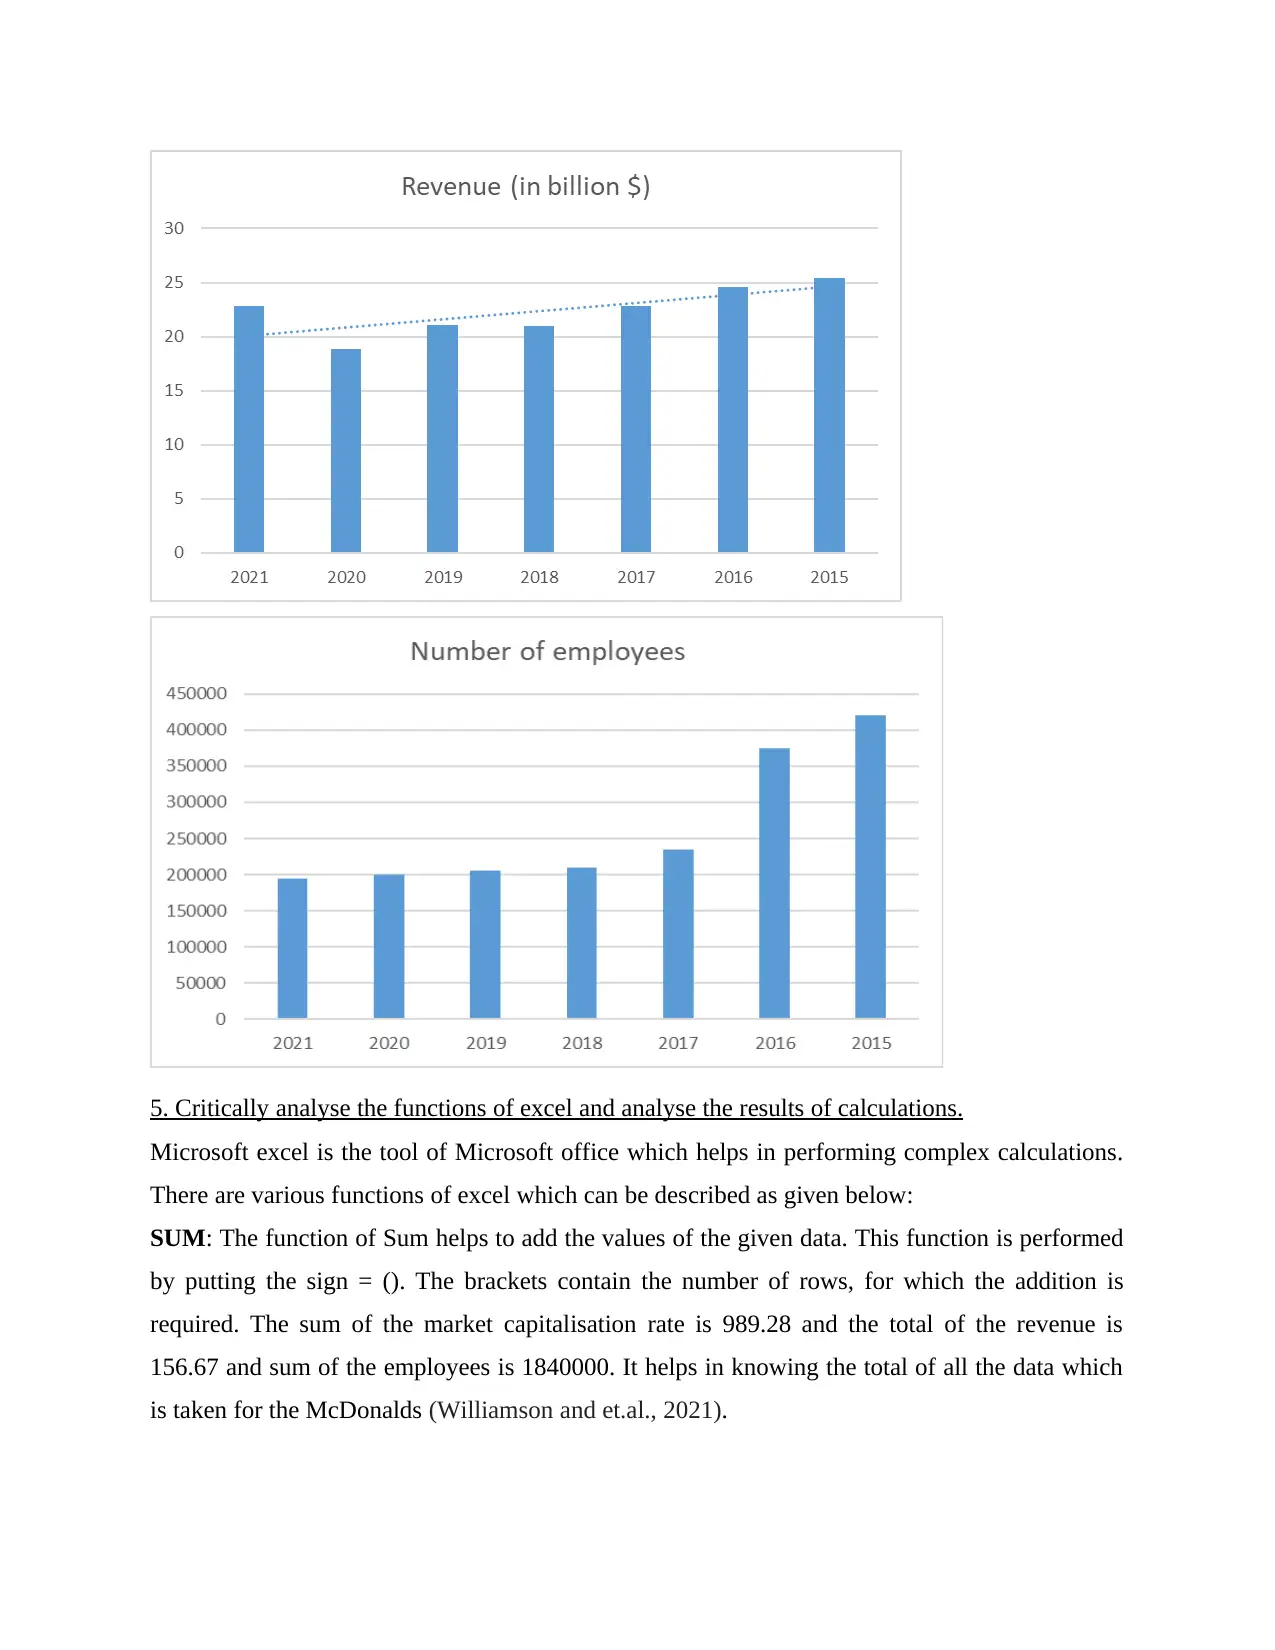
This report provides an analysis of McDonald's business performance using Microsoft Excel. It includes raw data collection regarding revenue, number of employees, and market capitalization from 2015 to 2021. Statistical techniques such as mean, median, sum, count, and maximum are calculated using Excel functions. The data is then represented in charts to visually illustrate trends. A critical analysis of Excel functions is performed, evaluating their utility in deriving meaningful insights from the data. The report concludes that Excel is a valuable tool for data analysis, enabling the extraction of key information and facilitating a clear understanding of McDonald's business performance through statistical measures and graphical representations. Desklib provides access to similar solved assignments and resources for students.

1 out of 7
Related Documents


Your All-in-One AI-Powered Toolkit for Academic Success.
+13062052269
info@desklib.com
Available 24*7 on WhatsApp / Email
![[object Object]](/_next/static/media/star-bottom.7253800d.svg)
Copyright © 2020–2026 A2Z Services. All Rights Reserved. Developed and managed by ZUCOL.