Excel-Based Regression and Forecasting Analysis Problems
VerifiedAdded on 2019/09/25
|16
|997
|36
Homework Assignment
AI Summary
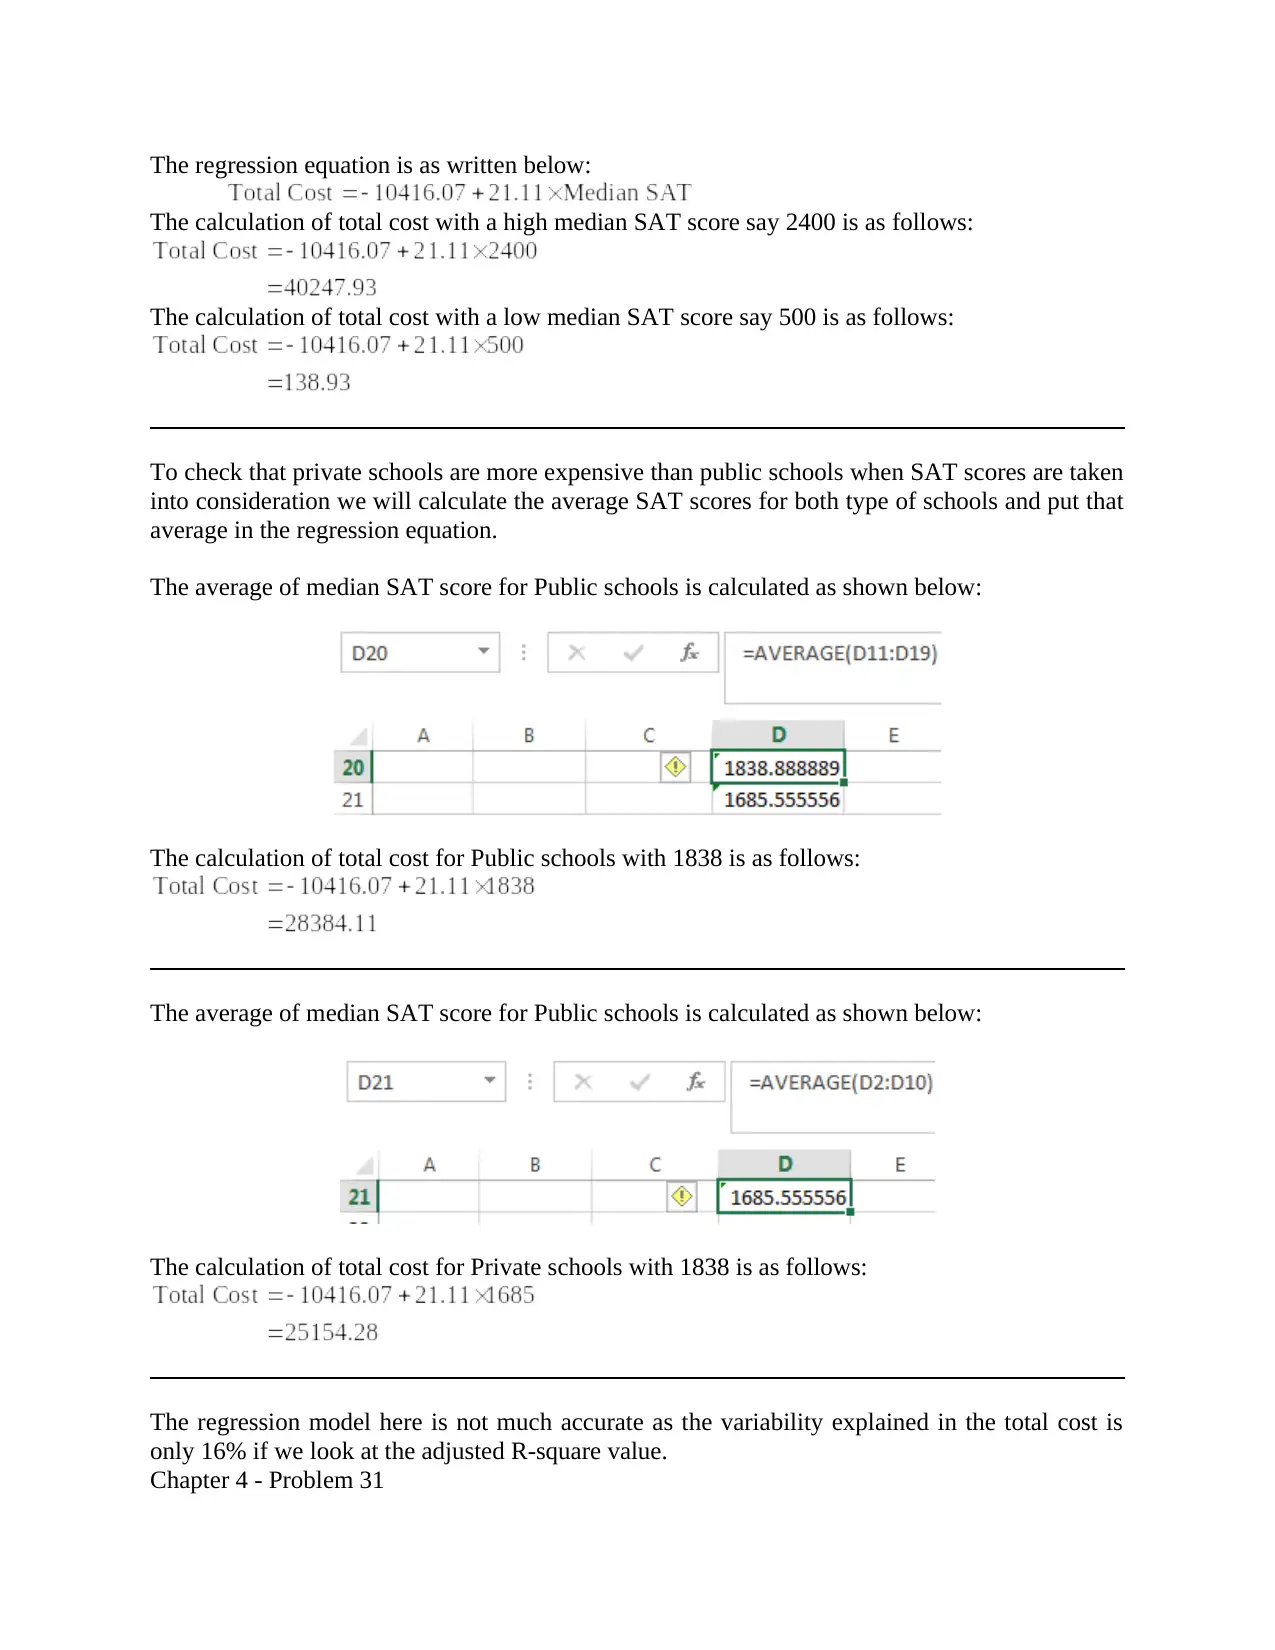
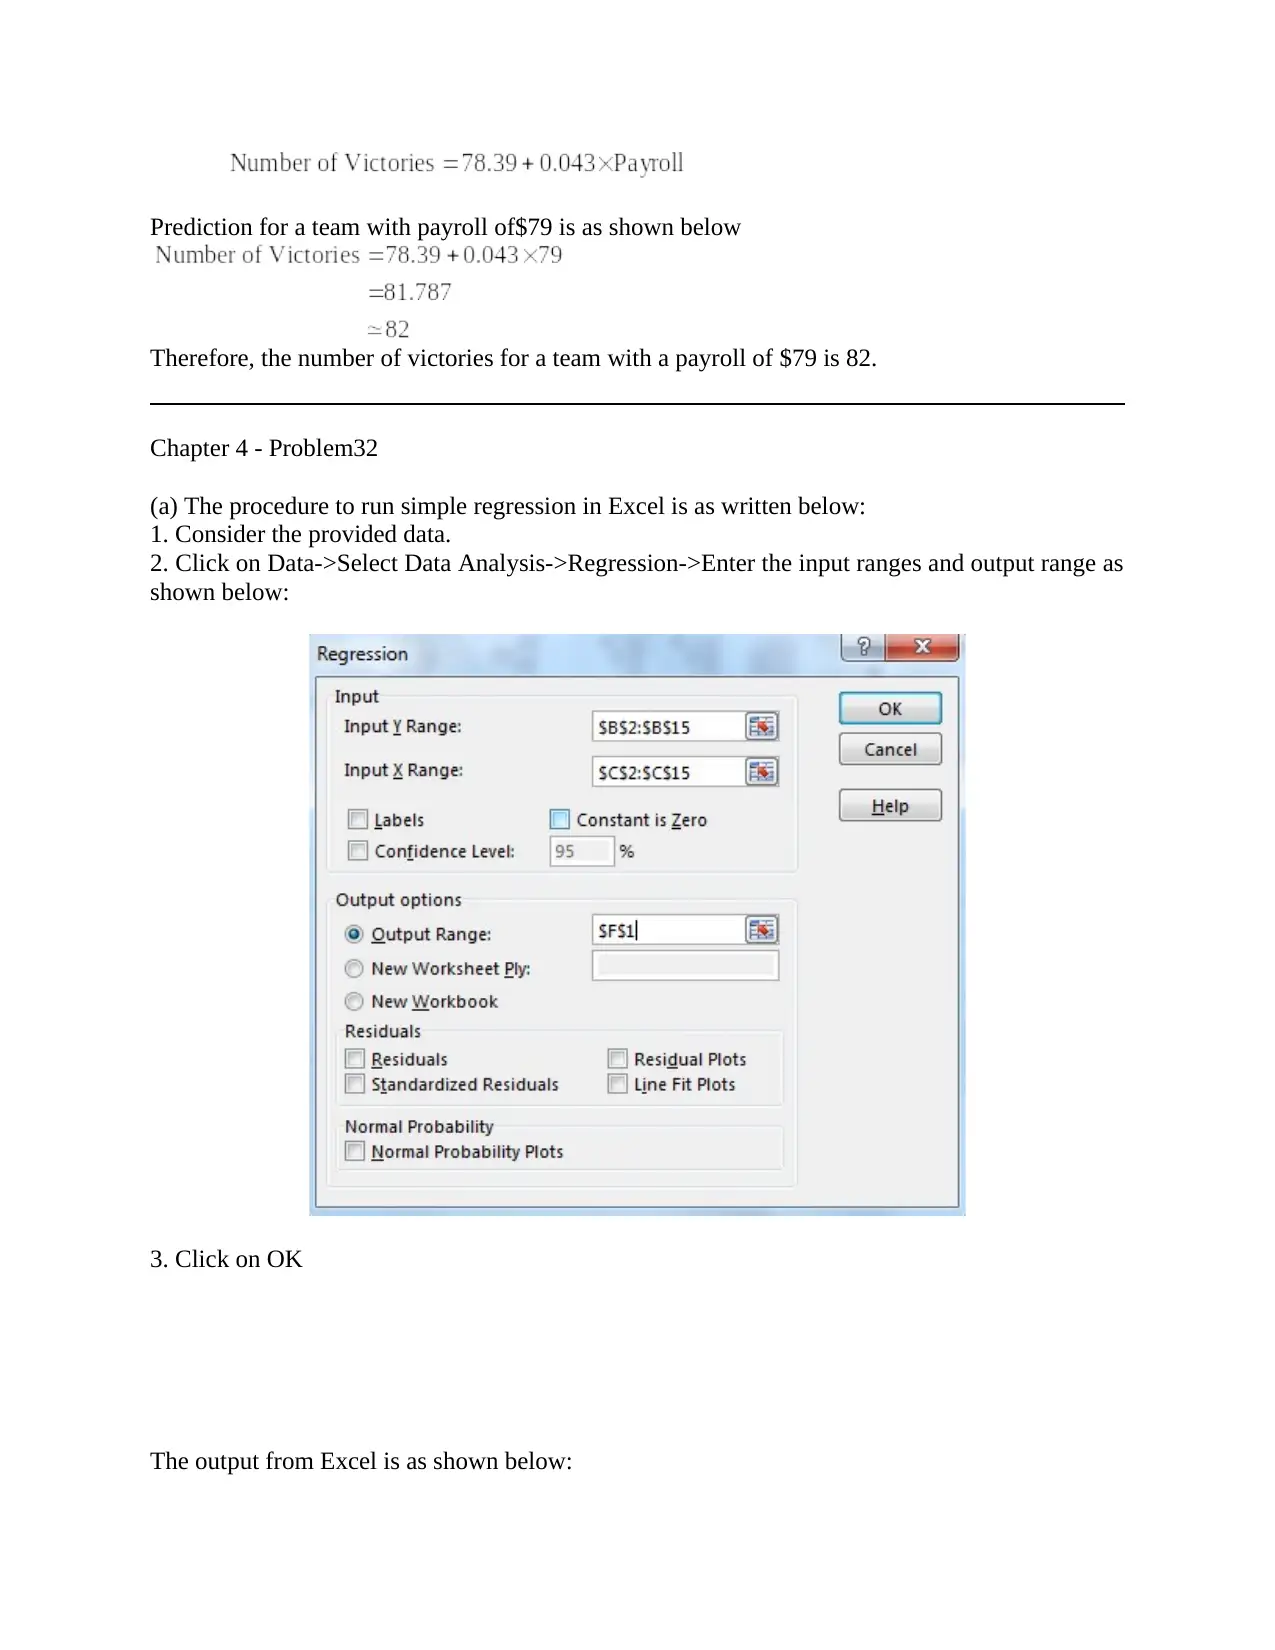
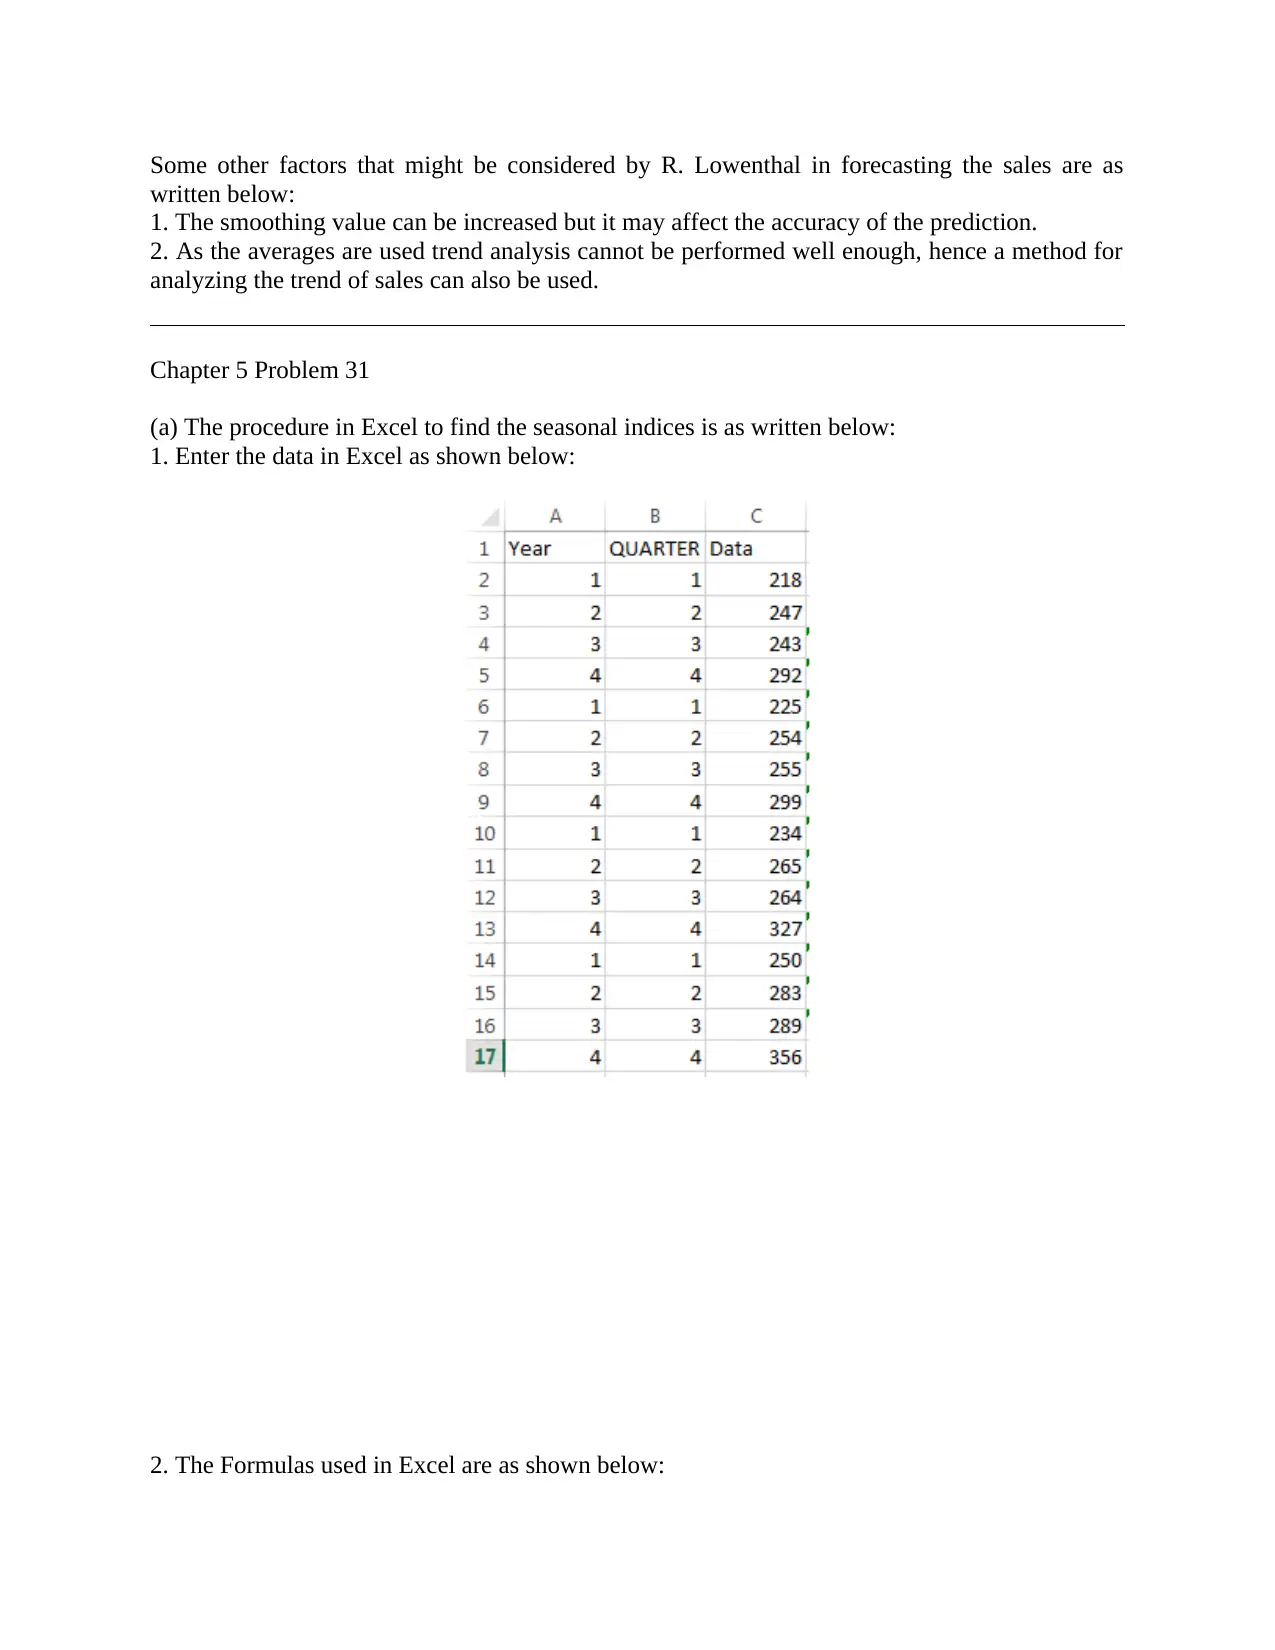
This document provides detailed solutions to various statistical problems using Excel, focusing on regression analysis and forecasting techniques. It covers problems from Chapters 4 and 5, including simple regression analysis, calculating total costs based on SAT scores, and predicting victories based on payroll. The document also explores moving averages, weighted moving averages, and seasonal indices for forecasting demand. Step-by-step instructions and Excel outputs are provided for each problem, demonstrating how to apply these statistical methods. The analysis includes calculating forecast values, evaluating accuracy using MAD, and deseasonalizing data. Additionally, the document offers insights into improving forecast accuracy and considering additional factors that might influence sales. The solutions are comprehensive, providing a practical guide to applying statistical concepts in real-world scenarios.

Chapter 4 - Problem 30.
The procedure to run simple regression in Excel is as written below:
1. Consider the provided data.
2. Click on Data->Select Data Analysis->Regression->Enter the input ranges and output range as
shown below:
3. Click on OK.
The output from Excel is as shown below:
The procedure to run simple regression in Excel is as written below:
1. Consider the provided data.
2. Click on Data->Select Data Analysis->Regression->Enter the input ranges and output range as
shown below:
3. Click on OK.
The output from Excel is as shown below:
Paraphrase This Document
Need a fresh take? Get an instant paraphrase of this document with our AI Paraphraser

The regression equation is as written below:
The calculation of total cost with a high median SAT score say 2400 is as follows:
The calculation of total cost with a low median SAT score say 500 is as follows:
To check that private schools are more expensive than public schools when SAT scores are taken
into consideration we will calculate the average SAT scores for both type of schools and put that
average in the regression equation.
The average of median SAT score for Public schools is calculated as shown below:
The calculation of total cost for Public schools with 1838 is as follows:
The average of median SAT score for Public schools is calculated as shown below:
The calculation of total cost for Private schools with 1838 is as follows:
The regression model here is not much accurate as the variability explained in the total cost is
only 16% if we look at the adjusted R-square value.
Chapter 4 - Problem 31

The procedure to run simple regression in Excel is as written below:
1. Consider the provided data.
2. Click on Data->Select Data Analysis->Regression->Enter the input ranges and output range as
shown below:
3. Click on OK
The output from Excel is as shown below:
The regression equation is as written below:
1. Consider the provided data.
2. Click on Data->Select Data Analysis->Regression->Enter the input ranges and output range as
shown below:
3. Click on OK
The output from Excel is as shown below:
The regression equation is as written below:
⊘ This is a preview!⊘
Do you want full access?
Subscribe today to unlock all pages.

Trusted by 1+ million students worldwide

Prediction for a team with payroll of$79 is as shown below
Therefore, the number of victories for a team with a payroll of $79 is 82.
Chapter 4 - Problem32
(a) The procedure to run simple regression in Excel is as written below:
1. Consider the provided data.
2. Click on Data->Select Data Analysis->Regression->Enter the input ranges and output range as
shown below:
3. Click on OK
The output from Excel is as shown below:
Paraphrase This Document
Need a fresh take? Get an instant paraphrase of this document with our AI Paraphraser

The regression equation is as written below:
(b) The procedure to run simple regression in Excel is as written below:
1. Consider the provided data.
2. Click on Data->Select Data Analysis->Regression->Enter the input ranges and output range as
shown below:
3. Click on OK
The output from Excel is as shown below:
(b) The procedure to run simple regression in Excel is as written below:
1. Consider the provided data.
2. Click on Data->Select Data Analysis->Regression->Enter the input ranges and output range as
shown below:
3. Click on OK
The output from Excel is as shown below:

The regression equation is as written below:
(c)
The first model is better for predicting the number of victories because of higher value of
adjusted R-square.
(c)
The first model is better for predicting the number of victories because of higher value of
adjusted R-square.
⊘ This is a preview!⊘
Do you want full access?
Subscribe today to unlock all pages.

Trusted by 1+ million students worldwide

(d)
The procedure to run simple regression in Excel is as written below:
1. Consider the provided data.
2. Click on Data->Select Data Analysis->Regression->Enter the input ranges and output range as
shown below:
3. Click on OK
The output from Excel is as shown below:
The regression equation is as written below:
Paraphrase This Document
Need a fresh take? Get an instant paraphrase of this document with our AI Paraphraser

In this model, ERA and AVG both are used and they explains the almost 73% variability in the
number of victories whereas the first and second model were explaining only about 34%.
Chapter 5 – Problem 25
(a) The procedure in Excel to find the moving average with three periods as written below:
1. Consider the data provided
2. Click on Data->Select Data Analysis->Moving Average->Enter the input ranges and output
range as shown below:
The output from Excel is as shown below:
Therefore, the demand for vacuum cleaners for next February is 13.66.
(b) The formula used in Excel to find the weighted moving average with three periods are as
shown below:

The output from Excel is as shown below:
Therefore, the demand for vacuum cleaners for next February is 14.7.
(c) The formula used in Excel to evaluate the accuracy of moving average method is as shown
below:
Therefore, the demand for vacuum cleaners for next February is 14.7.
(c) The formula used in Excel to evaluate the accuracy of moving average method is as shown
below:
⊘ This is a preview!⊘
Do you want full access?
Subscribe today to unlock all pages.

Trusted by 1+ million students worldwide

The output from Excel is as shown below:
The formula used in Excel to evaluate the accuracy of weighted moving average method is as
shown below:
The formula used in Excel to evaluate the accuracy of weighted moving average method is as
shown below:
Paraphrase This Document
Need a fresh take? Get an instant paraphrase of this document with our AI Paraphraser

The output from Excel is as shown below:
Since, the MAD is less for the first method hence, the first method is more accurate method.
(d)
Since, the MAD is less for the first method hence, the first method is more accurate method.
(d)

Some other factors that might be considered by R. Lowenthal in forecasting the sales are as
written below:
1. The smoothing value can be increased but it may affect the accuracy of the prediction.
2. As the averages are used trend analysis cannot be performed well enough, hence a method for
analyzing the trend of sales can also be used.
Chapter 5 Problem 31
(a) The procedure in Excel to find the seasonal indices is as written below:
1. Enter the data in Excel as shown below:
2. The Formulas used in Excel are as shown below:
⊘ This is a preview!⊘
Do you want full access?
Subscribe today to unlock all pages.

Trusted by 1+ million students worldwide

The values for seasonal indices are as shown below:
(b)
(b)
Paraphrase This Document
Need a fresh take? Get an instant paraphrase of this document with our AI Paraphraser

The formulas used in Excel for deseasonalizing the data and developing trend are as shown
below:
The desasonalized values are as shown below:
(c) The formulas in Excel to find the trend are as shown below:
below:
The desasonalized values are as shown below:
(c) The formulas in Excel to find the trend are as shown below:

The output from Excel is as shown below:
(d) The formulas in Excel for final forecast is as shown below:
⊘ This is a preview!⊘
Do you want full access?
Subscribe today to unlock all pages.

Trusted by 1+ million students worldwide

The output from Excel is as follows:
1 out of 16

Your All-in-One AI-Powered Toolkit for Academic Success.
+13062052269
info@desklib.com
Available 24*7 on WhatsApp / Email
Unlock your academic potential
© 2024 | Zucol Services PVT LTD | All rights reserved.