Business Intelligence Report: Data Handling with Excel and Weka
VerifiedAdded on 2020/01/07
|20
|4181
|293
Report
AI Summary
This report provides a comparative analysis of Excel and Weka for data handling and business intelligence. It begins by identifying the reasons for a decline in sales for a business firm, attributing it to ineffective discount strategies and insufficient sales margins. The report then delves into the pros and cons of using Excel for data analysis, highlighting its strengths in data preprocessing, analysis, and visualization through features like conditional formatting, IF functions, lookup formulas, pivot tables, charts, statistical tools, and linear programming. The second part of the report focuses on Weka, explaining its competitive advantages and comparing it to Excel. It includes an application of the J48 algorithm and K-means clustering method on Audi data to derive insights and strategic recommendations for enhancing sales. The report includes figures and formulas to support the analysis and concludes with suggestions for improving business performance through data-driven decision-making.

DATA HANDLING AND BUSINESS INTELLIGENCE
Paraphrase This Document
Need a fresh take? Get an instant paraphrase of this document with our AI Paraphraser
TABLE OF CONTENTS
Part 1............................................................................................................................................................................................................3
Reasons for decline in sales of the business firm....................................................................................................................................3
Pros and cons of using excel for data analysis........................................................................................................................................6
Part 2............................................................................................................................................................................................................9
Why Weka must be used to gain competitive advantage........................................................................................................................9
Advantage and disadvantage of Weka over excel (Pros and cons of using Weka for data analysis)......................................................9
Application of J48 algorithm on data set in Weka................................................................................................................................10
Application of clustering method on Audi data.....................................................................................................................................13
Need to add new columns in data..........................................................................................................................................................19
CONCLUSION..........................................................................................................................................................................................19
REFRENCES................................................................................................................................................................................................................. 20
Figure 1 Output table of decision tree in Weka...........................................................................................................................................8
Figure 2Decision tree in Weka....................................................................................................................................................................9
Figure 3 Cluster of finance and TT............................................................................................................................................................12
Figure 4 Cluster of finance and A4............................................................................................................................................................13
Figure 5 Cluster of finance and RS7..........................................................................................................................................................15
INTRODUCTION
With passage of time usage of analytics is increasing at the workplace. It is inevitable to use business intelligence because by
using same roadblocks in business growth can be identified and remove in specific time period. Business firms are often using
analytics to analyze the business situations and making prediction about likelihood about happening of certain event. In the current
research report comparison of excel and Weka is made. Merits and demerits of excel and Weka are explained in detail. In the first part
of the report sales data is analyzed and reason due to which firm sales declined is identified. Apart from this, in the second part of the
report data that is related to Audi are analyzed by using decision tree J48 algorithm and K-means clustering method. Results of these
statistical tools are also explained in detail and strategy that Audi must form in order to enhance sales of its cars are also identified.
Part 1
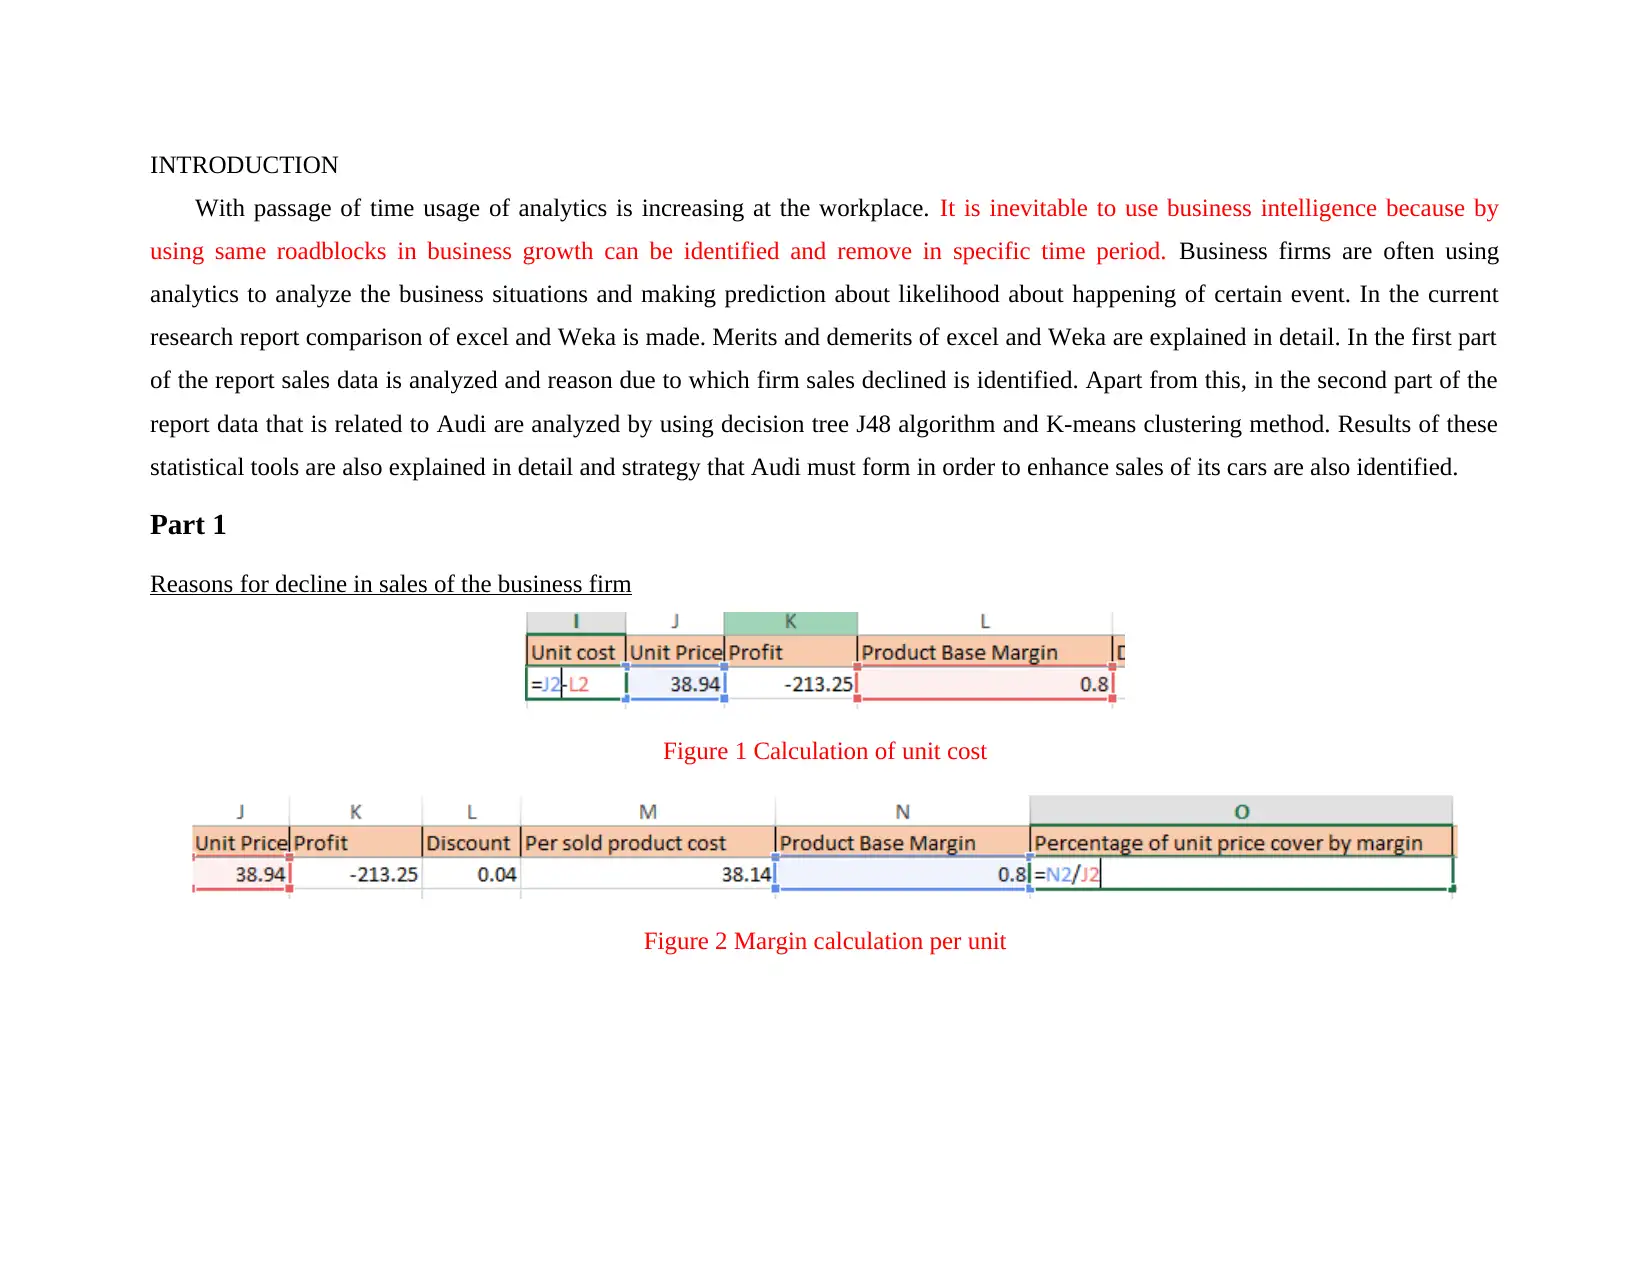
Reasons for decline in sales of the business firm
Figure 1 Calculation of unit cost
Figure 2 Margin calculation per unit
With passage of time usage of analytics is increasing at the workplace. It is inevitable to use business intelligence because by
using same roadblocks in business growth can be identified and remove in specific time period. Business firms are often using
analytics to analyze the business situations and making prediction about likelihood about happening of certain event. In the current
research report comparison of excel and Weka is made. Merits and demerits of excel and Weka are explained in detail. In the first part
of the report sales data is analyzed and reason due to which firm sales declined is identified. Apart from this, in the second part of the
report data that is related to Audi are analyzed by using decision tree J48 algorithm and K-means clustering method. Results of these
statistical tools are also explained in detail and strategy that Audi must form in order to enhance sales of its cars are also identified.
Part 1
Reasons for decline in sales of the business firm
Figure 1 Calculation of unit cost
Figure 2 Margin calculation per unit
⊘ This is a preview!⊘
Do you want full access?
Subscribe today to unlock all pages.
Trusted by 1+ million students worldwide
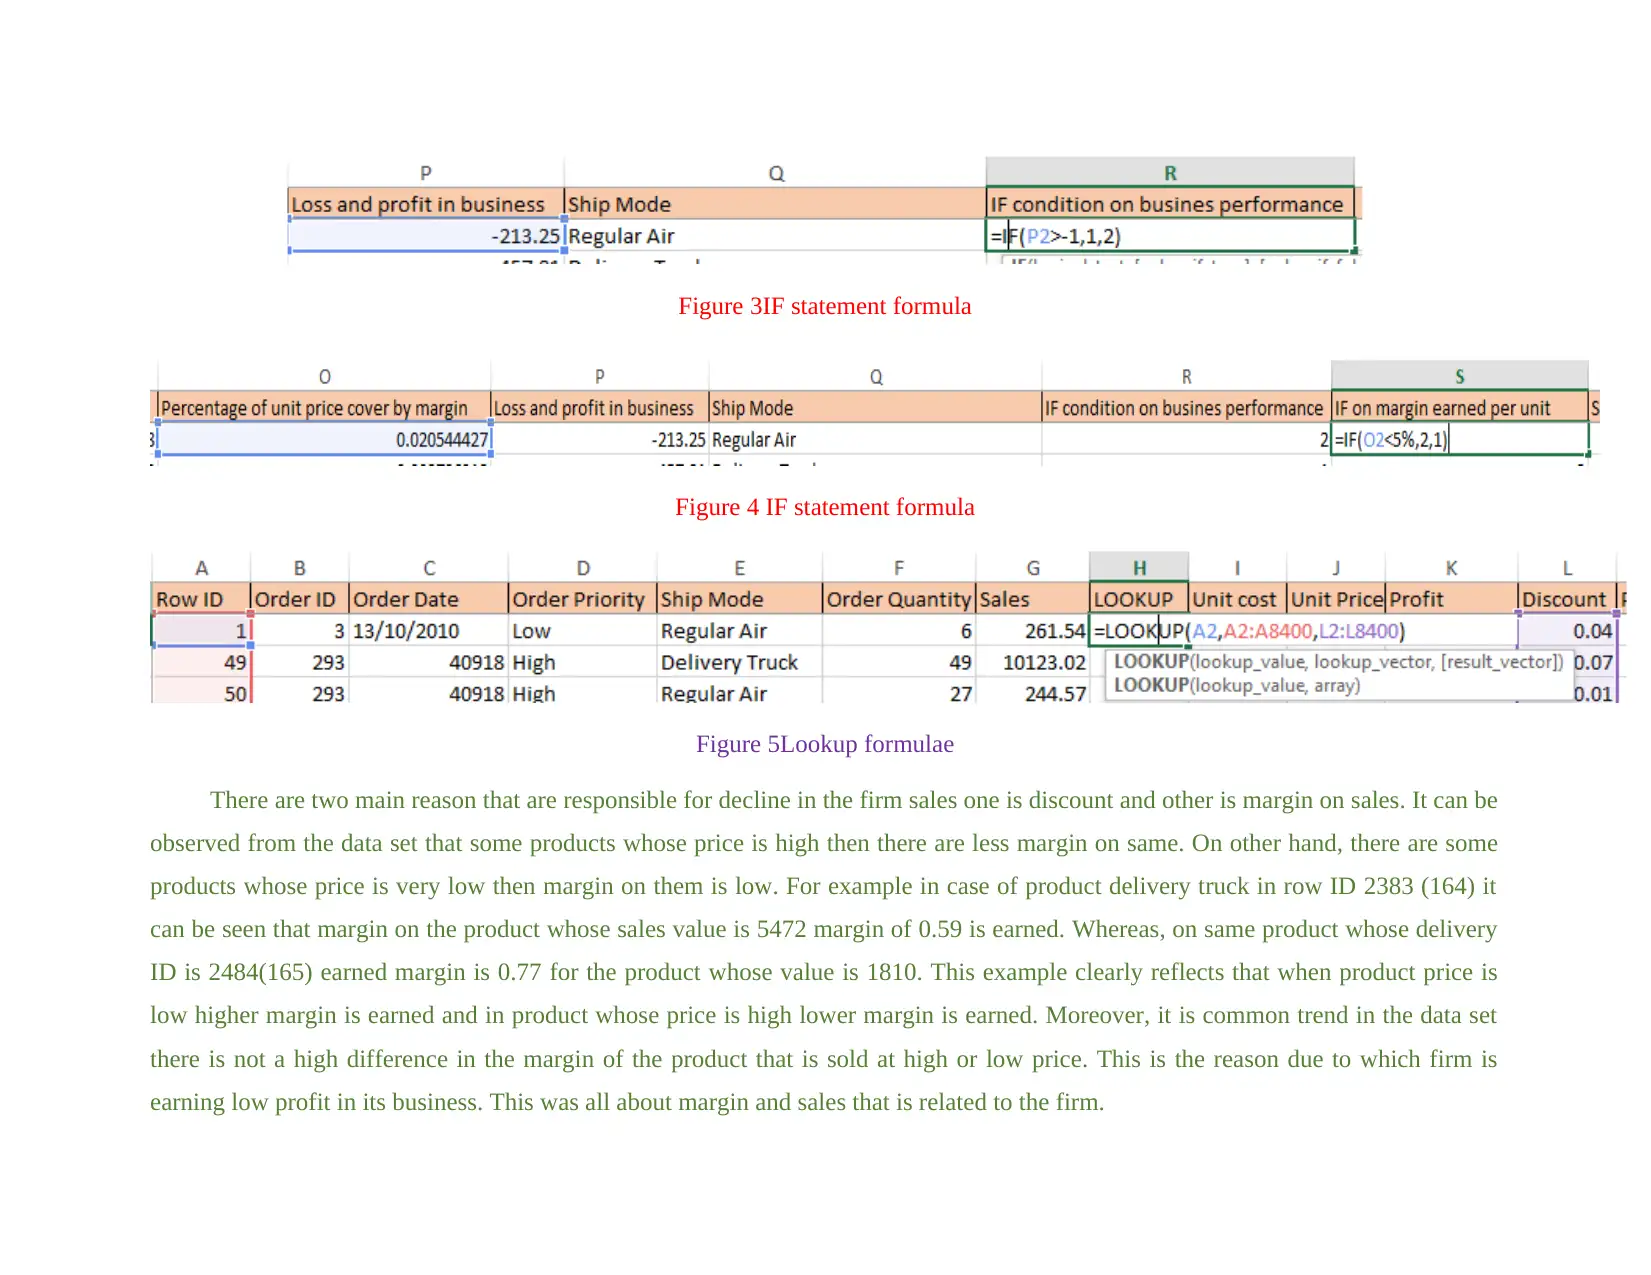
Figure 3IF statement formula
Figure 4 IF statement formula
Figure 5Lookup formulae
There are two main reason that are responsible for decline in the firm sales one is discount and other is margin on sales. It can be
observed from the data set that some products whose price is high then there are less margin on same. On other hand, there are some
products whose price is very low then margin on them is low. For example in case of product delivery truck in row ID 2383 (164) it
can be seen that margin on the product whose sales value is 5472 margin of 0.59 is earned. Whereas, on same product whose delivery
ID is 2484(165) earned margin is 0.77 for the product whose value is 1810. This example clearly reflects that when product price is
low higher margin is earned and in product whose price is high lower margin is earned. Moreover, it is common trend in the data set
there is not a high difference in the margin of the product that is sold at high or low price. This is the reason due to which firm is
earning low profit in its business. This was all about margin and sales that is related to the firm.
Paraphrase This Document
Need a fresh take? Get an instant paraphrase of this document with our AI Paraphraser
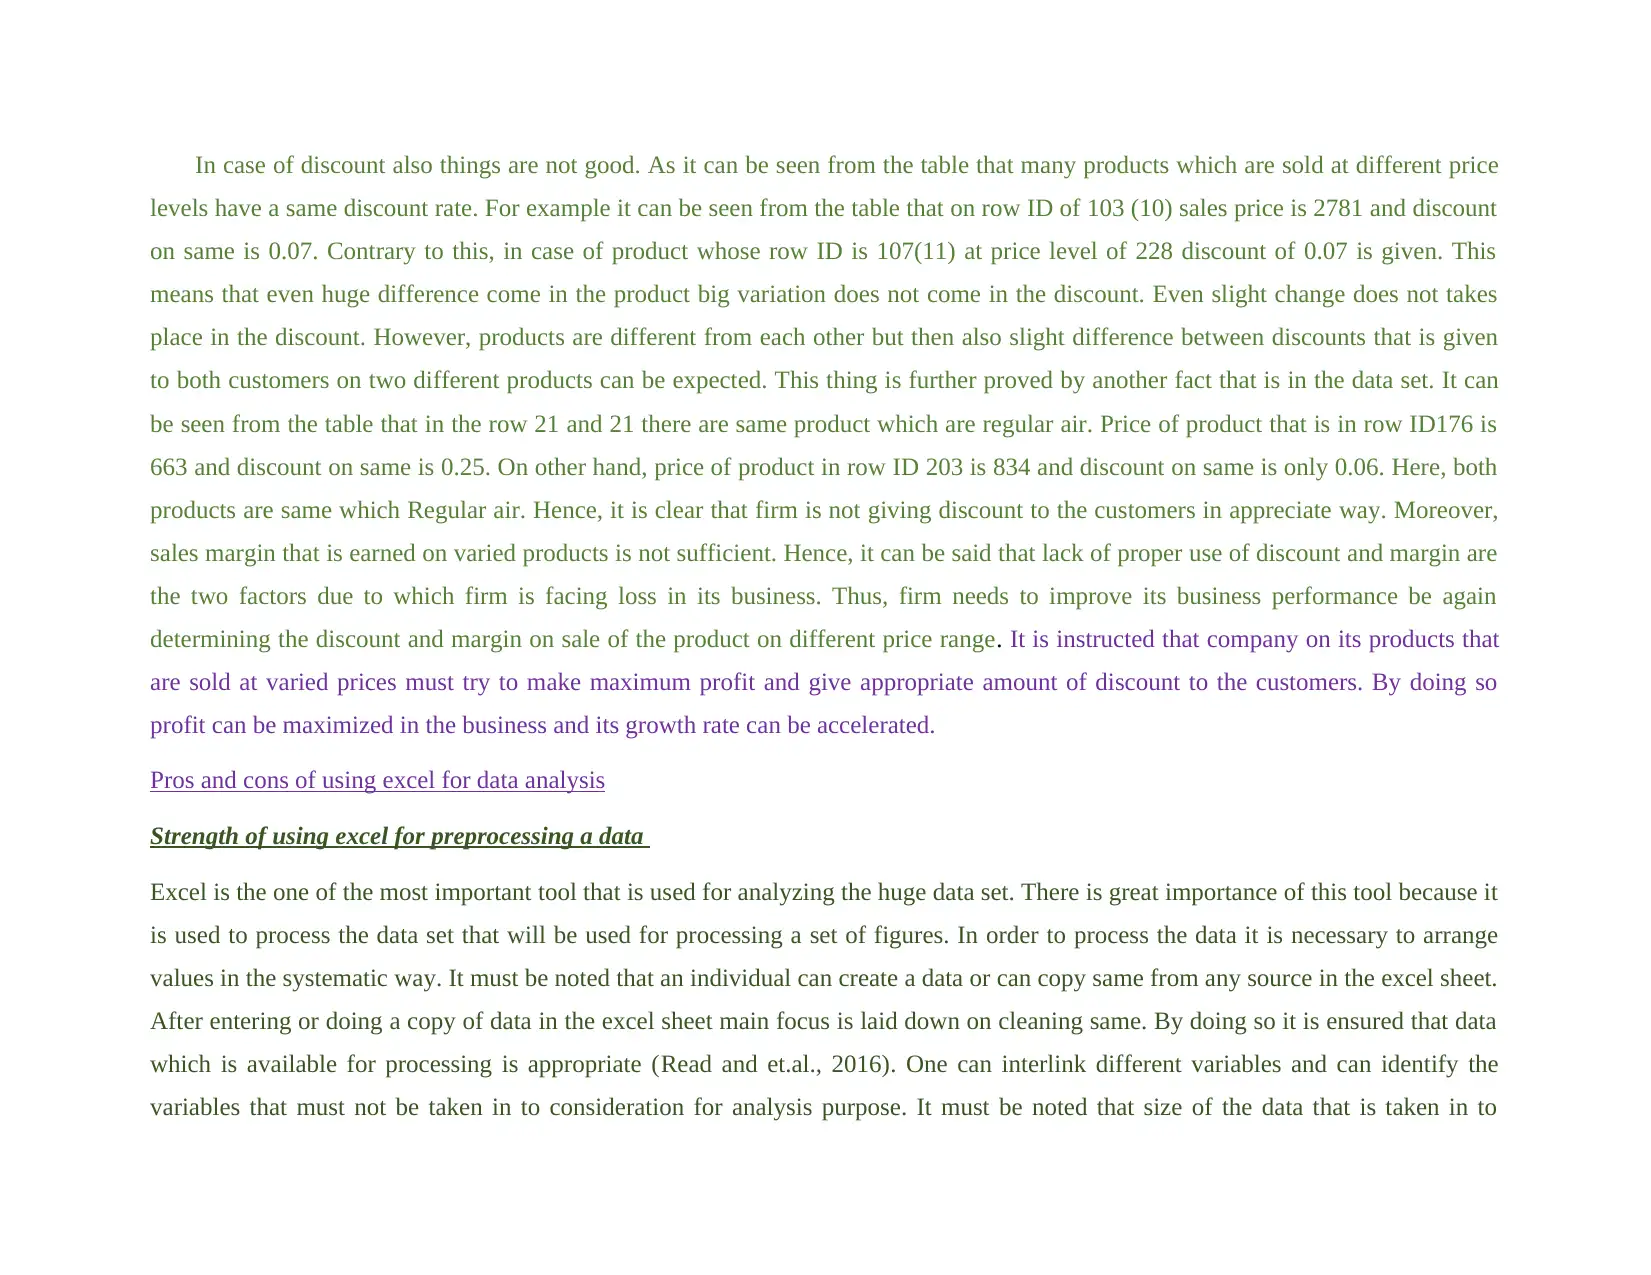
In case of discount also things are not good. As it can be seen from the table that many products which are sold at different price
levels have a same discount rate. For example it can be seen from the table that on row ID of 103 (10) sales price is 2781 and discount
on same is 0.07. Contrary to this, in case of product whose row ID is 107(11) at price level of 228 discount of 0.07 is given. This
means that even huge difference come in the product big variation does not come in the discount. Even slight change does not takes
place in the discount. However, products are different from each other but then also slight difference between discounts that is given
to both customers on two different products can be expected. This thing is further proved by another fact that is in the data set. It can
be seen from the table that in the row 21 and 21 there are same product which are regular air. Price of product that is in row ID176 is
663 and discount on same is 0.25. On other hand, price of product in row ID 203 is 834 and discount on same is only 0.06. Here, both
products are same which Regular air. Hence, it is clear that firm is not giving discount to the customers in appreciate way. Moreover,
sales margin that is earned on varied products is not sufficient. Hence, it can be said that lack of proper use of discount and margin are
the two factors due to which firm is facing loss in its business. Thus, firm needs to improve its business performance be again
determining the discount and margin on sale of the product on different price range. It is instructed that company on its products that
are sold at varied prices must try to make maximum profit and give appropriate amount of discount to the customers. By doing so
profit can be maximized in the business and its growth rate can be accelerated.
Pros and cons of using excel for data analysis
Strength of using excel for preprocessing a data
Excel is the one of the most important tool that is used for analyzing the huge data set. There is great importance of this tool because it
is used to process the data set that will be used for processing a set of figures. In order to process the data it is necessary to arrange
values in the systematic way. It must be noted that an individual can create a data or can copy same from any source in the excel sheet.
After entering or doing a copy of data in the excel sheet main focus is laid down on cleaning same. By doing so it is ensured that data
which is available for processing is appropriate (Read and et.al., 2016). One can interlink different variables and can identify the
variables that must not be taken in to consideration for analysis purpose. It must be noted that size of the data that is taken in to
account is very huge in nature. By taking a single view one cannot analyze the data in systematic way. Hence, before processing the
data it is very important to arrange same in proper manner. In this regard option of conditional formatting is available in the excel
software. Under this function specific type of values that one intends to use in order to analyze the data can be identified from huge set
of values. Thus, by using this tool before processing of data set of figures can be arranged in the systematic way in the excel sheet.
Thus, it can be said that there is a strength of excel in respect to arranging set of figures before preprocessing a data.
Apart from conditional formatting there are many advanced features of Excel that can be used to arrange the data in systematic
way before processing same. Under this first of all data that one wants to use for analysis purpose is taken in to consideration.
Thereafter, one determine whether he want specific value, values in range, values greater than standard or values less than standard.
According to requirement one can select option in the conditional formatting tab and can obtain the values that it intends to use from
the data set for analysis purpose (Weka, Ikeh and Kamani, 2013). Thus, conditional formatting help one in extracting the relevant data
from huge set of figures. It can be said that conditional formatting help one in arranging or get prepared data that will be used for
processing in latter stage. Thus, there is a great importance of the conditional formatting function of excel. It must be noted that in the
current project for the data set conditional formatting in excel sheet is used. By using this areas where trend is different in terms of
discount and sales price are identified. By using this tool broad understanding of entire scenario is developed. Lookup formula is also
applied in the excel sheet in order to identify the value of the discount for the product that is in the specific row ID. In this way
preprocessing of data is simplified.
Strength of excel in analysis of data
Excel is the powerful analytic tool because by using same number of operations can be performed in easy and effective way. In
order to understand the strength of excel it is necessary to understand the advanced functions that are available in excel. Some of the
advanced functions are explained below.
If function: This is the powerful tool of excel that is used to analyze the variables that are in the data set. Under this function
specific situation is defined by using number and formula in the IF statement of the excel software. Thereafter, results that
⊘ This is a preview!⊘
Do you want full access?
Subscribe today to unlock all pages.
Trusted by 1+ million students worldwide
must be obtained on satisfaction or non-fulfillment of the condition is clearly defined in the report. In this way variables that
must be taken in to consideration can be identified easily. In the current report, also IF function is used to identify where
discount rate is high or low (Jothikumar, Sivabalan and Kumarasen, 2015). Moreover, those products on which margin is
higher or below margin are also identified by using IF statement. Without this statement it was not possible to analyze the data
in better way. Hence, it can be said that there is a very high strength of excel for data analysis.
Lookup: By using lookup function in excel specific value in the huge data set can be easily identified by an individual. In the
current report, in order to analyze data lookup function is used to identify sales value, discount and margin on specific product
of specific order number. Pivot table: Pivot table is used to preprocess the data. By using pivot table variables that one needs to analyze only can be
viewed in the data set. Thus, it can be said that there is a great importance of the picot table in data analysis and its
preprocessing. Charts and graphs: Charts and graphs are used to analyze the variable. The bar, line or pie in the chart reflects the value of the
variables. Multiple variables are compared with each other by using charts and graphs. Thus, it can be said that there is great
importance of charts and graphs in data analysis.
Statistics: In excel all sort of statistical tools can be applied on the relevant data. If one wants to apply regression on the data
set he can use mentioned statistical tool in order to identify the relationship among the variable. Apart from regression other
statistical tool that can be used for data analysis using excel are t-test and chi square test etc. Hence, it can be said that entire
operations that are related to the statistics can be performed in excel.
Linear programing: Linear programing is the one of the most important tool of excel. By using this tool one can easily
identify the way in which resources must be allocated among different products so that better return can be obtained on the
product (Chaudhari and Parikh, 2012). Hence, it can be said that excel help business firms in optimizing their business
operations in better way. Thus, it is clear that excel have a great strength in terms of analysis of data.
Paraphrase This Document
Need a fresh take? Get an instant paraphrase of this document with our AI Paraphraser
Financial market: Those who work in the financial market greatly use excel to analyze the relevant data. In the mentioned
software complicated calculations can be done in easy way. Hence, it can be said that excel software to great extent is used for
data analysis by the managers.
Strength of excel in visualization of data
Excel have lots of features which make visualization of data effective. In the excel software multiple charts can be formed to
analyze the data in proper way. Different charts like pie, bar, column and stacked chart can be prepared in excel for visualization of
data. In the bar and graph chart different type of graph can be prepared which make visualization of data much better ( Beckham, Hall
and Frank, 2016). Thus, it can be said that there are lots of advanced features in the excel sheets in respect to visualization of data.
Disadvantage of using excel for data analysis
The main limitation of excel is that by using same huge data set cannot be analyzed. Only up to certain extent easily set of
values can be analyzed easily in excel. The other limitation of excel is that only descriptive statistics and advanced tools like
regression and Z test can be applied on the data set in the excel. Thus, it is not possible to do predictive analytics in excel.
Part 2
Why Weka must be used to gain competitive advantage
Weka must be used by the business firm in order to gain competitive advantage. This is because in the mentioned software many
advanced functions can be performed like decision tree and cluster analysis. There are many non-traditional statistical software’s that
are used by the business firms to identify and solving the business problem. Some of these nontraditional software’s are R, SAS and
Python etc (Sabancı and Akkaya, 2016). All these software’s are the powerful tool for data analysis. In these software’s one needs to
use programing language in order to perform calculations. In case of Weka one does not needs to use programing language. Hence,
managers of the Audi can easily use Weka and in the short time period can analyze tools. Like huge data set is analyzed in R, SAS and
Python big set of figures can be easily evaluated in the Weka in very short time period. Hence, lots of time can be saved in Weka.
Thus, it can be said that business firm must use Weka for gaining competitive advantage.
Advantage and disadvantage of Weka over excel (Pros and cons of using Weka for data analysis)
There are certain plus points of the Weka over excel. Same are disused below.
Size of data: In terms of size of data excel and Weka are different from each other. It can be observed that it is not possible to
analyze the huge data set in excel. In real business world the data that is take in to account for analysis purpose have size of
minimum 3000 rows and number of columns (Baati and et.al., 2016). Excel is not capable to handle such kind of data for
analysis purpose. Contrary to this, in case of Weka scene is different because in the mentioned software data set of any size can
be easily analyzed by using varied statistical tools. Hence, it can be said that this is the major plus point of the Weka over
excel.
Statistical functions: In respect to statistical functions Weka and excel can be compared with each other. It can be observed
that excel every sort of statistical tool can be used. This is because in excel limited options are available. In the mentioned
software only regression, T test, F test, descriptive statistics and decision tree can be applied on the data set. Apart from this
there are many other statistical tools that are used by the data scientists. Hence, it can be said that excel have a very limited use
for an individuals those who are doing a job as data scientist in analytic industry. Weka eliminate limitations of excel for an
individual because by using same every type of advanced statistical tool can be applied on the set of figures. Hence, Weka
have a superiority over Excel.
Disadvantages
Disadvantage of Weka in comparison to excel are as follows.
Statistical and non-statistical calculations: It must be noted that in the excel many statistical and non-statistical calculations
can be done by an individual. On other hand, in case of Weka only statistical calculations can be done. Thus, from this point of
view it can be said that scope of work of Excel is greater than Weka when one need to use both statistical and non-statistical
⊘ This is a preview!⊘
Do you want full access?
Subscribe today to unlock all pages.
Trusted by 1+ million students worldwide
tools in order to solve business problem. It is well known fact that in excel statistical tools that are mostly use by the data
scientists can be applied on the data set. Thus, there may be situations in which one can make more use of Excel in comparison
to Weka for data analysis.
Application of J48 algorithm on data set in Weka
Decision tree is the one of the most important tool that is used for analyzing the data (Decision trees explained using Weka,
2016). In the current research study in order to analyze the Audi related data decision tree method is applied in the Weka by using J48
algorithm.
Paraphrase This Document
Need a fresh take? Get an instant paraphrase of this document with our AI Paraphraser
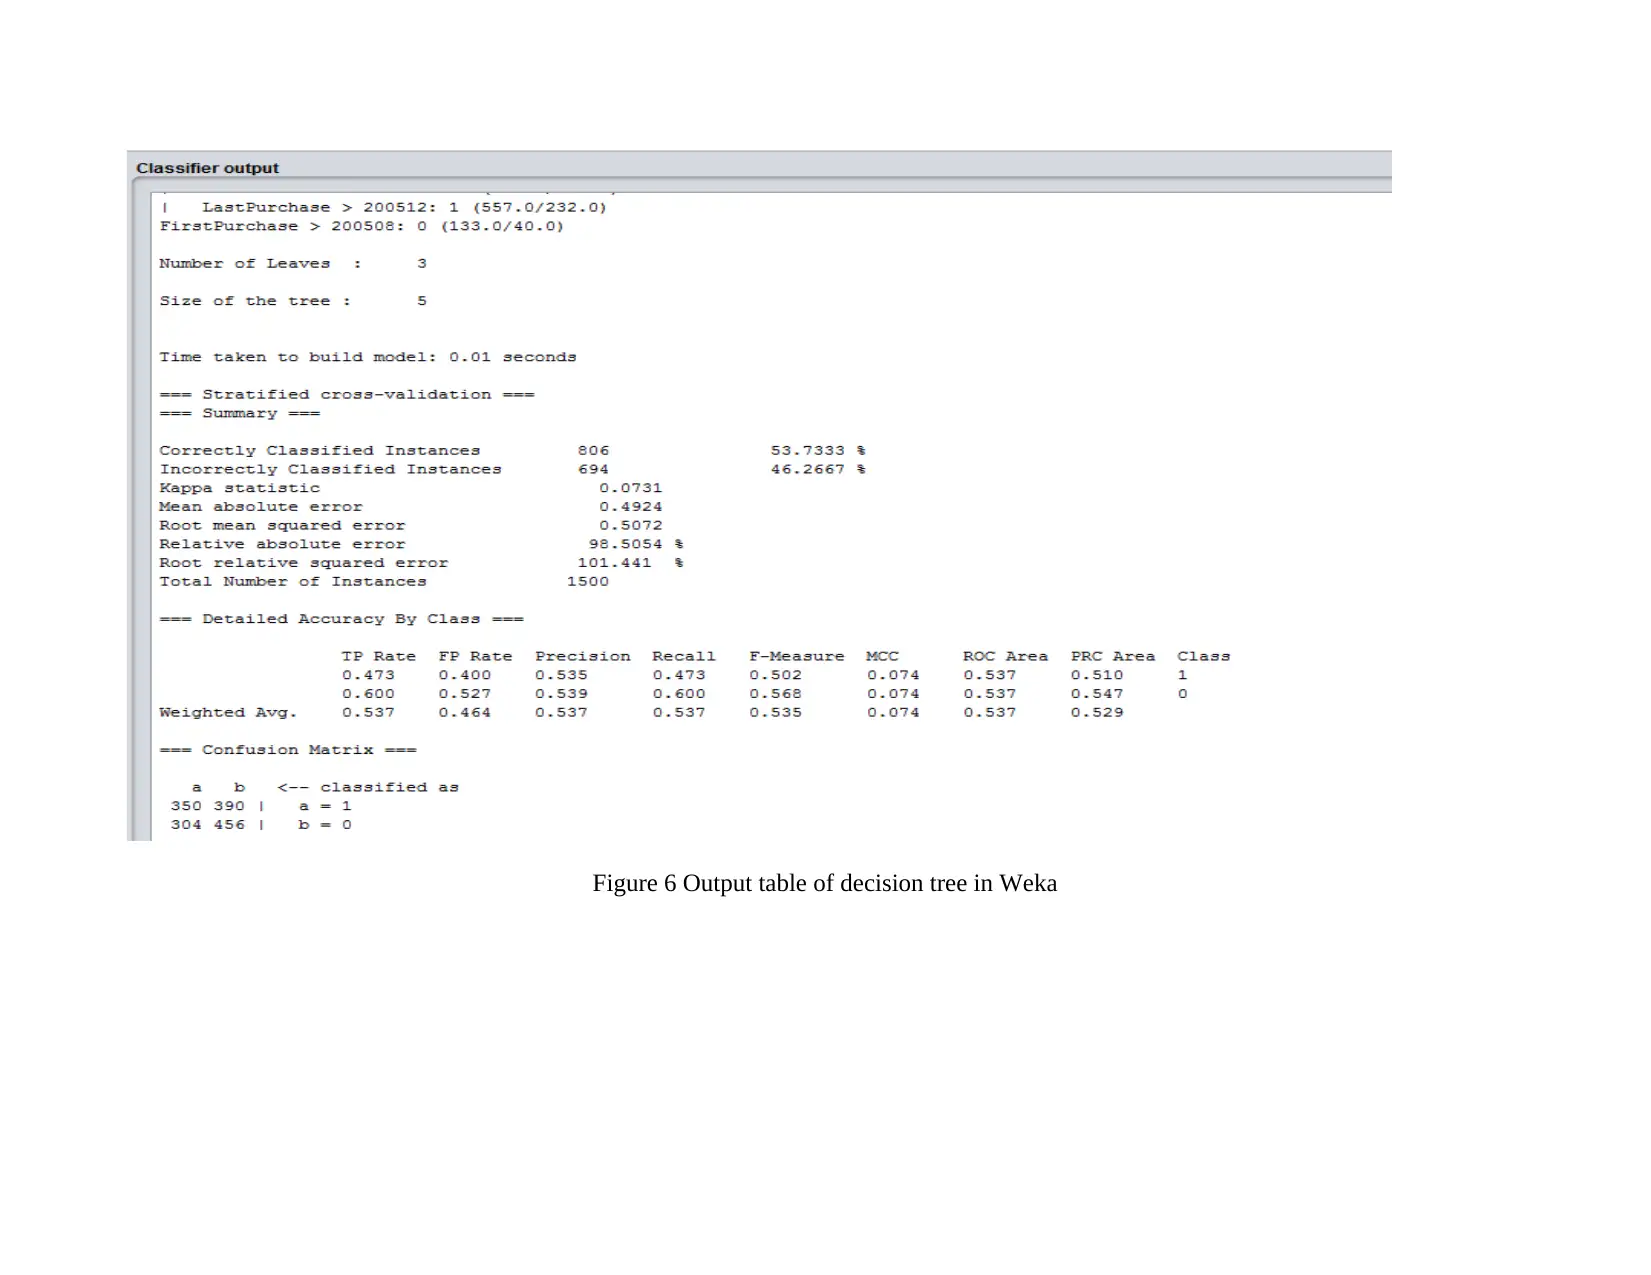
Figure 6 Output table of decision tree in Weka
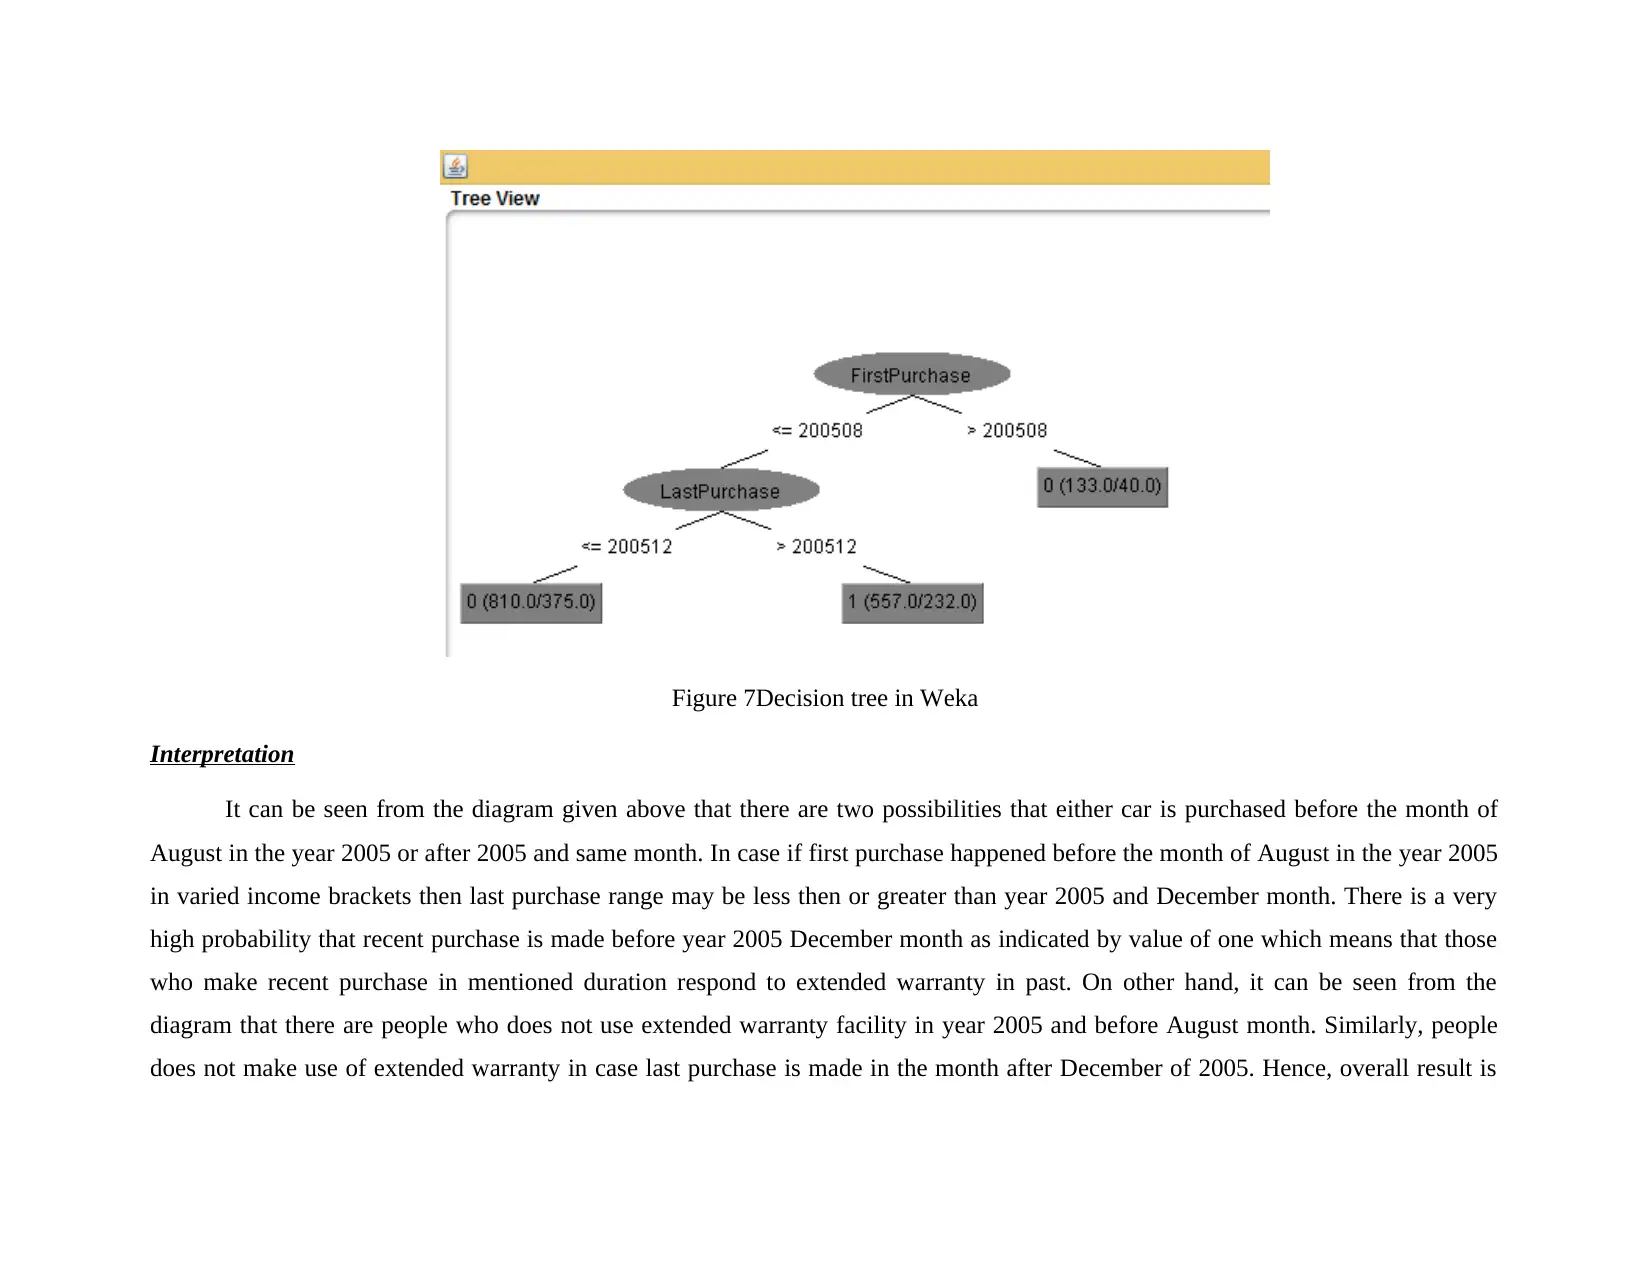
Figure 7Decision tree in Weka
Interpretation
It can be seen from the diagram given above that there are two possibilities that either car is purchased before the month of
August in the year 2005 or after 2005 and same month. In case if first purchase happened before the month of August in the year 2005
in varied income brackets then last purchase range may be less then or greater than year 2005 and December month. There is a very
high probability that recent purchase is made before year 2005 December month as indicated by value of one which means that those
who make recent purchase in mentioned duration respond to extended warranty in past. On other hand, it can be seen from the
diagram that there are people who does not use extended warranty facility in year 2005 and before August month. Similarly, people
does not make use of extended warranty in case last purchase is made in the month after December of 2005. Hence, overall result is
⊘ This is a preview!⊘
Do you want full access?
Subscribe today to unlock all pages.
Trusted by 1+ million students worldwide
1 out of 20
Related Documents


Your All-in-One AI-Powered Toolkit for Academic Success.
+13062052269
info@desklib.com
Available 24*7 on WhatsApp / Email
![[object Object]](/_next/static/media/star-bottom.7253800d.svg)
Unlock your academic potential
Copyright © 2020–2026 A2Z Services. All Rights Reserved. Developed and managed by ZUCOL.