Role of Excellence Awards on Business Excellence: Survey Analysis

Verified

Added on  2023/06/08

|45
|7197
|451
Report
AI Summary
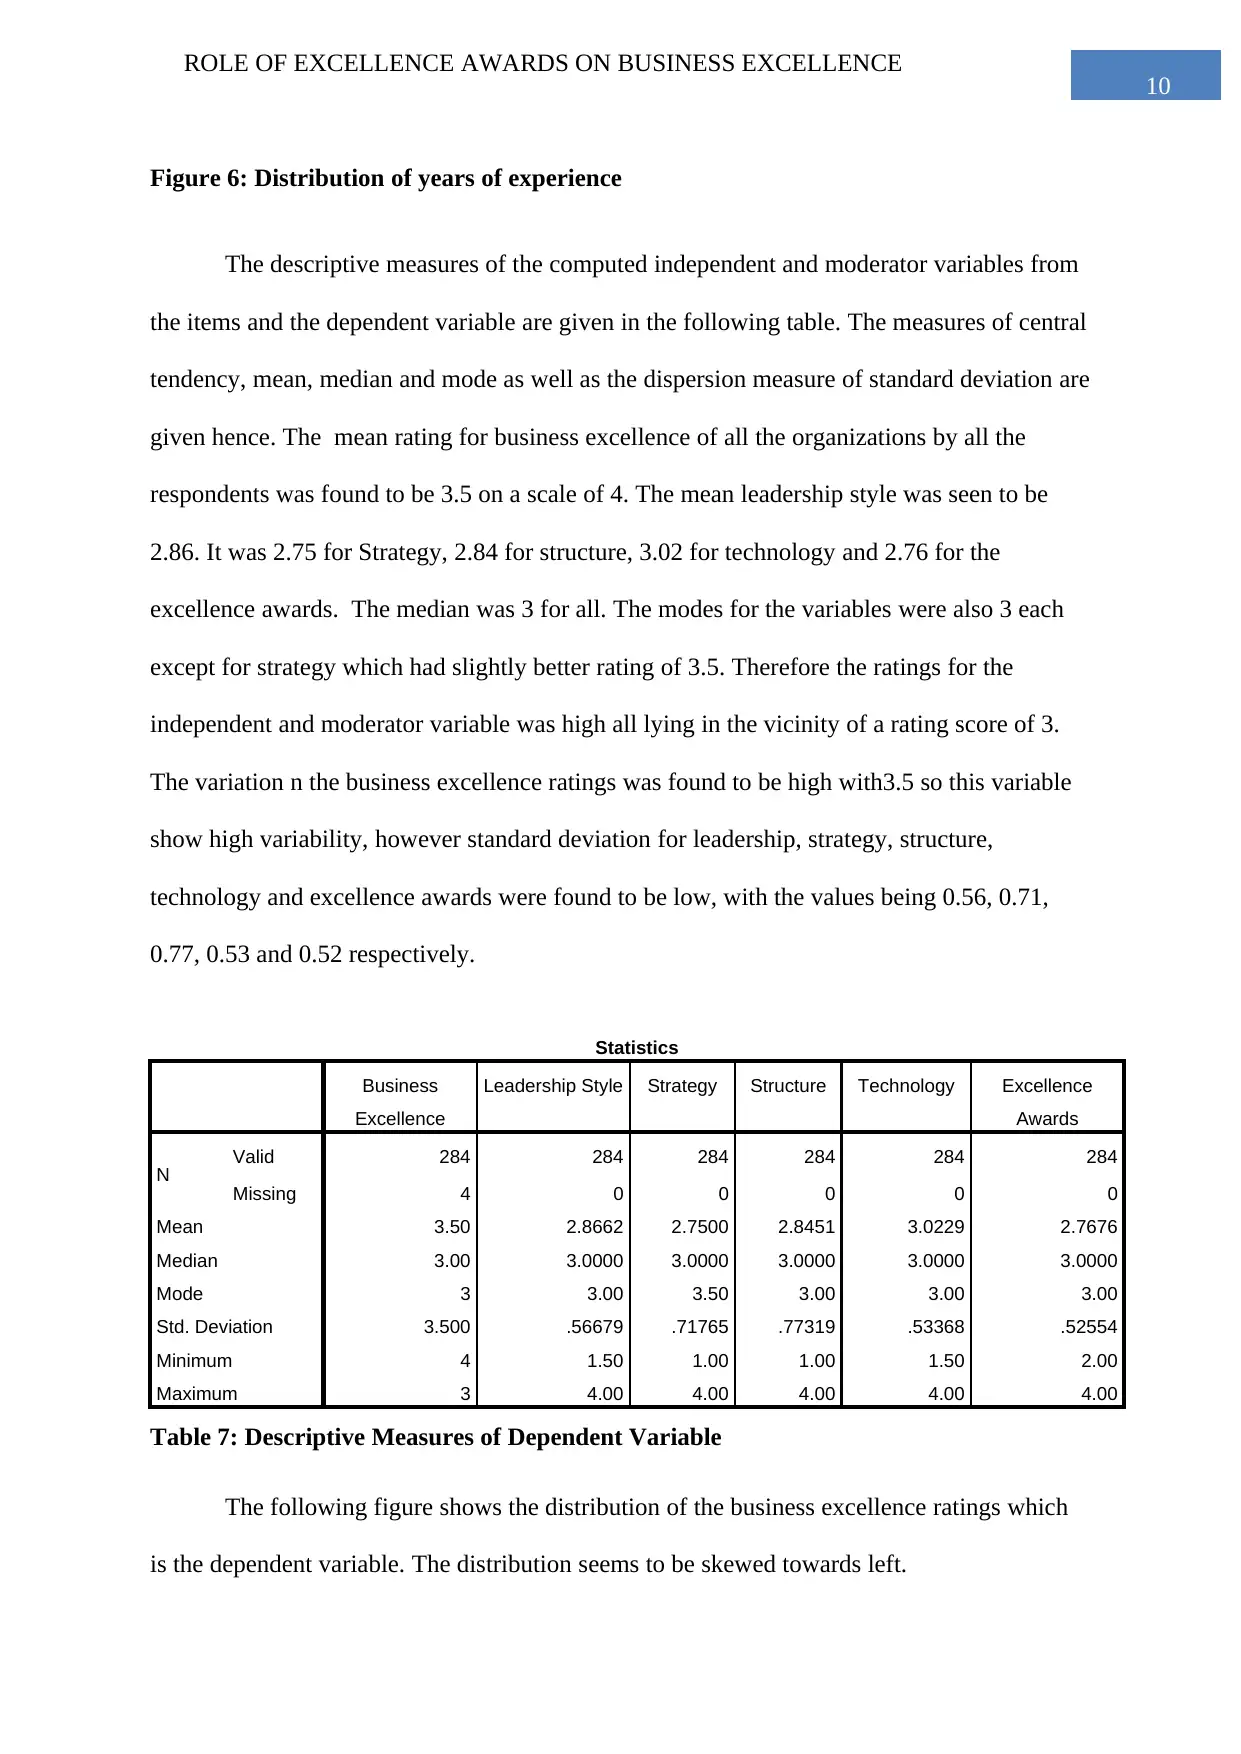
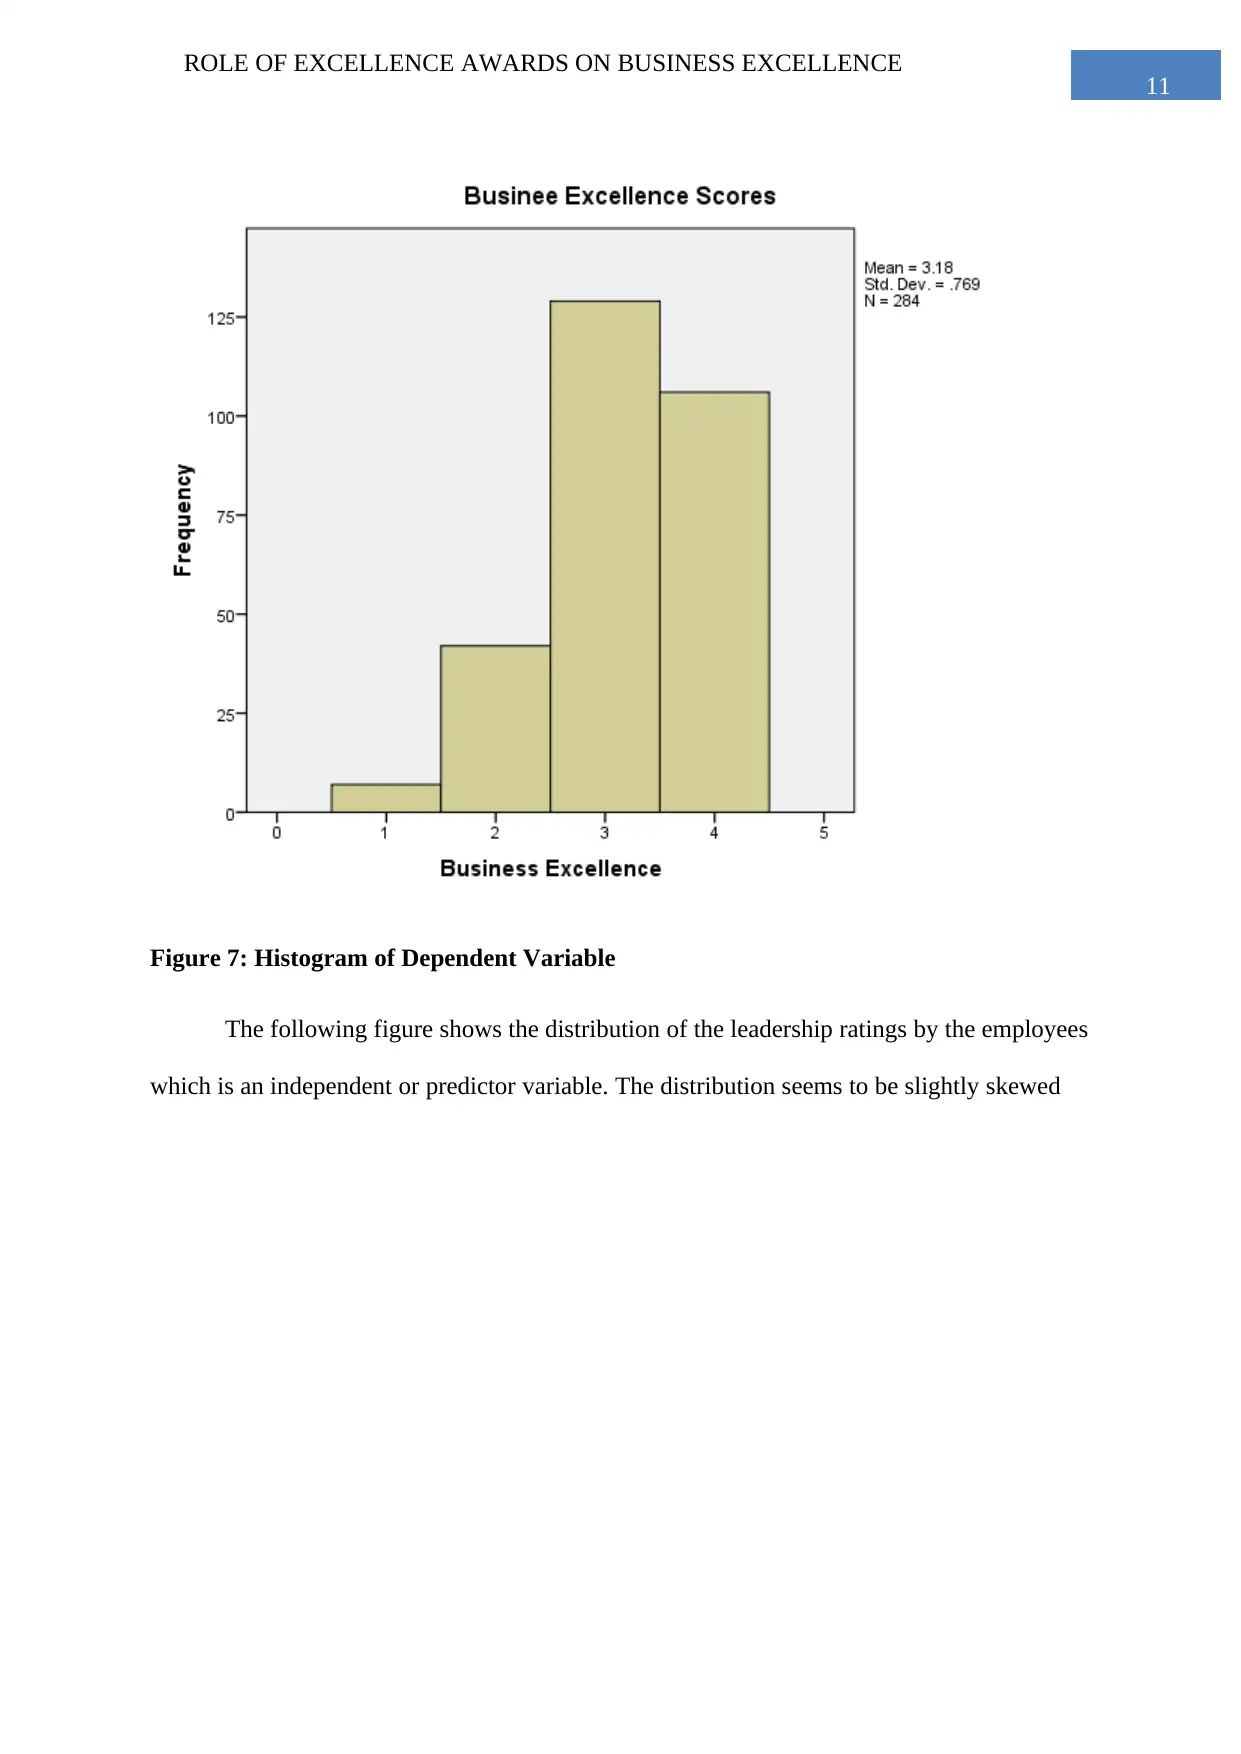
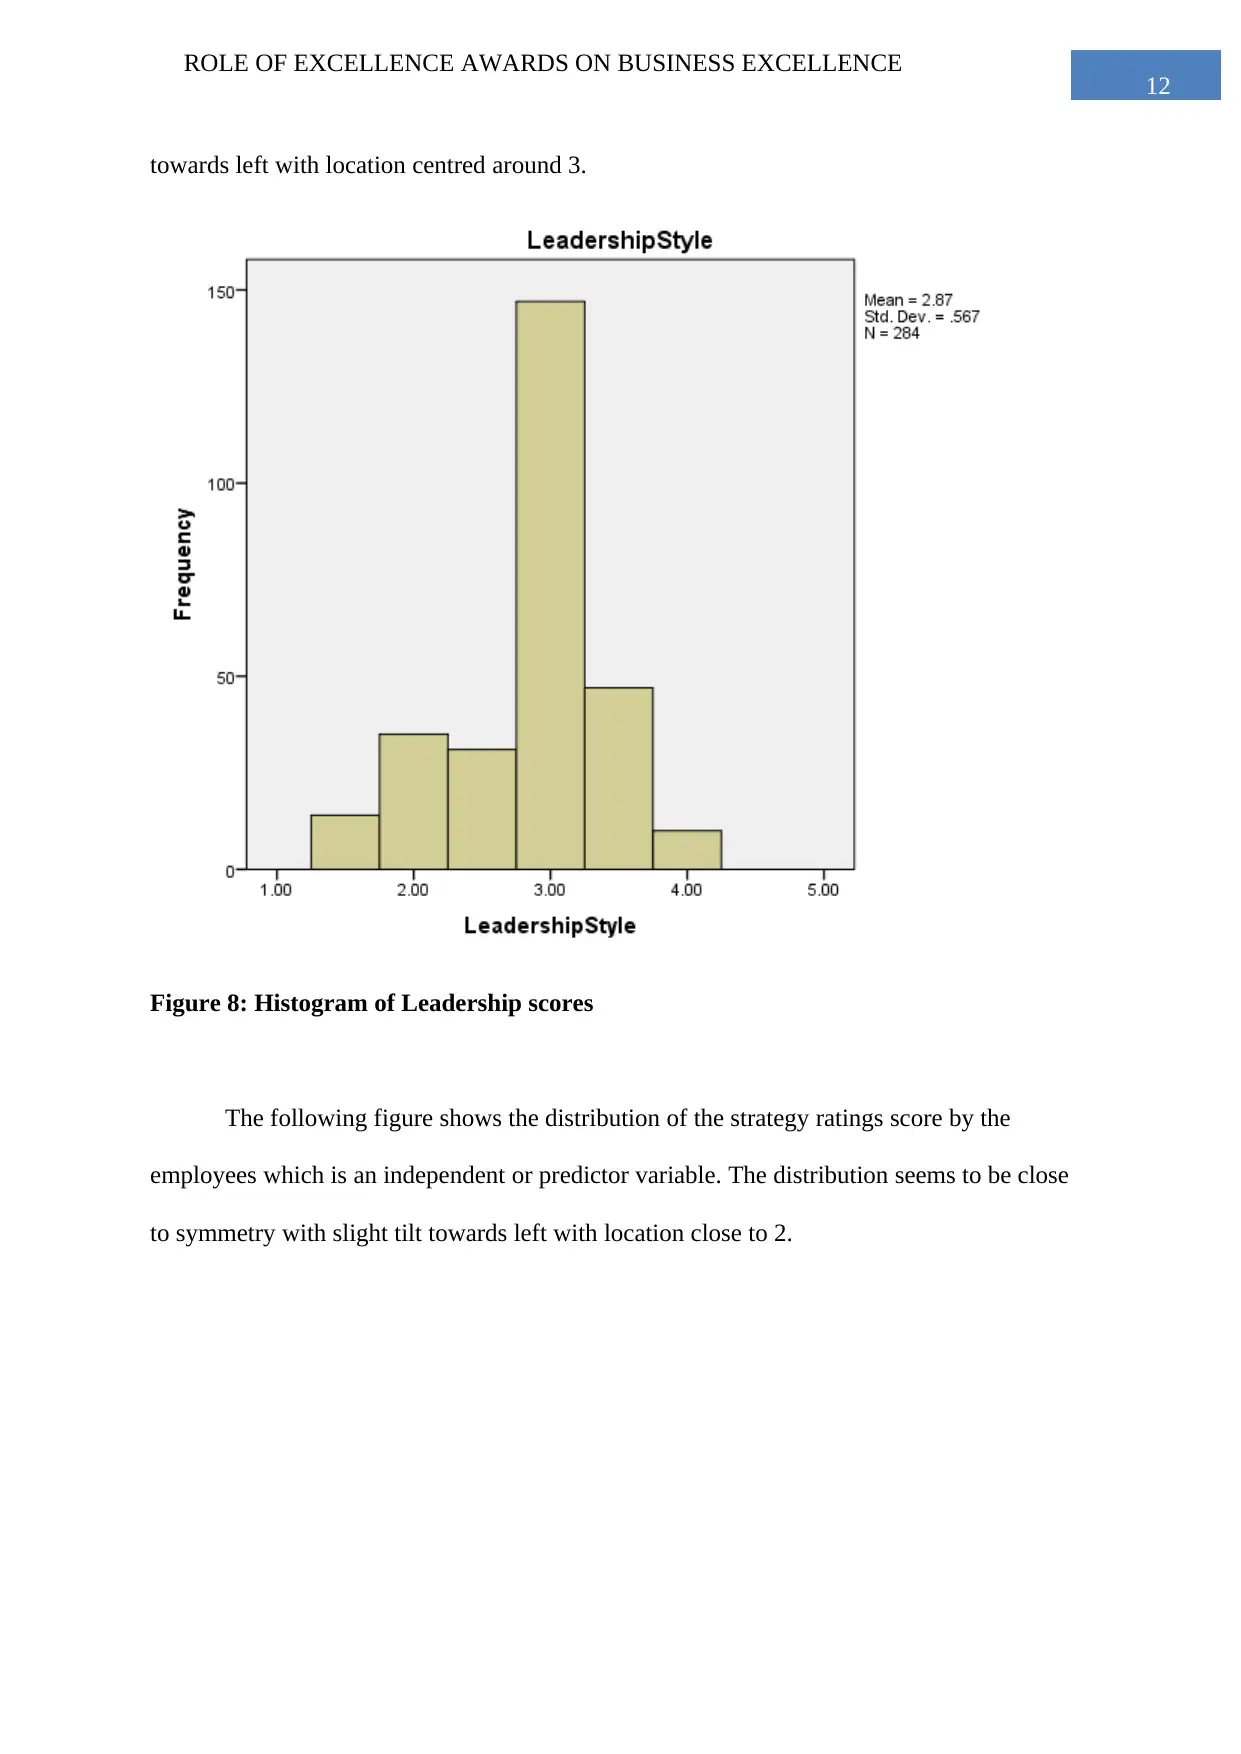
This report presents an analysis of a survey conducted on 284 employees in the government sector, investigating the relationship between organizational context and business excellence, moderated by the implementation of excellence awards. The study utilized a quantitative survey research method, with questionnaires focusing on demographic attributes, organizational context (leadership, strategy, technology, and structure), excellence awards policies, and the perceived level of business excellence. The data analysis included construct validity, demographic frequencies, descriptive statistics (mean, median, mode, standard deviation), reliability tests (Cronbach's alpha), and correlation analysis using SPSS software. The findings revealed significant correlations between business excellence and both strategy (negative) and structure (positive). The report details the distribution of various factors and the overall impact of excellence awards on business excellence within the surveyed organizations, offering valuable insights into the factors that contribute to business success.
Document Page
Running head: ROLE OF EXCELLENCE AWARDS ON BUSINESS EXCELLENCE
ROLE OF EXCELLENCE AWARDS ON BUSINESS EXCELLENCE
Name of Student
Name of University
Author Note
tabler-icon-diamond-filled.svg

Paraphrase This Document

Need a fresh take? Get an instant paraphrase of this document with our AI Paraphraser
Document Page
2
ROLE OF EXCELLENCE AWARDS ON BUSINESS EXCELLENCE
1.0 Analysis
Introduction
A survey was conducted on a population of size 30,000. The questionnaire was
designed to target those who were employed in the government sector. The key objective of
the survey was to gather information for a study on how ‘organizational context’ such as
strategy, organizational structure, technology being used and leadership relates to the level of
business excellence being experienced by the organization with respect to the implementation
of excellence awards policy. Due to time and resource constraints, it would have not been
feasible to take into account all of the 30,000 population members. Therefore a sample of 380
individuals was considered as respondents for the survey questionnaire. 284 out of these
individuals were found to have responded to the survey and the current paper discusses the
results of the analysis based on the data collected from the same.
Research Methodology
A survey research method was followed in this case. The questionnaire consisted of a
number of items, including those referring to demographic attributes of the respondents,
followed by a number on items measuring their ratings of their work environment with
respect to organizational context, namely four on leadership, five on strategy of the
organization, four on technology and a four on structure of the organization. Following this
item 24 to item 41 addressed their opinion and perception on the excellence awards policy at
work in their workplace. The final item is a rating of their perception of the level of business
excellence at their workplaces. For the purpose of the analysis, this rating of excellence is the
dependent variable. The independent variables considered are scores measured as medians of
the items addressing strategy, leadership, structure and technology respectively.
Document Page
3
ROLE OF EXCELLENCE AWARDS ON BUSINESS EXCELLENCE
Results
1. Construct Validity
The data collected contained 284 observations on six items addressing demographic
factors, such as their gender, age, nationality, educational qualification, job level at the
organization and the length of time that the respondent had been employed there.
Out of the 284 respondents 40.5 percent were found to be female and 59.5 percent
male.
1. Gender
Frequency Percent Valid Percent Cumulative
Percent
Valid
Female 115 40.5 40.5 40.5
Male 169 59.5 59.5 100.0
Total 284 100.0 100.0
Table 1
Document Page
4
ROLE OF EXCELLENCE AWARDS ON BUSINESS EXCELLENCE
Figure 1: Distribution of Gender
Out of all the respondents in the survey 7.7 percent were Egyptians, 0.4% were
French, 8.1 percent were Indians. Iraqi, Lebanese and those from Oman held 0.7 percent
participation percentage each.3.2 percent of the participants were Lebanese. 2.1 percent were
from Sudan, 57.8 percent were from the UAE and those from UK and USA were 2.5 and 8.5
percent respectively. So it is seen that majority of the participants hail from the Middle East.
2. Nationality
Frequency Percent Valid Percent Cumulative
Percent
Valid Egypt 22 7.7 7.7 7.7
France 1 .4 .4 8.1
India 23 8.1 8.1 16.2
Iraq 2 .7 .7 16.9
Jordan 2 .7 .7 17.6
Lebanon 9 3.2 3.2 20.8
tabler-icon-diamond-filled.svg

Paraphrase This Document

Need a fresh take? Get an instant paraphrase of this document with our AI Paraphraser
Document Page
5
ROLE OF EXCELLENCE AWARDS ON BUSINESS EXCELLENCE
Oman 2 .7 .7 21.5
Sudan 6 2.1 2.1 23.6
Syria 22 7.7 7.7 31.3
Uae 3 1.1 1.1 32.4
UAE 161 56.7 56.7 89.1
UK 7 2.5 2.5 91.5
US 15 5.3 5.3 96.8
USA 9 3.2 3.2 100.0
Total 284 100.0 100.0
Table 2: Nationality
Figure 2: Distribution of Age
Among all the respondents 15.5 percent were aged between 20 to 30 years, 50 percent
were aged between 31 and 40 years, 26.1 percent were between 41 years and 50 years and 8.5
percent were older than 50 years. Hence 65.5 percent were less than 40 years of age in the
survey.
Document Page
6
ROLE OF EXCELLENCE AWARDS ON BUSINESS EXCELLENCE
3. Current Age
Frequency Percent Valid Percent Cumulative
Percent
Valid
20 -30 44 15.5 15.5 15.5
31-40 142 50.0 50.0 65.5
41-50 74 26.1 26.1 91.5
More than 50 24 8.5 8.5 100.0
Total 284 100.0 100.0
Table 3: Age of respondents
Figure 3: Distribution of Age
Document Page
7
ROLE OF EXCELLENCE AWARDS ON BUSINESS EXCELLENCE
The survey found that 37.3 percent of the respondents had at most a Bachelors
Degree, 14.1 percent had at most a Doctorate degree, 44.7 percent were at most graduates
with Master degree and only 3.9 percent were just high school graduates. The sample thus
consists of mostly highly educated individuals.
4. Educational Level
Frequency Percent Valid Percent Cumulative
Percent
Valid
Bachelor degree 106 37.3 37.3 37.3
Doctorate degree 40 14.1 14.1 51.4
High School 11 3.9 3.9 55.3
Master degree 127 44.7 44.7 100.0
Total 284 100.0 100.0
Table 4: Qualification
Figure 4: Distribution of Education Category
tabler-icon-diamond-filled.svg

Paraphrase This Document

Need a fresh take? Get an instant paraphrase of this document with our AI Paraphraser
Document Page
8
ROLE OF EXCELLENCE AWARDS ON BUSINESS EXCELLENCE
Among all the responses, 19 percent reported that they were junior employees, 22.2
percent said that they were employed at lower management. 14.1 percent were at middle
management, 35.9 percent were senior employees and 8.8 percent reported that were at the
top management level. Therefore it is seen that most of the responses are from the lower
levels and that suits the study fine.
5. Job Level
Frequency Percent Valid Percent Cumulative
Percent
Valid
Junior Employee 54 19.0 19.0 19.0
Lower Management 63 22.2 22.2 41.2
Middle Management 40 14.1 14.1 55.3
Senior Employee 102 35.9 35.9 91.2
Top Management 25 8.8 8.8 100.0
Total 284 100.0 100.0
Table 5: Job Level
Document Page
9
ROLE OF EXCELLENCE AWARDS ON BUSINESS EXCELLENCE
Figure 5: Distribution of Job Categories
21.1 percent of the respondents reported that they had worked 2 to 8 years in the
organization, 60.2 percent had experience of 9 to 15 years, 8.8 percent had more than 15
years of experience and 9.9 percent had less than one year of experience. So the sample
consists of at least 60.2 percent having more than 9 years of experience.
6. Total number of working years
Frequency Percent Valid Percent Cumulative
Percent
Valid
2 to 8 years 60 21.1 21.1 21.1
9 to 15 years 171 60.2 60.2 81.3
More than 15 years 25 8.8 8.8 90.1
One year or less 28 9.9 9.9 100.0
Total 284 100.0 100.0
Table 6: Years Working
Document Page
10
ROLE OF EXCELLENCE AWARDS ON BUSINESS EXCELLENCE
Figure 6: Distribution of years of experience
The descriptive measures of the computed independent and moderator variables from
the items and the dependent variable are given in the following table. The measures of central
tendency, mean, median and mode as well as the dispersion measure of standard deviation are
given hence. The mean rating for business excellence of all the organizations by all the
respondents was found to be 3.5 on a scale of 4. The mean leadership style was seen to be
2.86. It was 2.75 for Strategy, 2.84 for structure, 3.02 for technology and 2.76 for the
excellence awards. The median was 3 for all. The modes for the variables were also 3 each
except for strategy which had slightly better rating of 3.5. Therefore the ratings for the
independent and moderator variable was high all lying in the vicinity of a rating score of 3.
The variation n the business excellence ratings was found to be high with3.5 so this variable
show high variability, however standard deviation for leadership, strategy, structure,
technology and excellence awards were found to be low, with the values being 0.56, 0.71,
0.77, 0.53 and 0.52 respectively.
Statistics
Business
Excellence
Leadership Style Strategy Structure Technology Excellence
Awards
N Valid 284 284 284 284 284 284
Missing 4 0 0 0 0 0
Mean 3.50 2.8662 2.7500 2.8451 3.0229 2.7676
Median 3.00 3.0000 3.0000 3.0000 3.0000 3.0000
Mode 3 3.00 3.50 3.00 3.00 3.00
Std. Deviation 3.500 .56679 .71765 .77319 .53368 .52554
Minimum 4 1.50 1.00 1.00 1.50 2.00
Maximum 3 4.00 4.00 4.00 4.00 4.00
Table 7: Descriptive Measures of Dependent Variable
The following figure shows the distribution of the business excellence ratings which
is the dependent variable. The distribution seems to be skewed towards left.
tabler-icon-diamond-filled.svg

Paraphrase This Document

Need a fresh take? Get an instant paraphrase of this document with our AI Paraphraser
Document Page
11
ROLE OF EXCELLENCE AWARDS ON BUSINESS EXCELLENCE
Figure 7: Histogram of Dependent Variable
The following figure shows the distribution of the leadership ratings by the employees
which is an independent or predictor variable. The distribution seems to be slightly skewed
Document Page
12
ROLE OF EXCELLENCE AWARDS ON BUSINESS EXCELLENCE
towards left with location centred around 3.
Figure 8: Histogram of Leadership scores
The following figure shows the distribution of the strategy ratings score by the
employees which is an independent or predictor variable. The distribution seems to be close
to symmetry with slight tilt towards left with location close to 2.
chevron_up_icon
1 out of 45
circle_padding
hide_on_mobile
zoom_out_icon