Financial Analysis of Excelsior Corporation: University Report
VerifiedAdded on 2021/06/14
|17
|3115
|21
Report
AI Summary
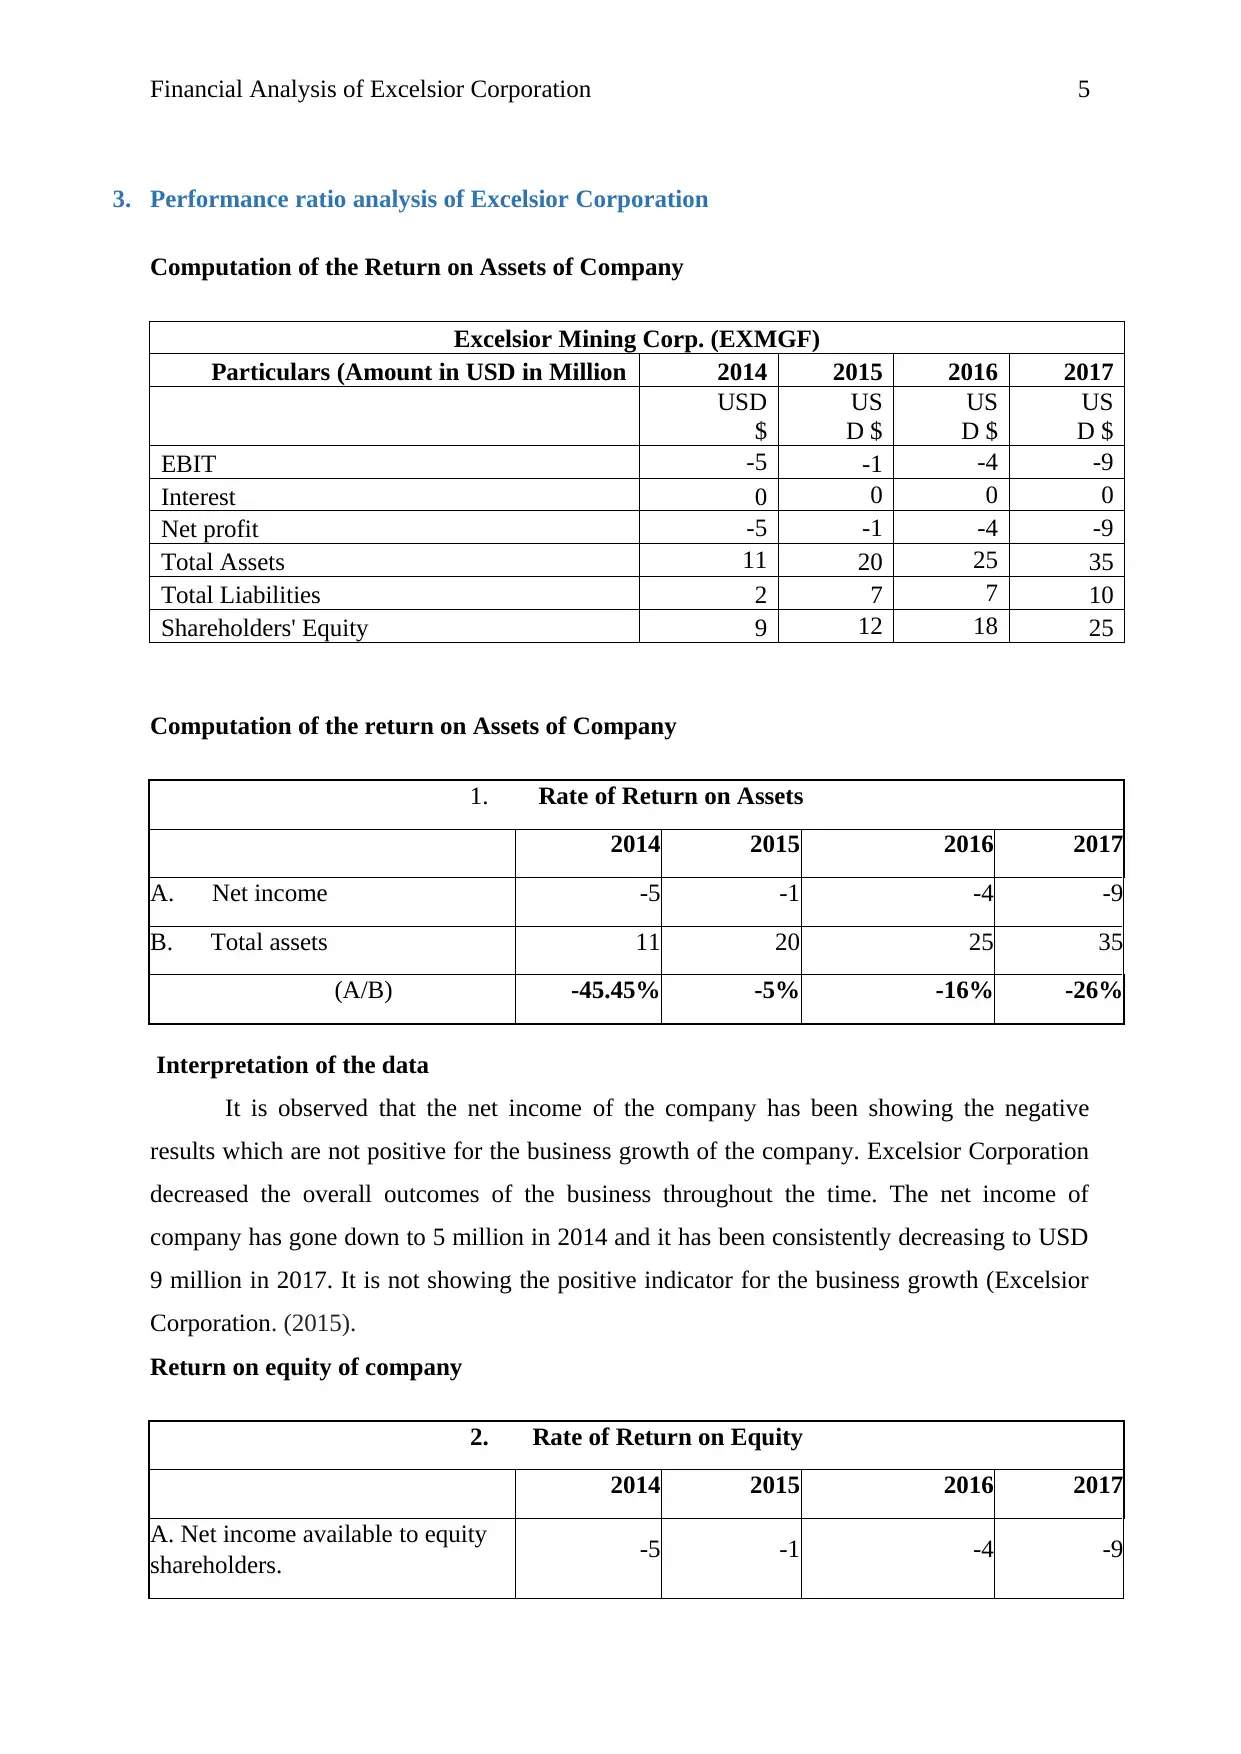
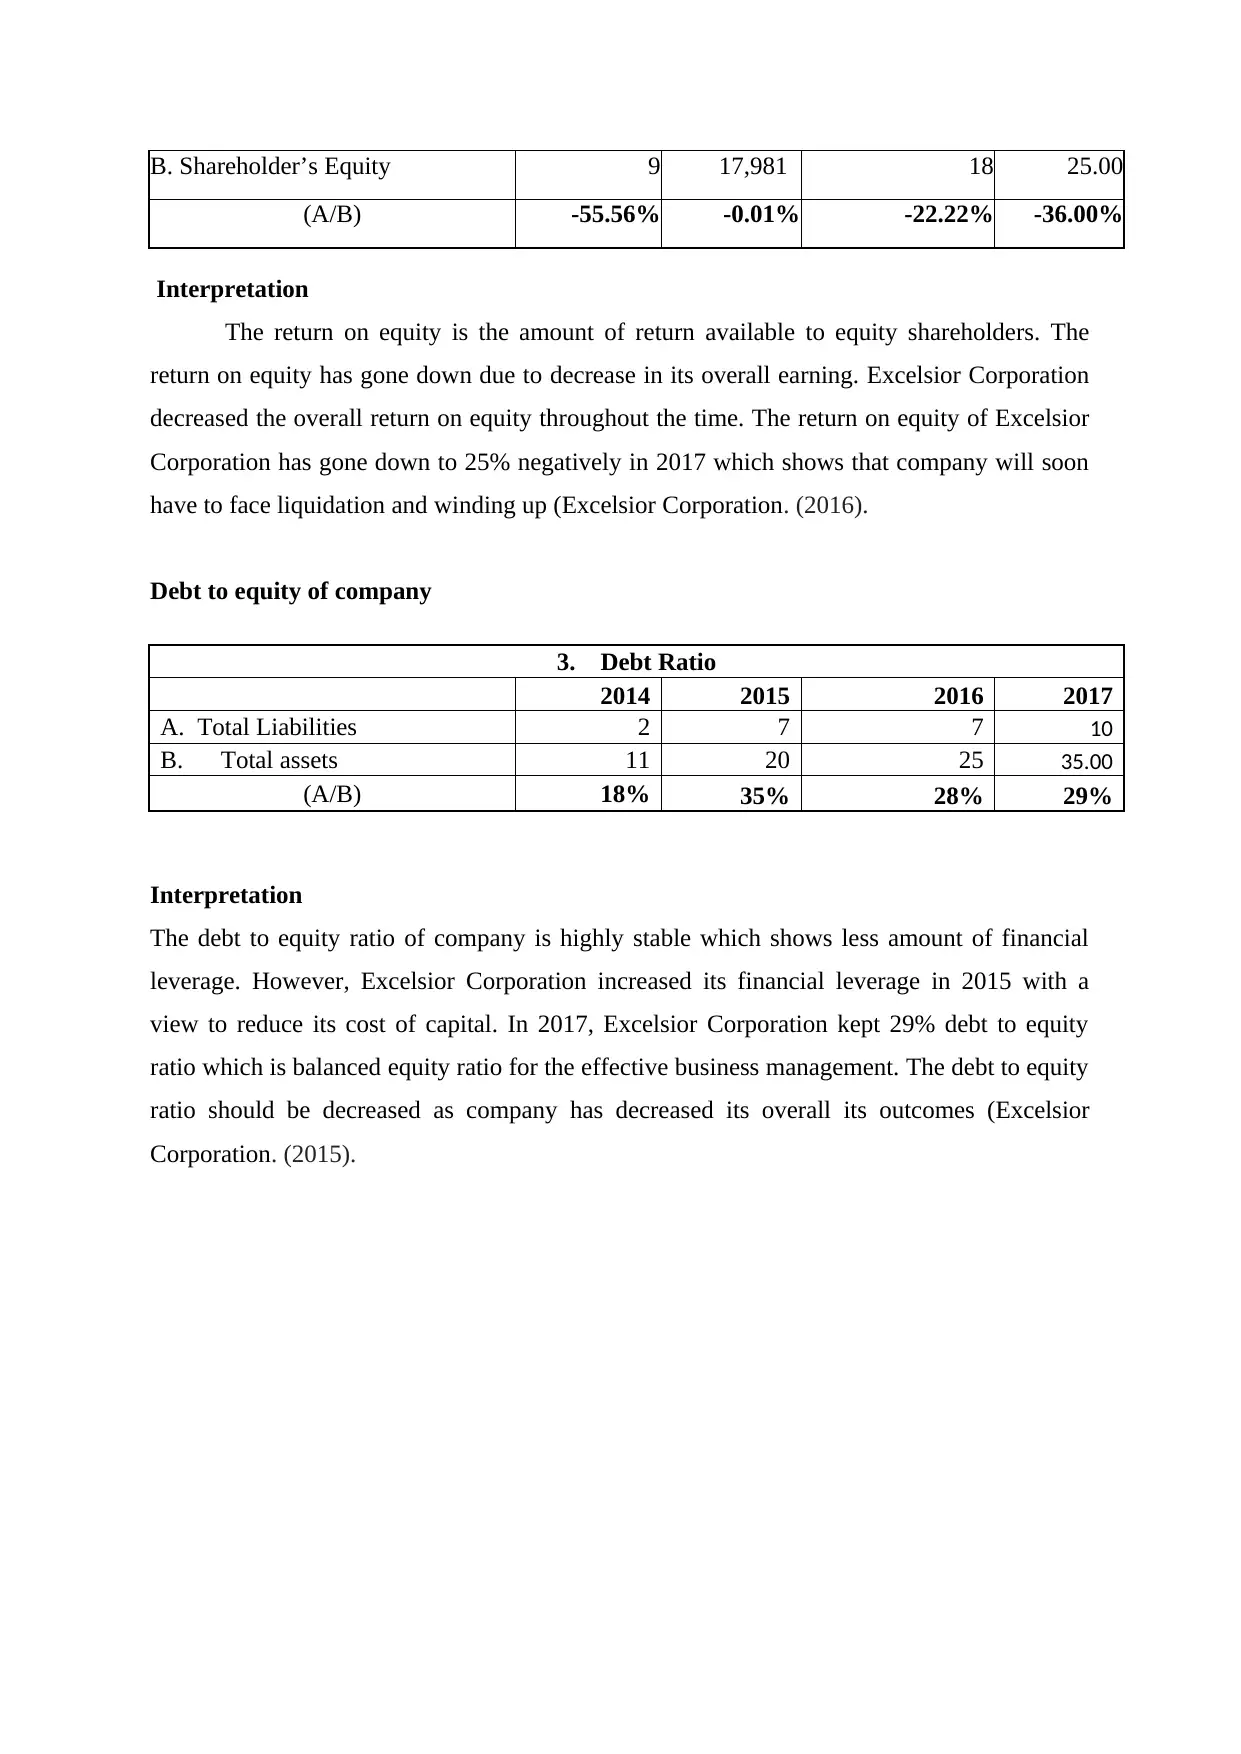
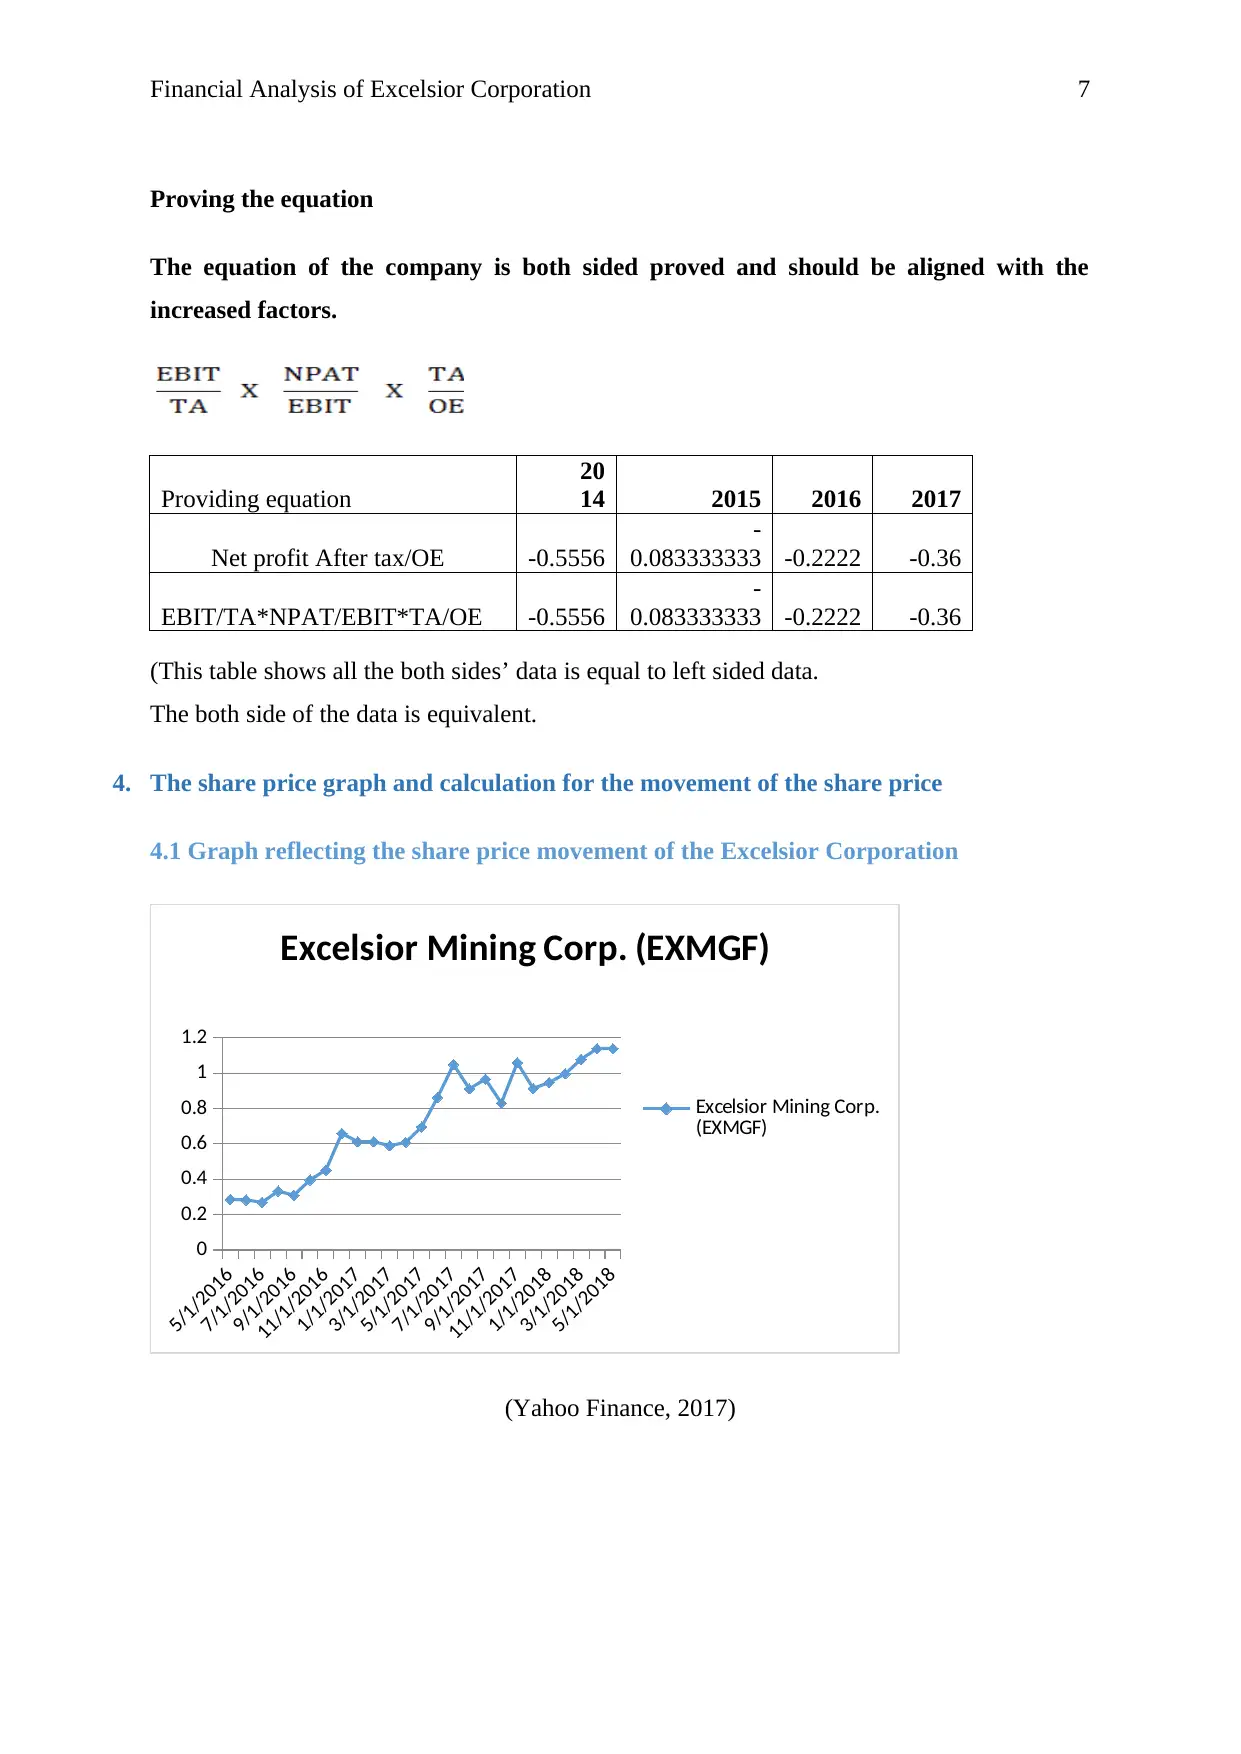
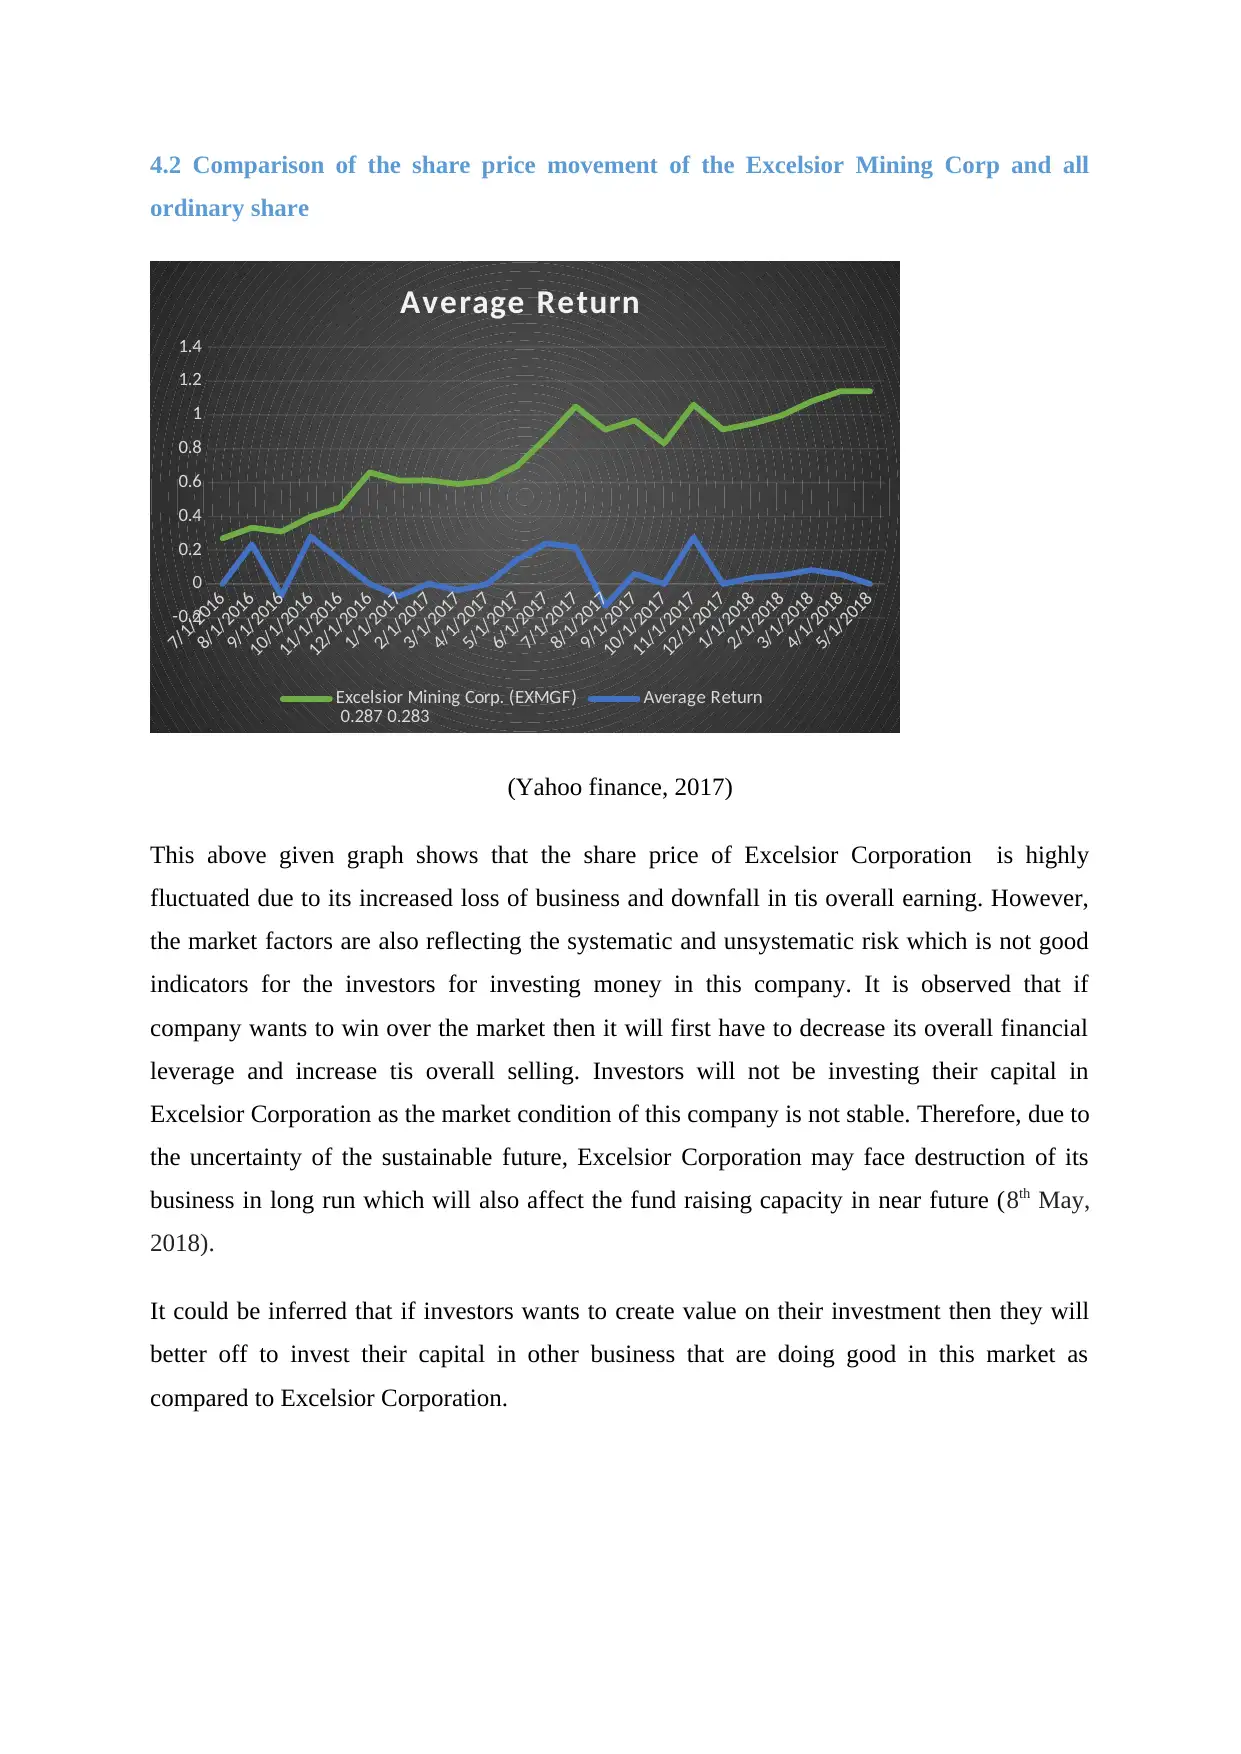
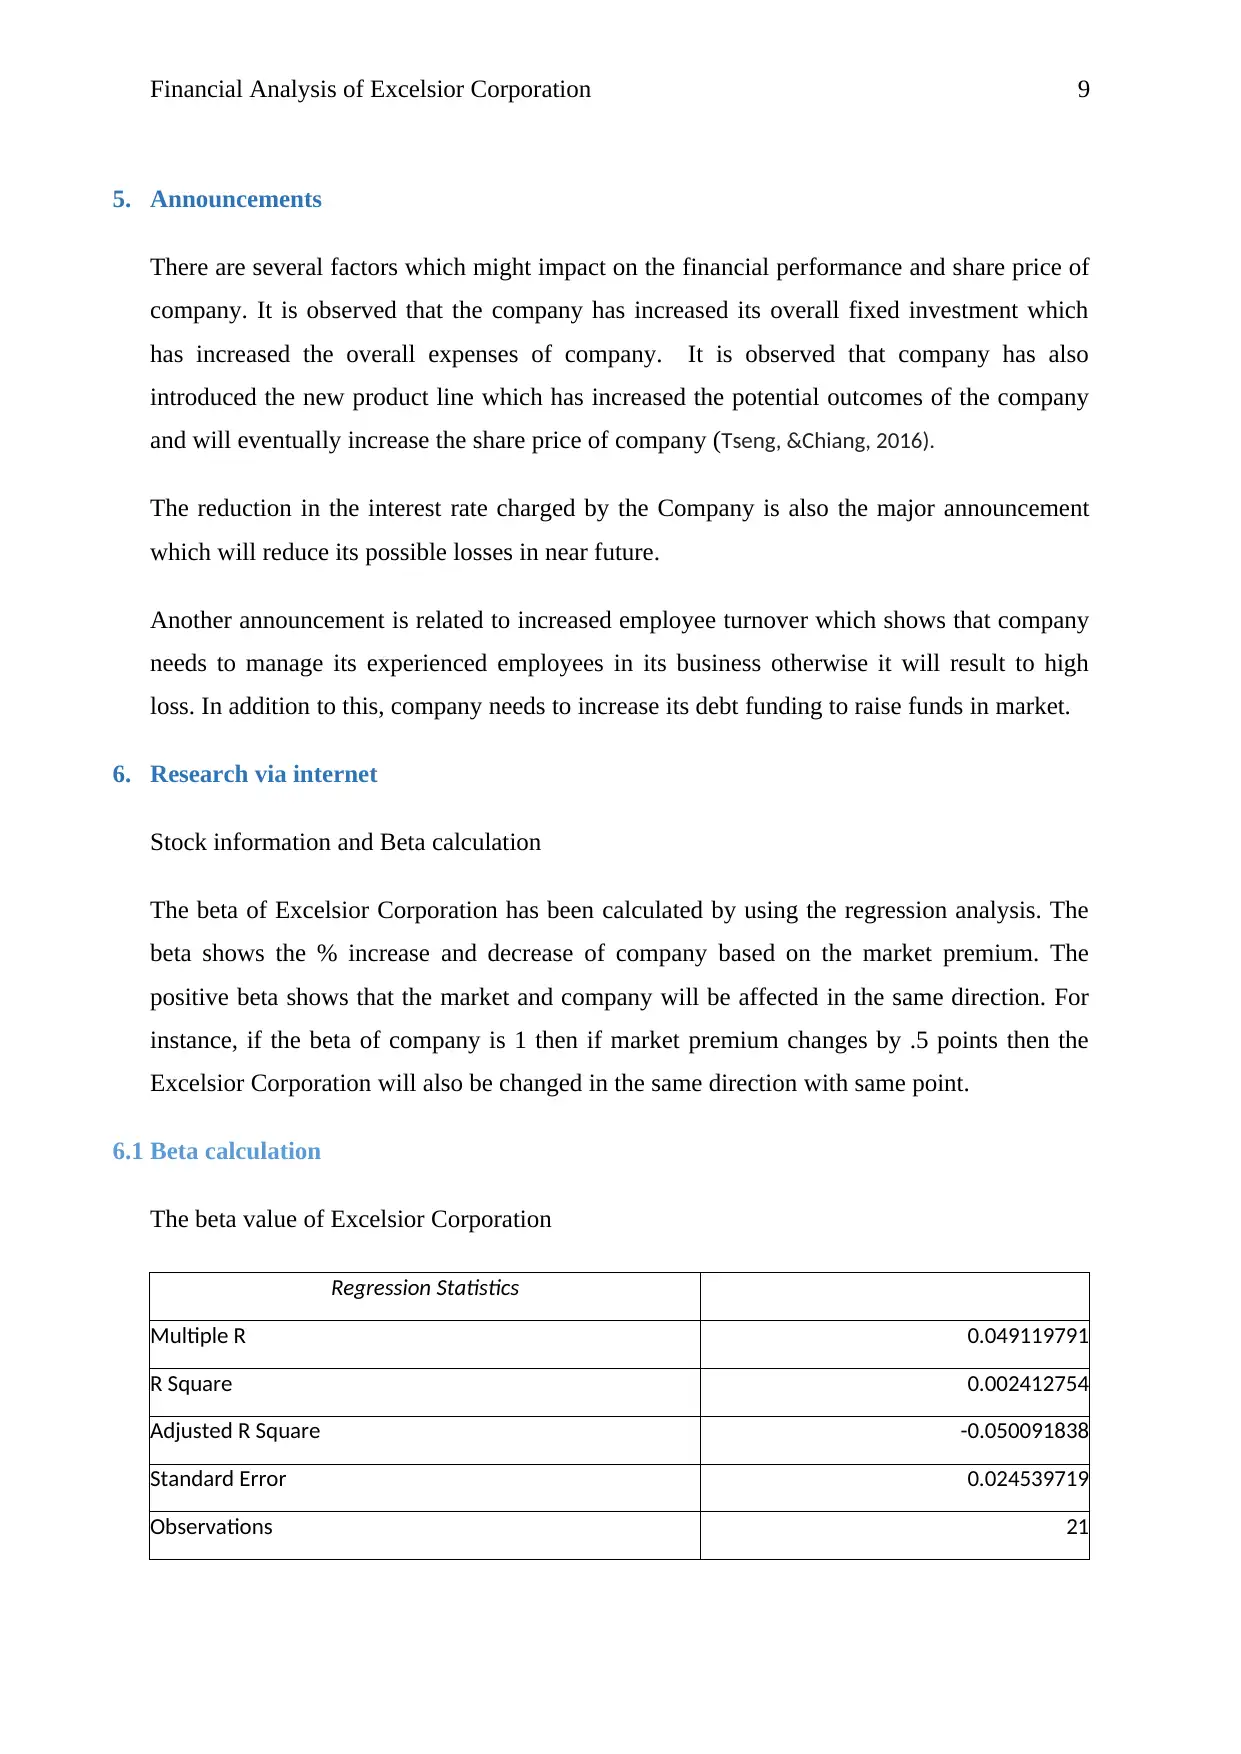
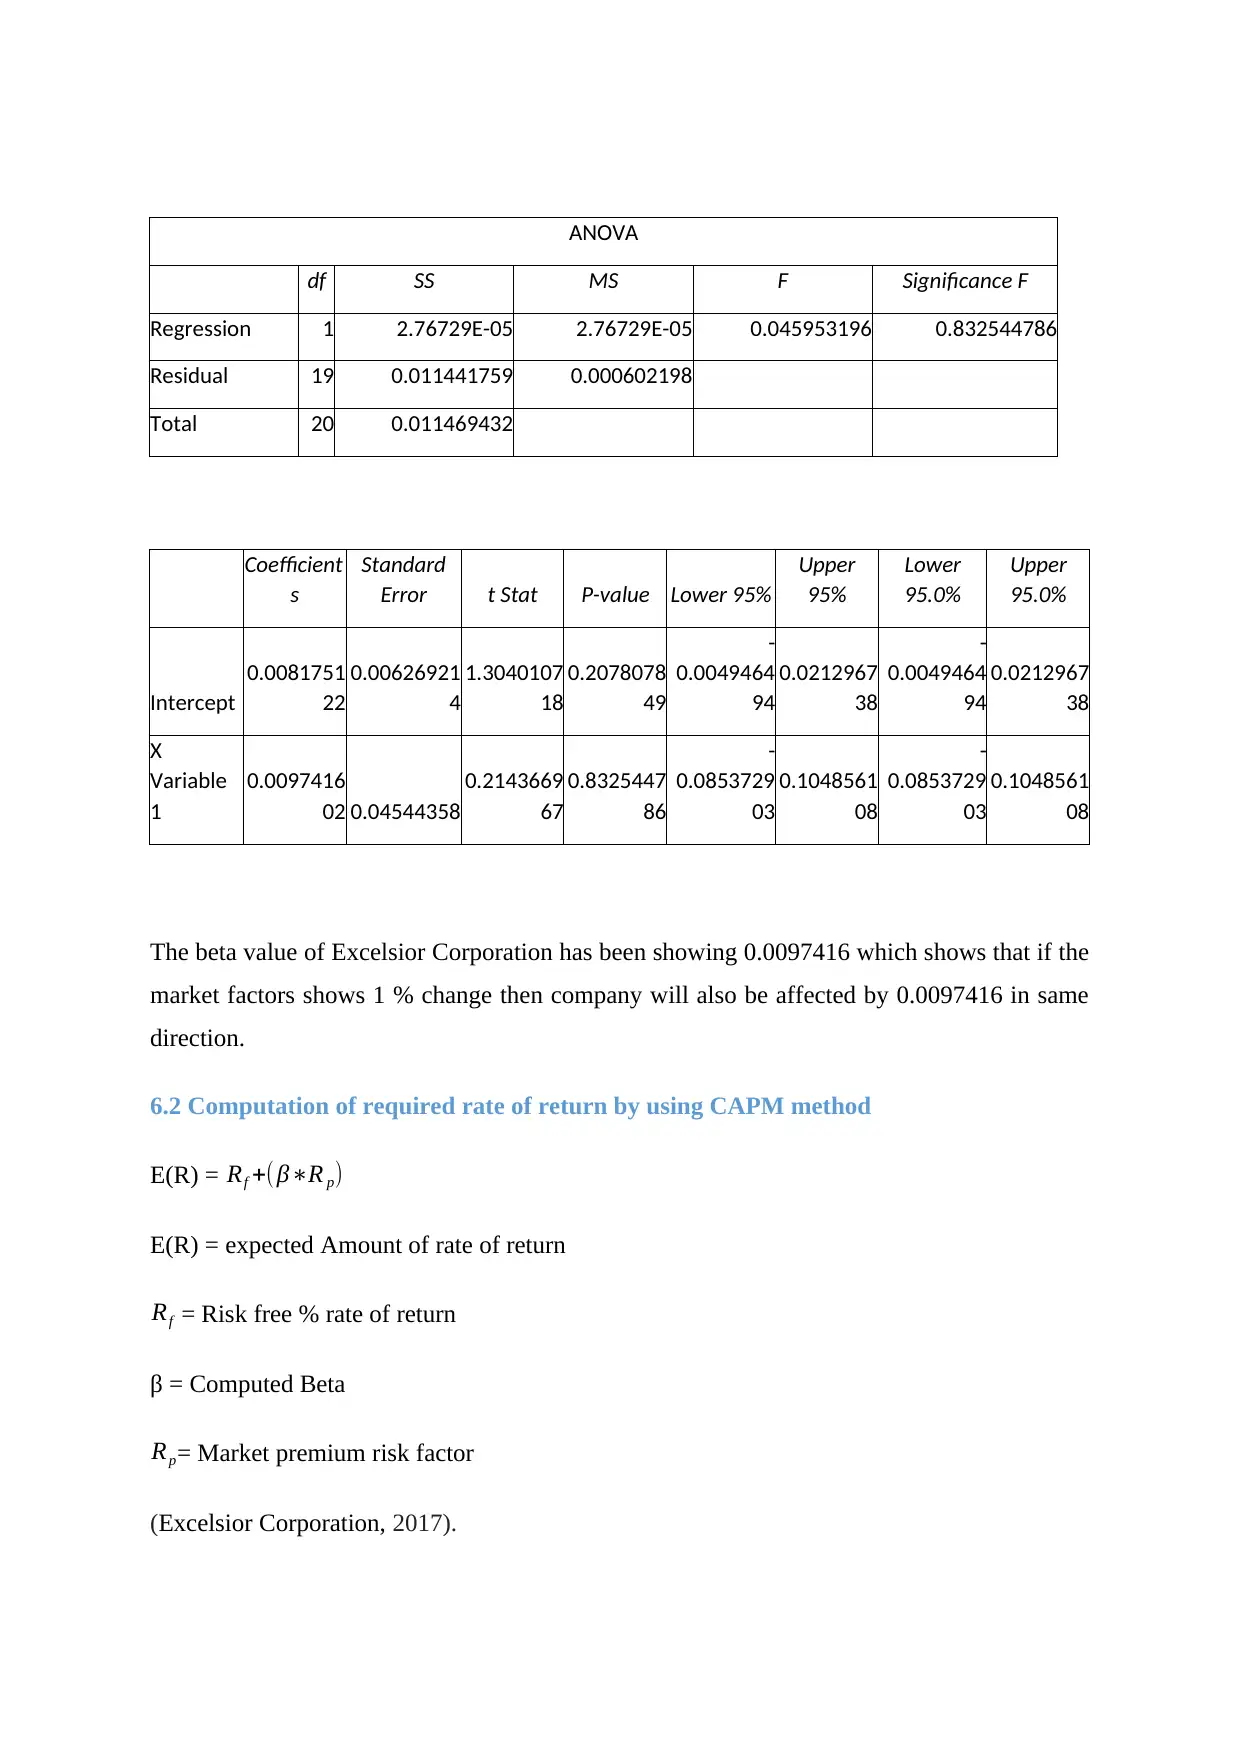
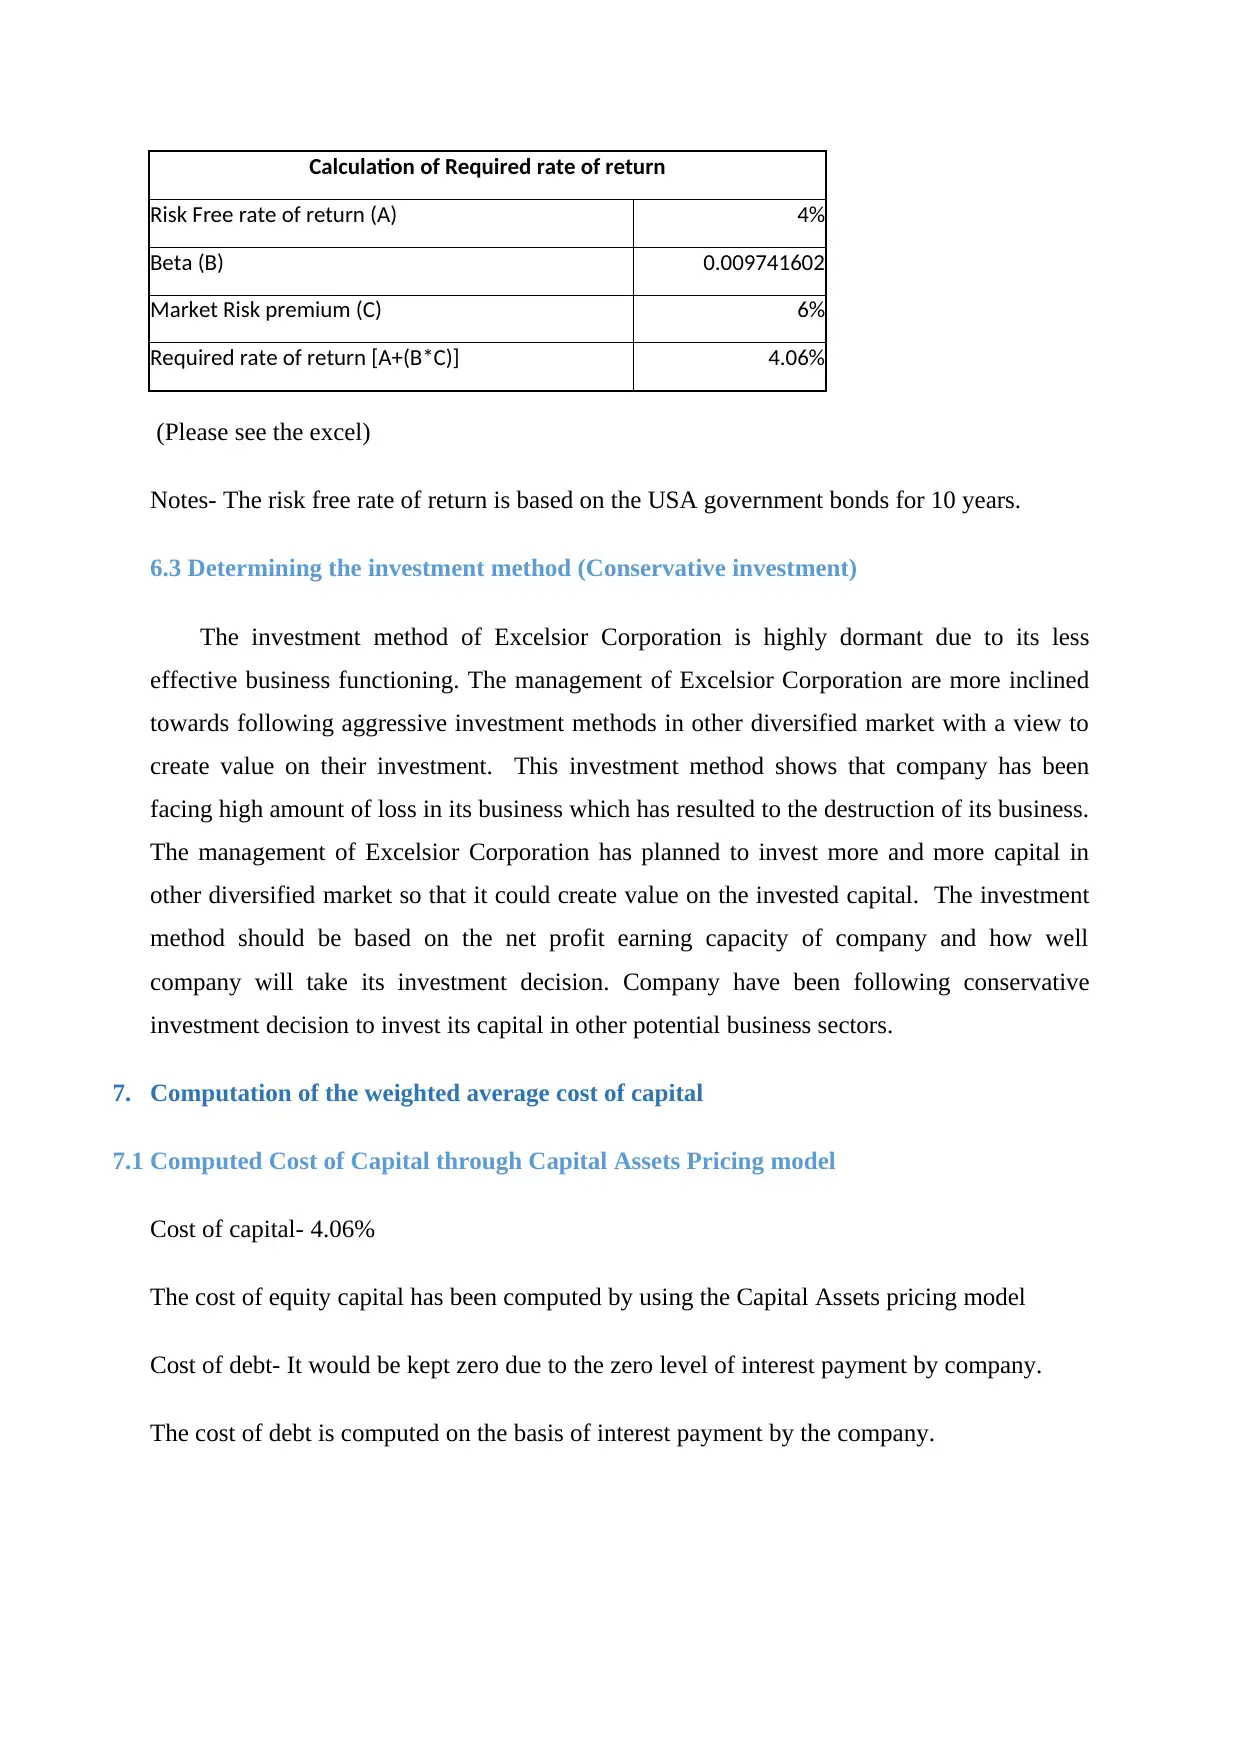
This report provides a financial analysis of Excelsior Corporation, examining its performance from 2014 to 2017. It includes an overview of the company, its governance structure, and ownership. The report delves into a performance ratio analysis, including Return on Assets, Return on Equity, and Debt-to-Equity ratios, with interpretations of the trends. It presents share price graphs and comparisons, alongside announcements impacting the company's financial standing. Furthermore, the analysis incorporates internet research, specifically beta calculations using regression analysis and the computation of the required rate of return using the CAPM method. The report also determines the investment method, calculates the weighted average cost of capital (WACC), and discusses the implications of a higher WACC on investment decisions. The debt ratio and dividend policies are also considered, culminating in a letter of recommendation and conclusions regarding Excelsior Corporation's financial health. The analysis reveals concerning trends, including declining net income, negative returns on equity, and fluctuating debt levels, which raise questions about the company's long-term sustainability and investment attractiveness.

RUNNING HEAD: Financial Analysis of Excelsior Corporation
1
Name of the student
Topic- Financial Analysis of Excelsior Corporation
University Name-
1
Name of the student
Topic- Financial Analysis of Excelsior Corporation
University Name-
Paraphrase This Document
Need a fresh take? Get an instant paraphrase of this document with our AI Paraphraser

Table of Contents
Introduction...........................................................................................................................................3
1. Details of Excelsior Corporation................................................................................................3
2. Governance and Ownership structure............................................................................................4
3. Performance ratio analysis of Excelsior Corporation.....................................................................5
4. The share price graph and calculation for the movement of the share price...................................7
4.1 Graph reflecting the share price movement of the Excelsior Corporation....................................7
4.2 Comparison of the share price movement of the Excelsior Mining Corp and all ordinary share. 8
5. Announcements.............................................................................................................................9
6. Research via internet.....................................................................................................................9
6.1 Beta calculation.....................................................................................................................9
6.2 Computation of required rate of return by using CAPM method...............................................10
6.3 Determining the investment method (Conservative investment)................................................11
7. Computation of the weighted average cost of capital...................................................................11
7.1 Computed Cost of Capital through Capital Assets Pricing model........................................11
7.2 Implications that a higher WACC on investment decision........................................................12
8. Debt ratio consideration of Excelsior Corporation.......................................................................12
8.1 Highly Fluctuated Debt to equity ratio of company.......................................................................12
8.2 Gearing ratio discussion.............................................................................................................13
9. Divided policies of company.......................................................................................................13
10. Letter of recommendation........................................................................................................14
11. Conclusion...............................................................................................................................15
12. References...............................................................................................................................16
13. Appendix.................................................................................................................................17

Financial Analysis of Excelsior Corporation 3
Introduction
There are several financial factors which need to be analysed for making the effective
business decision. It is observed that financial tool such as ratio analysis, capital budging and
other tools which have been assisting in evaluating the internal and external factors of the
business. This report reflects the financial performance of Excelsior Corporation which will
be assessed by using the different financial analysis tools. It has been evaluated that company
has faced high losses in its business due to its non-effective business.
1. Details of Excelsior Corporation
It is the American company which have been indulged in manufacturing and distribution of
packed, cushioned and engineering of products for the flexible foams and erosion. The Key
managerial people of this company are William D. Albers (Owner/Chairman of the Board
who have been providing instruction to employees for running the business effectively.
⊘ This is a preview!⊘
Do you want full access?
Subscribe today to unlock all pages.

Trusted by 1+ million students worldwide

2. Governance and Ownership structure
It is evaluated that the present CEO of company is Terry A. Sadowski
(Excelsior Corporation. (2017).
However, the major Shareholder of company is VA College America Smcap World 529E
There are several major owners of the company. However, the CEO of the company has
found high loss in its business due to the negative market factors and less profitable business
factors.
Paraphrase This Document
Need a fresh take? Get an instant paraphrase of this document with our AI Paraphraser

Financial Analysis of Excelsior Corporation 5
3. Performance ratio analysis of Excelsior Corporation
Computation of the Return on Assets of Company
Excelsior Mining Corp. (EXMGF)
Particulars (Amount in USD in Million 2014 2015 2016 2017
USD
$
US
D $
US
D $
US
D $
EBIT -5 -1 -4 -9
Interest 0 0 0 0
Net profit -5 -1 -4 -9
Total Assets 11 20 25 35
Total Liabilities 2 7 7 10
Shareholders' Equity 9 12 18 25
Computation of the return on Assets of Company
1. Rate of Return on Assets
2014 2015 2016 2017
A. Net income -5 -1 -4 -9
B. Total assets 11 20 25 35
(A/B) -45.45% -5% -16% -26%
Interpretation of the data
It is observed that the net income of the company has been showing the negative
results which are not positive for the business growth of the company. Excelsior Corporation
decreased the overall outcomes of the business throughout the time. The net income of
company has gone down to 5 million in 2014 and it has been consistently decreasing to USD
9 million in 2017. It is not showing the positive indicator for the business growth (Excelsior
Corporation. (2015).
Return on equity of company
2. Rate of Return on Equity
2014 2015 2016 2017
A. Net income available to equity
shareholders. -5 -1 -4 -9

B. Shareholder’s Equity 9 17,981 18 25.00
(A/B) -55.56% -0.01% -22.22% -36.00%
Interpretation
The return on equity is the amount of return available to equity shareholders. The
return on equity has gone down due to decrease in its overall earning. Excelsior Corporation
decreased the overall return on equity throughout the time. The return on equity of Excelsior
Corporation has gone down to 25% negatively in 2017 which shows that company will soon
have to face liquidation and winding up (Excelsior Corporation. (2016).
Debt to equity of company
3. Debt Ratio
2014 2015 2016 2017
A. Total Liabilities 2 7 7 10
B. Total assets 11 20 25 35.00
(A/B) 18% 35% 28% 29%
Interpretation
The debt to equity ratio of company is highly stable which shows less amount of financial
leverage. However, Excelsior Corporation increased its financial leverage in 2015 with a
view to reduce its cost of capital. In 2017, Excelsior Corporation kept 29% debt to equity
ratio which is balanced equity ratio for the effective business management. The debt to equity
ratio should be decreased as company has decreased its overall its outcomes (Excelsior
Corporation. (2015).
⊘ This is a preview!⊘
Do you want full access?
Subscribe today to unlock all pages.

Trusted by 1+ million students worldwide

Financial Analysis of Excelsior Corporation 7
Proving the equation
The equation of the company is both sided proved and should be aligned with the
increased factors.
Providing equation
20
14 2015 2016 2017
Net profit After tax/OE -0.5556
-
0.083333333 -0.2222 -0.36
EBIT/TA*NPAT/EBIT*TA/OE -0.5556
-
0.083333333 -0.2222 -0.36
(This table shows all the both sides’ data is equal to left sided data.
The both side of the data is equivalent.
4. The share price graph and calculation for the movement of the share price
4.1 Graph reflecting the share price movement of the Excelsior Corporation
5/1/2016
7/1/2016
9/1/2016
11/1/2016
1/1/2017
3/1/2017
5/1/2017
7/1/2017
9/1/2017
11/1/2017
1/1/2018
3/1/2018
5/1/2018
0
0.2
0.4
0.6
0.8
1
1.2
Excelsior Mining Corp. (EXMGF)
Excelsior Mining Corp.
(EXMGF)
(Yahoo Finance, 2017)
Paraphrase This Document
Need a fresh take? Get an instant paraphrase of this document with our AI Paraphraser

4.2 Comparison of the share price movement of the Excelsior Mining Corp and all
ordinary share
7/1/2016
8/1/2016
9/1/2016
10/1/2016
11/1/2016
12/1/2016
1/1/2017
2/1/2017
3/1/2017
4/1/2017
5/1/2017
6/1/2017
7/1/2017
8/1/2017
9/1/2017
10/1/2017
11/1/2017
12/1/2017
1/1/2018
2/1/2018
3/1/2018
4/1/2018
5/1/2018
-0.2
0
0.2
0.4
0.6
0.8
1
1.2
1.4
Average Return
Excelsior Mining Corp. (EXMGF)
0.287 0.283 Average Return
(Yahoo finance, 2017)
This above given graph shows that the share price of Excelsior Corporation is highly
fluctuated due to its increased loss of business and downfall in tis overall earning. However,
the market factors are also reflecting the systematic and unsystematic risk which is not good
indicators for the investors for investing money in this company. It is observed that if
company wants to win over the market then it will first have to decrease its overall financial
leverage and increase tis overall selling. Investors will not be investing their capital in
Excelsior Corporation as the market condition of this company is not stable. Therefore, due to
the uncertainty of the sustainable future, Excelsior Corporation may face destruction of its
business in long run which will also affect the fund raising capacity in near future (8th May,
2018).
It could be inferred that if investors wants to create value on their investment then they will
better off to invest their capital in other business that are doing good in this market as
compared to Excelsior Corporation.

Financial Analysis of Excelsior Corporation 9
5. Announcements
There are several factors which might impact on the financial performance and share price of
company. It is observed that the company has increased its overall fixed investment which
has increased the overall expenses of company. It is observed that company has also
introduced the new product line which has increased the potential outcomes of the company
and will eventually increase the share price of company (Tseng, &Chiang, 2016).
The reduction in the interest rate charged by the Company is also the major announcement
which will reduce its possible losses in near future.
Another announcement is related to increased employee turnover which shows that company
needs to manage its experienced employees in its business otherwise it will result to high
loss. In addition to this, company needs to increase its debt funding to raise funds in market.
6. Research via internet
Stock information and Beta calculation
The beta of Excelsior Corporation has been calculated by using the regression analysis. The
beta shows the % increase and decrease of company based on the market premium. The
positive beta shows that the market and company will be affected in the same direction. For
instance, if the beta of company is 1 then if market premium changes by .5 points then the
Excelsior Corporation will also be changed in the same direction with same point.
6.1 Beta calculation
The beta value of Excelsior Corporation
Regression Statistics
Multiple R 0.049119791
R Square 0.002412754
Adjusted R Square -0.050091838
Standard Error 0.024539719
Observations 21
⊘ This is a preview!⊘
Do you want full access?
Subscribe today to unlock all pages.

Trusted by 1+ million students worldwide

ANOVA
df SS MS F Significance F
Regression 1 2.76729E-05 2.76729E-05 0.045953196 0.832544786
Residual 19 0.011441759 0.000602198
Total 20 0.011469432
Coefficient
s
Standard
Error t Stat P-value Lower 95%
Upper
95%
Lower
95.0%
Upper
95.0%
Intercept
0.0081751
22
0.00626921
4
1.3040107
18
0.2078078
49
-
0.0049464
94
0.0212967
38
-
0.0049464
94
0.0212967
38
X
Variable
1
0.0097416
02 0.04544358
0.2143669
67
0.8325447
86
-
0.0853729
03
0.1048561
08
-
0.0853729
03
0.1048561
08
The beta value of Excelsior Corporation has been showing 0.0097416 which shows that if the
market factors shows 1 % change then company will also be affected by 0.0097416 in same
direction.
6.2 Computation of required rate of return by using CAPM method
E(R) = Rf +( β∗R p)
E(R) = expected Amount of rate of return
Rf = Risk free % rate of return
β = Computed Beta
Rp= Market premium risk factor
(Excelsior Corporation, 2017).
Paraphrase This Document
Need a fresh take? Get an instant paraphrase of this document with our AI Paraphraser

Financial Analysis of Excelsior Corporation 11

Calculation of Required rate of return
Risk Free rate of return (A) 4%
Beta (B) 0.009741602
Market Risk premium (C) 6%
Required rate of return [A+(B*C)] 4.06%
(Please see the excel)
Notes- The risk free rate of return is based on the USA government bonds for 10 years.
6.3 Determining the investment method (Conservative investment)
The investment method of Excelsior Corporation is highly dormant due to its less
effective business functioning. The management of Excelsior Corporation are more inclined
towards following aggressive investment methods in other diversified market with a view to
create value on their investment. This investment method shows that company has been
facing high amount of loss in its business which has resulted to the destruction of its business.
The management of Excelsior Corporation has planned to invest more and more capital in
other diversified market so that it could create value on the invested capital. The investment
method should be based on the net profit earning capacity of company and how well
company will take its investment decision. Company have been following conservative
investment decision to invest its capital in other potential business sectors.
7. Computation of the weighted average cost of capital
7.1 Computed Cost of Capital through Capital Assets Pricing model
Cost of capital- 4.06%
The cost of equity capital has been computed by using the Capital Assets pricing model
Cost of debt- It would be kept zero due to the zero level of interest payment by company.
The cost of debt is computed on the basis of interest payment by the company.
⊘ This is a preview!⊘
Do you want full access?
Subscribe today to unlock all pages.

Trusted by 1+ million students worldwide
1 out of 17
Related Documents
Your All-in-One AI-Powered Toolkit for Academic Success.
+13062052269
info@desklib.com
Available 24*7 on WhatsApp / Email
Unlock your academic potential
Copyright © 2020–2025 A2Z Services. All Rights Reserved. Developed and managed by ZUCOL.


