Understanding Exchange Rate Dynamics Between AUD and USD
VerifiedAdded on 2020/07/22
|15
|3399
|184
AI Summary
The analysis examines the economic interdependence between Australia and the USA, focusing on how US GDP influences key Australian economic metrics like interest rates and net exports. Historical data from 1985 to 2016 reveals a strong correlation between US economic performance and Australian financial indicators. Furthermore, it discusses the impact of fiscal and monetary policies on both economies, highlighting the importance of understanding these relationships for policymakers and economists.

CRITICAL REVIEW –
RESEARCH PROJECT
RESEARCH PROJECT
Paraphrase This Document
Need a fresh take? Get an instant paraphrase of this document with our AI Paraphraser
TABLE OF CONTENTS
EXECUTIVE SUMMARY ............................................................................................................1
INTRODUCTION...........................................................................................................................1
Obtaining data and arrange in proper structure to the collected information.........................1
Statistical table of data set using correlation tool...................................................................6
Producing appropriate pair-wise charts of every series from the table and critical analysis of
their relationship.....................................................................................................................7
Influence of monetary and fiscal policies on Australian and USA economy.......................10
CONCLUSION .............................................................................................................................11
REFERENCES .............................................................................................................................13
EXECUTIVE SUMMARY
Macroeconomics is a broad branch of the subject economics in which major concepts of
an economy are studied and analysed in an appropriate direction. A term macroeconomic
performance indicates that, in which ways a country performs in the world and able to meet key
purposes of policies framed by government. Basic goal behind assessing and improving
performance is to enhance living of standards of the people along with growth rate of economy.
The present project discussing about the macroeconomic performance of Australian as well as
USA economy. In the market some commentators comment that due to changing in growth rate
of USA, tendency of the growth rate of Australia also influenced. Further, this particular
statement is critically evaluated in the study after considering different economic data. Apart
from this, a statistical tool i.e. correlation is also applied on the collected data set for ascertaining
relationship of data in both the countries. After doing the whole analysis it can be clearly
visualised that as real GDP of USA fluctuates then create impact on the Australian recession and
expansions up to the certain level.
INTRODUCTION
In each and every country macroeconomic performance playing the pivotal role because
it helps to determine that whether an economy perform in positive direction or negative. The
present research focusing on macroeconomic performance of Australia and USA these two
countries (Business council of Australia, 2017). Along with this, it has been analysed in the study
that whether real GDP rate of USA affects to the Australian economy in terms of recession and
expansions or not. For this analysis, various economic data collected which include GDP, net
exports growth rate, interest rate and exchange rate movement with reference to Australia and
US from fiscal year 1985 – 2016. In addition to this, relationship among such data between both
countries is critically analysed. At the end of project, impact of fiscal and monetary policies on
selected economy is discussed.
Obtaining data and arrange in proper structure to the collected information
In order to measure that in which ways or direction a company or country performs in
market and world respectively, some information required. The reason is that behind need data is
that, it works as a raw material for the research and analyse possible outcomes in a proper
direction. For evaluating macroeconomic performance of Australia and USA some data set
1
⊘ This is a preview!⊘
Do you want full access?
Subscribe today to unlock all pages.
Trusted by 1+ million students worldwide
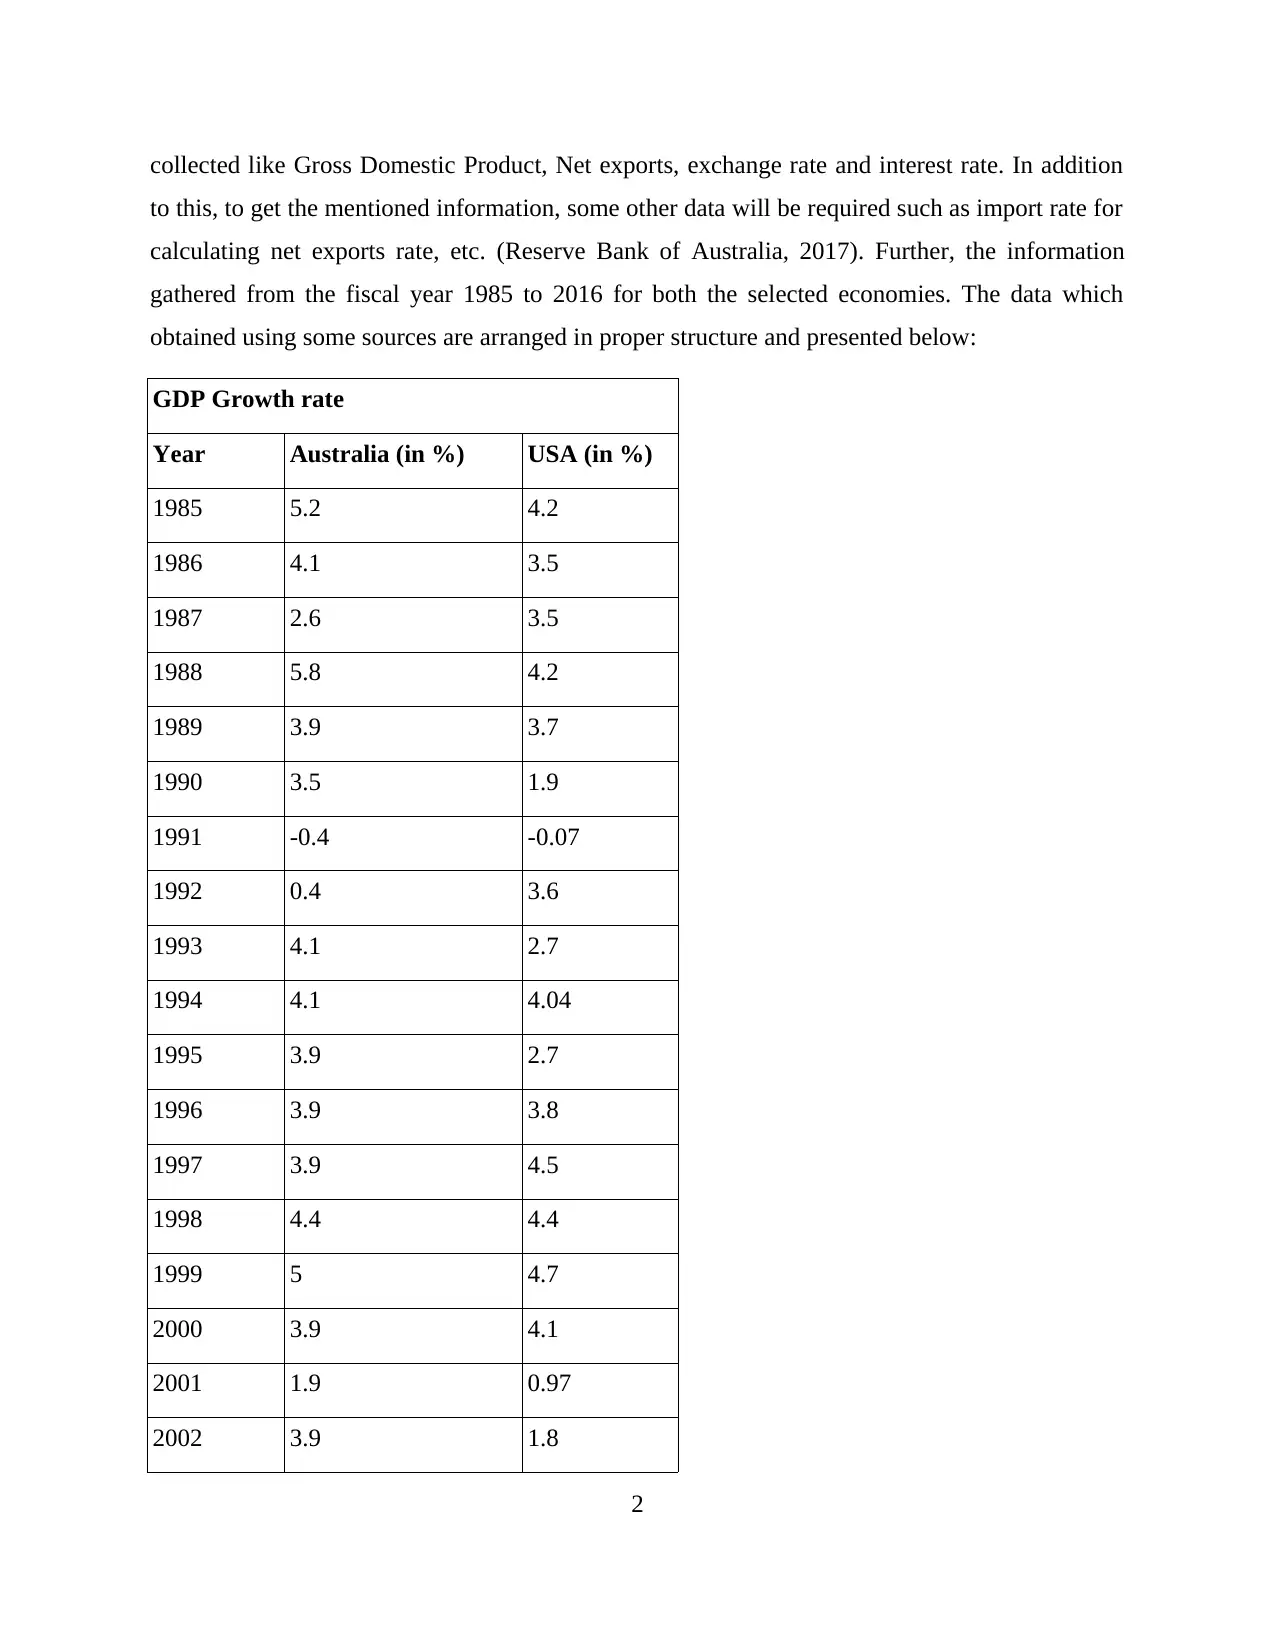
collected like Gross Domestic Product, Net exports, exchange rate and interest rate. In addition
to this, to get the mentioned information, some other data will be required such as import rate for
calculating net exports rate, etc. (Reserve Bank of Australia, 2017). Further, the information
gathered from the fiscal year 1985 to 2016 for both the selected economies. The data which
obtained using some sources are arranged in proper structure and presented below:
GDP Growth rate
Year Australia (in %) USA (in %)
1985 5.2 4.2
1986 4.1 3.5
1987 2.6 3.5
1988 5.8 4.2
1989 3.9 3.7
1990 3.5 1.9
1991 -0.4 -0.07
1992 0.4 3.6
1993 4.1 2.7
1994 4.1 4.04
1995 3.9 2.7
1996 3.9 3.8
1997 3.9 4.5
1998 4.4 4.4
1999 5 4.7
2000 3.9 4.1
2001 1.9 0.97
2002 3.9 1.8
2
Paraphrase This Document
Need a fresh take? Get an instant paraphrase of this document with our AI Paraphraser
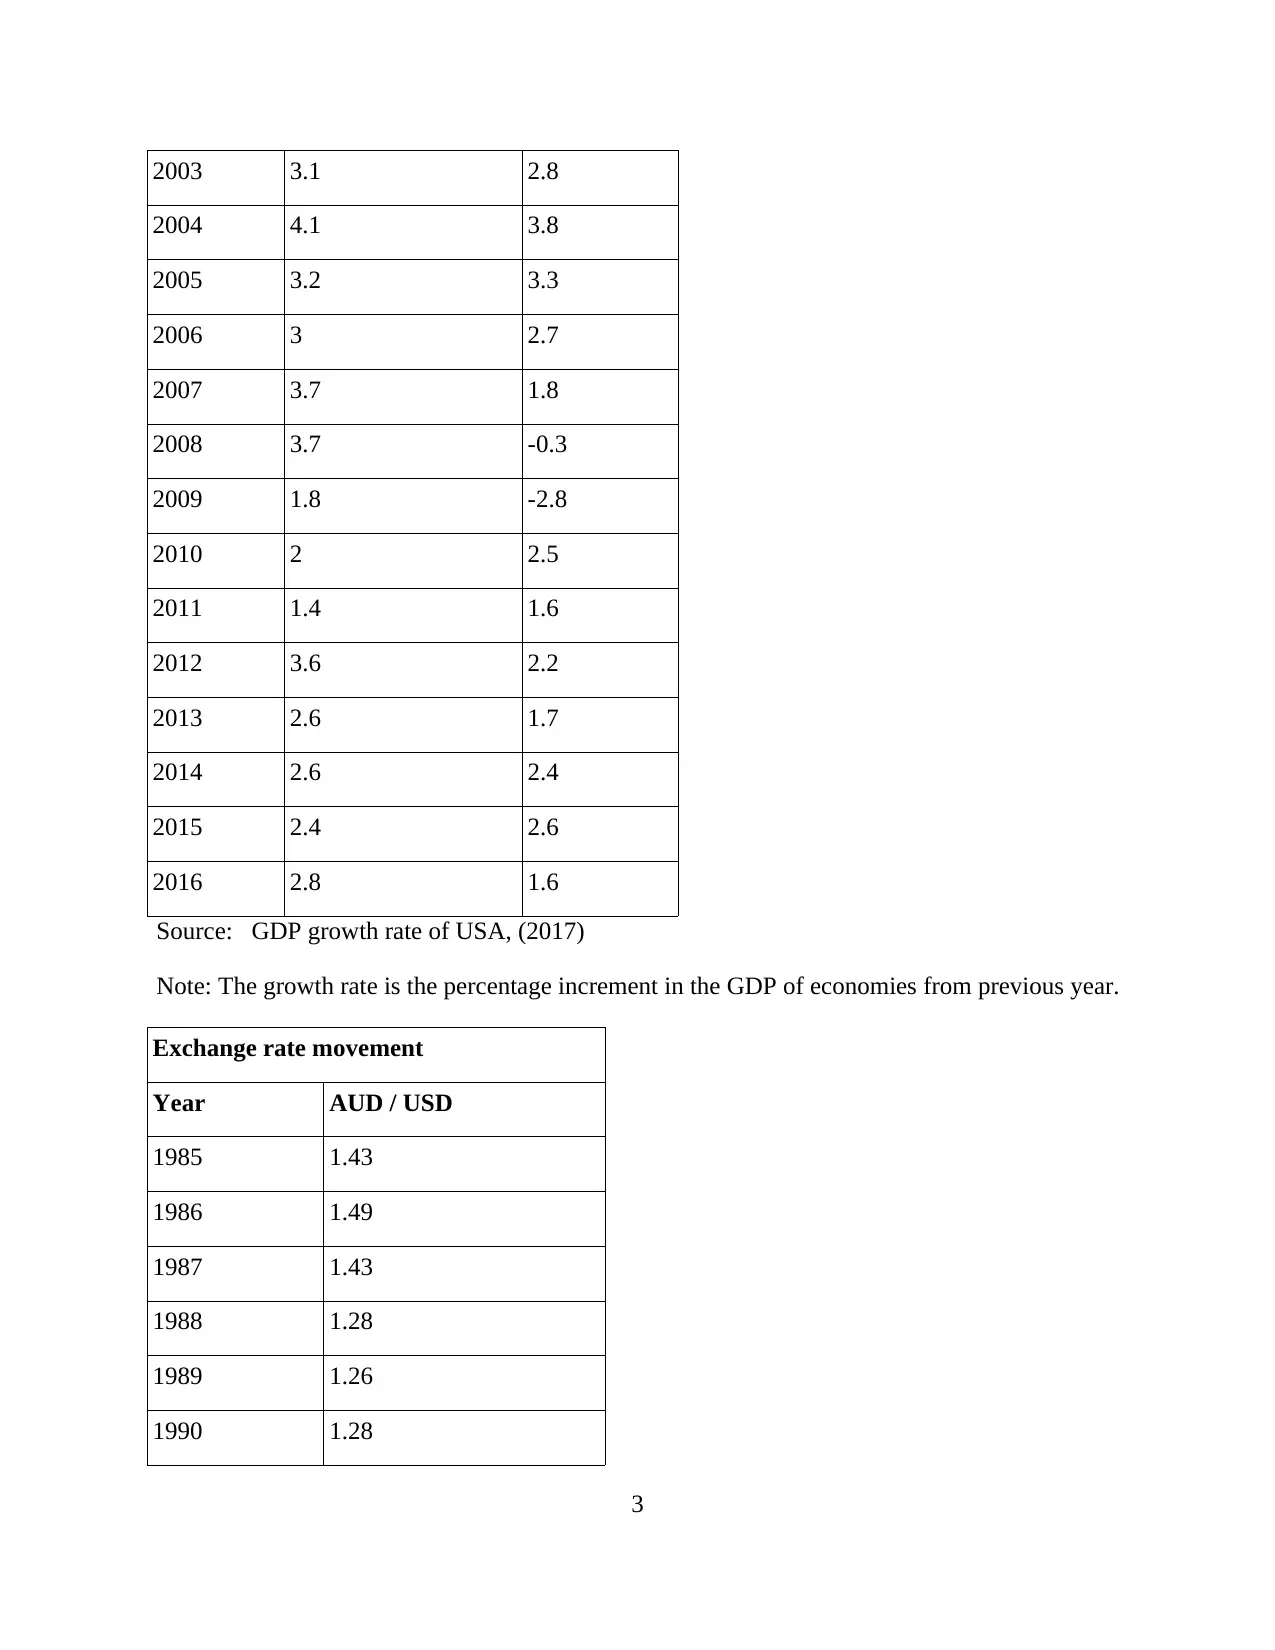
2003 3.1 2.8
2004 4.1 3.8
2005 3.2 3.3
2006 3 2.7
2007 3.7 1.8
2008 3.7 -0.3
2009 1.8 -2.8
2010 2 2.5
2011 1.4 1.6
2012 3.6 2.2
2013 2.6 1.7
2014 2.6 2.4
2015 2.4 2.6
2016 2.8 1.6
Source: GDP growth rate of USA, (2017)
Note: The growth rate is the percentage increment in the GDP of economies from previous year.
Exchange rate movement
Year AUD / USD
1985 1.43
1986 1.49
1987 1.43
1988 1.28
1989 1.26
1990 1.28
3
1991 1.28
1992 1.36
1993 1.47
1994 1.37
1995 1.35
1996 1.28
1997 1.35
1998 1.59
1999 1.55
2000 1.73
2001 1.93
2002 1.84
2003 1.54
2004 1.36
2005 1.31
2006 1.33
2007 1.19
2008 1.19
2009 1.28
2010 1.09
2011 0.97
2012 0.97
2013 1.04
2014 1.11
4
1992 1.36
1993 1.47
1994 1.37
1995 1.35
1996 1.28
1997 1.35
1998 1.59
1999 1.55
2000 1.73
2001 1.93
2002 1.84
2003 1.54
2004 1.36
2005 1.31
2006 1.33
2007 1.19
2008 1.19
2009 1.28
2010 1.09
2011 0.97
2012 0.97
2013 1.04
2014 1.11
4
⊘ This is a preview!⊘
Do you want full access?
Subscribe today to unlock all pages.
Trusted by 1+ million students worldwide
2015 1.33
2016 1.34
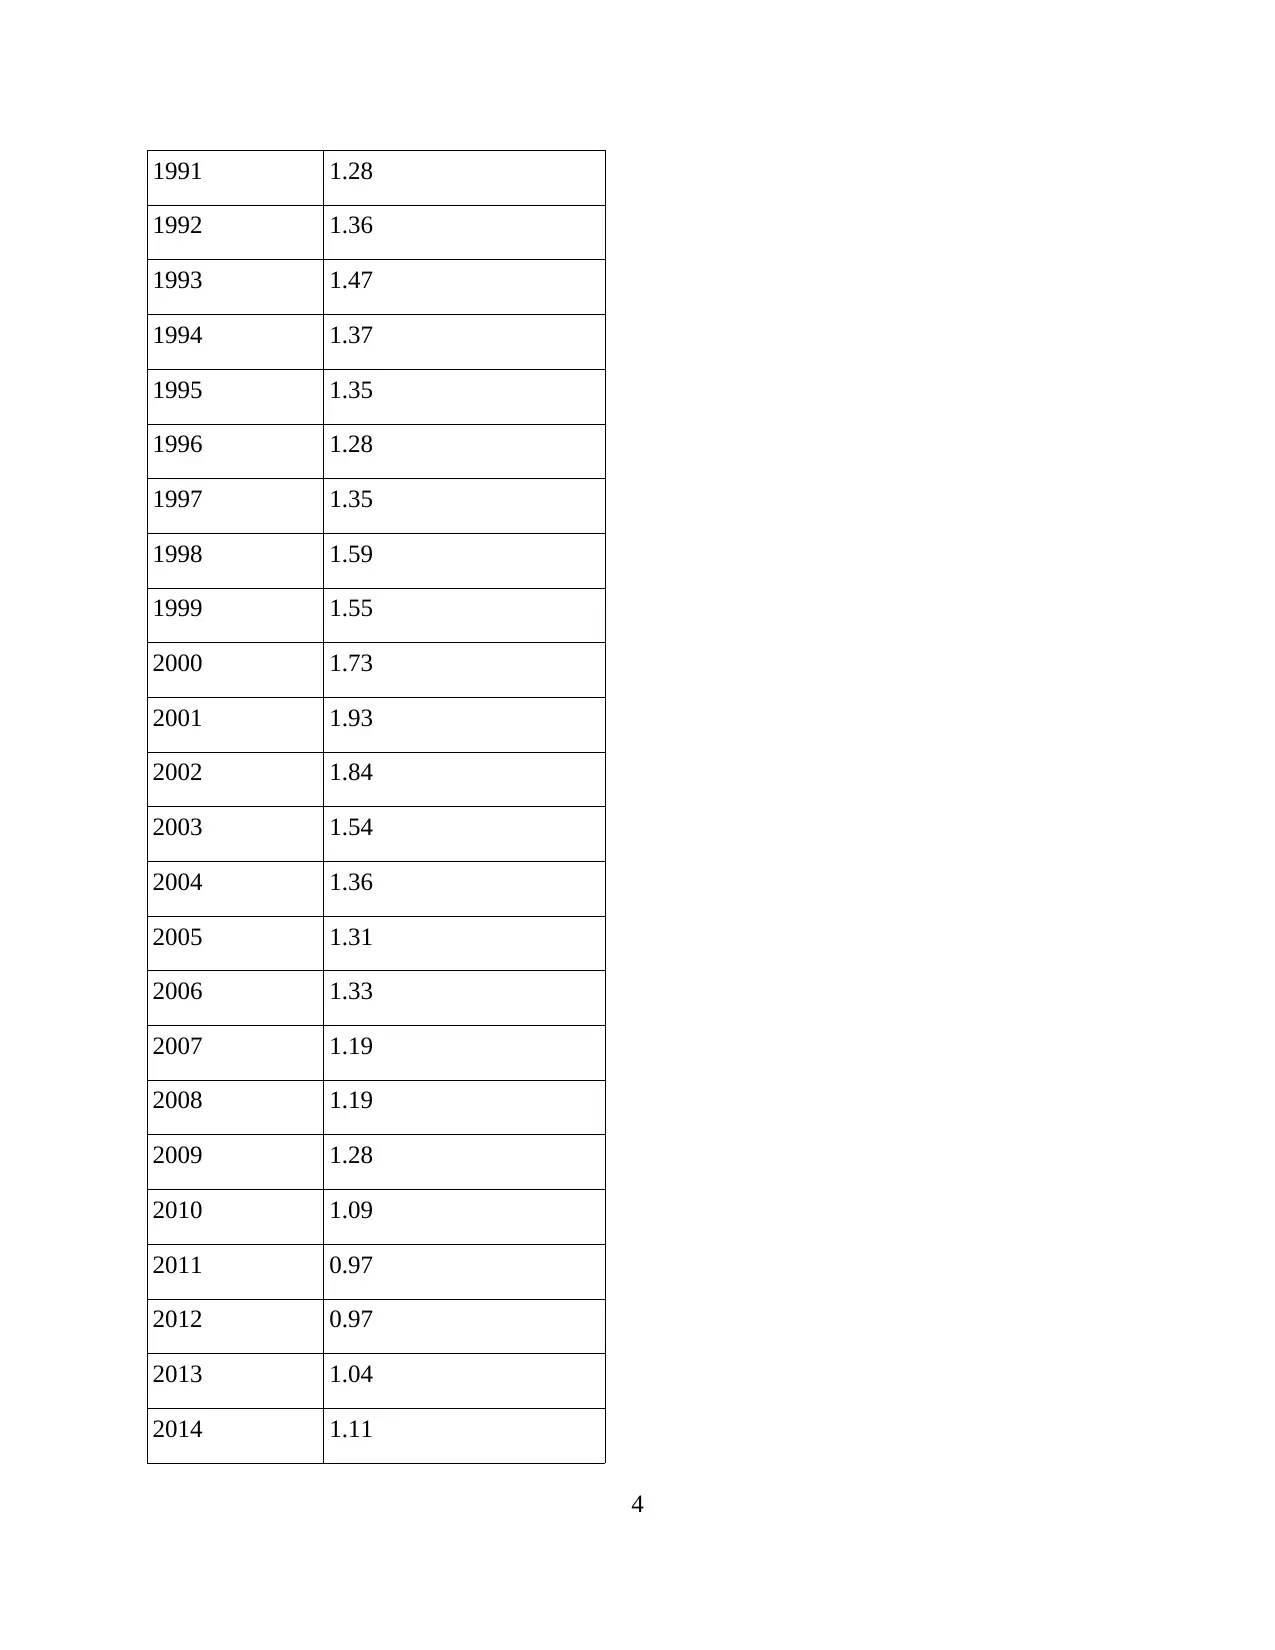
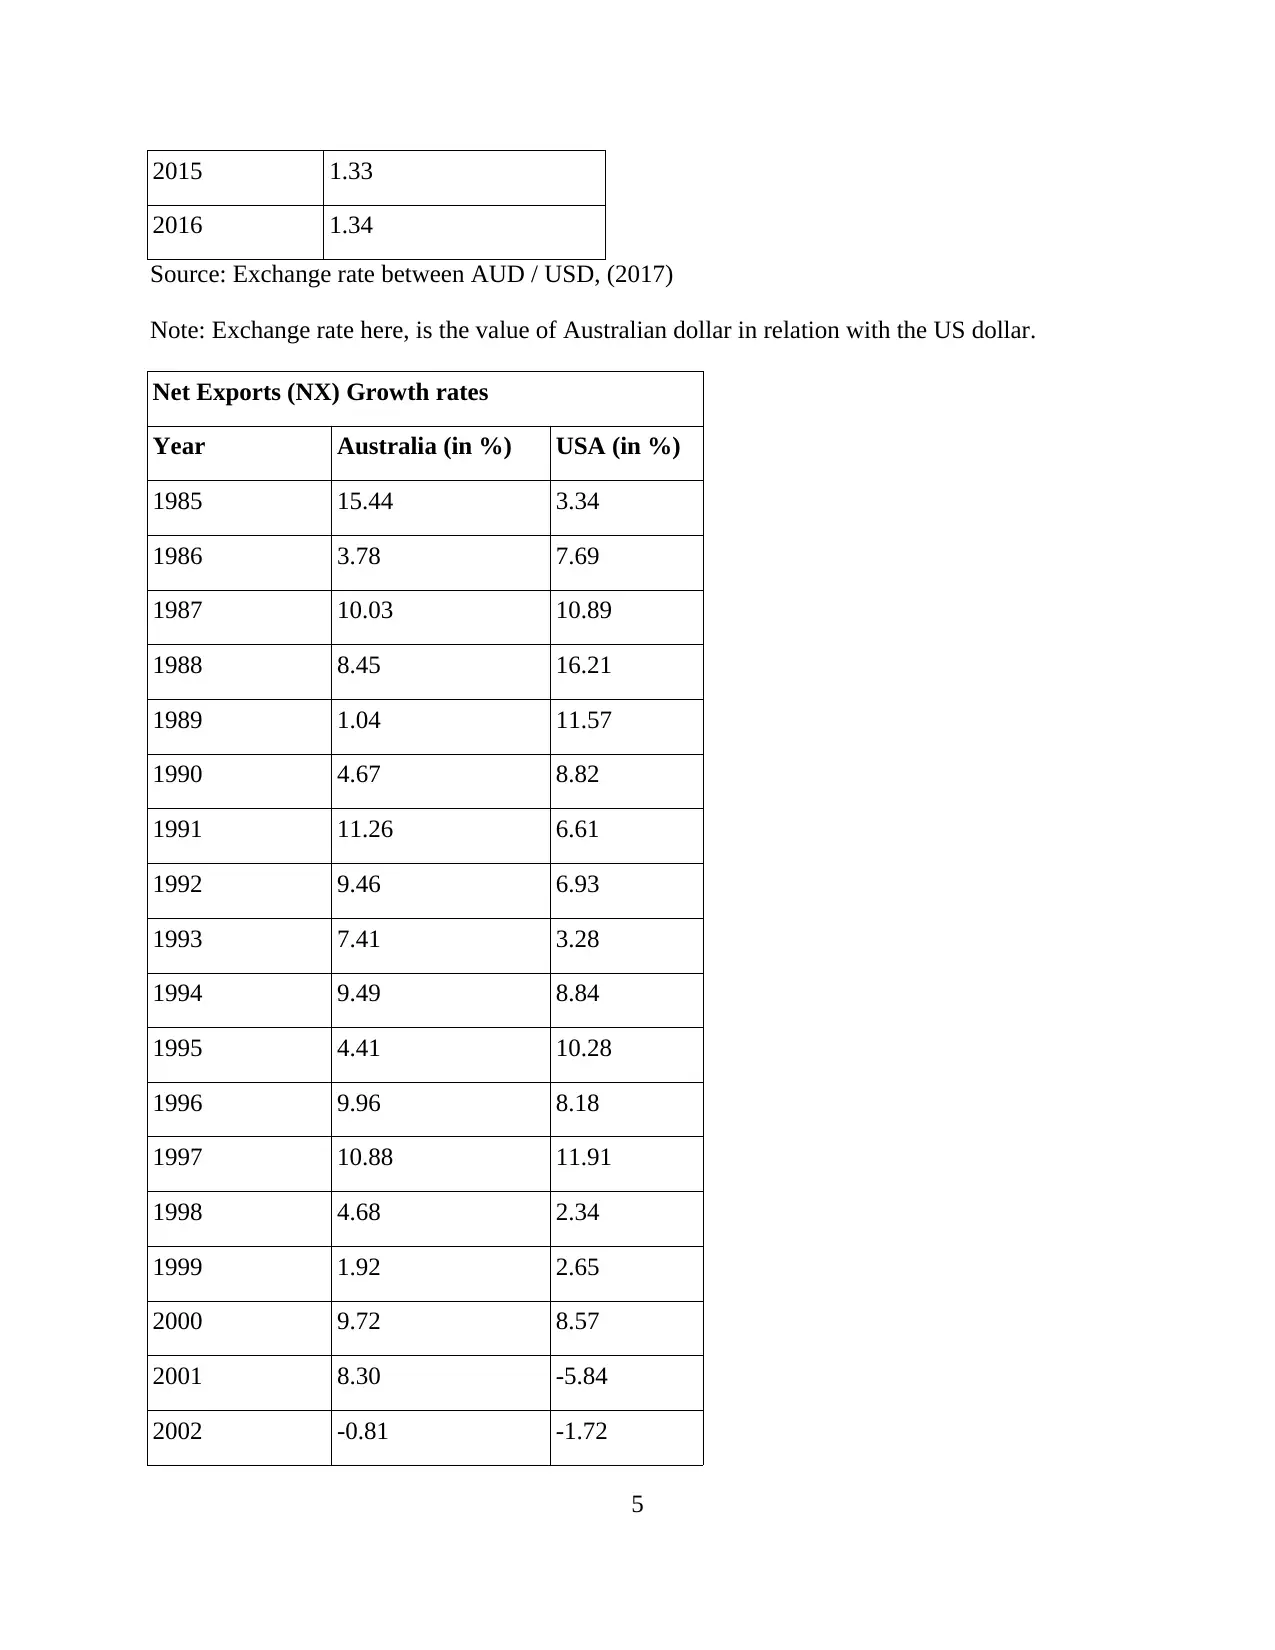
Source: Exchange rate between AUD / USD, (2017)
Note: Exchange rate here, is the value of Australian dollar in relation with the US dollar.
Net Exports (NX) Growth rates
Year Australia (in %) USA (in %)
1985 15.44 3.34
1986 3.78 7.69
1987 10.03 10.89
1988 8.45 16.21
1989 1.04 11.57
1990 4.67 8.82
1991 11.26 6.61
1992 9.46 6.93
1993 7.41 3.28
1994 9.49 8.84
1995 4.41 10.28
1996 9.96 8.18
1997 10.88 11.91
1998 4.68 2.34
1999 1.92 2.65
2000 9.72 8.57
2001 8.30 -5.84
2002 -0.81 -1.72
5
2016 1.34
Source: Exchange rate between AUD / USD, (2017)
Note: Exchange rate here, is the value of Australian dollar in relation with the US dollar.
Net Exports (NX) Growth rates
Year Australia (in %) USA (in %)
1985 15.44 3.34
1986 3.78 7.69
1987 10.03 10.89
1988 8.45 16.21
1989 1.04 11.57
1990 4.67 8.82
1991 11.26 6.61
1992 9.46 6.93
1993 7.41 3.28
1994 9.49 8.84
1995 4.41 10.28
1996 9.96 8.18
1997 10.88 11.91
1998 4.68 2.34
1999 1.92 2.65
2000 9.72 8.57
2001 8.30 -5.84
2002 -0.81 -1.72
5
Paraphrase This Document
Need a fresh take? Get an instant paraphrase of this document with our AI Paraphraser
2003 0.20 1.76
2004 1.21 9.75
2005 3.34 6.25
2006 2.55 9.04
2007 3.89 9.27
2008 3.55 5.74
2009 1.75 -8.79
2010 5.14 11.90
2011 0.93 6.85
2012 5.01 3.42
2013 5.36 3.48
2014 5.97 4.27
2015 6.68 0.11
2016 6.67
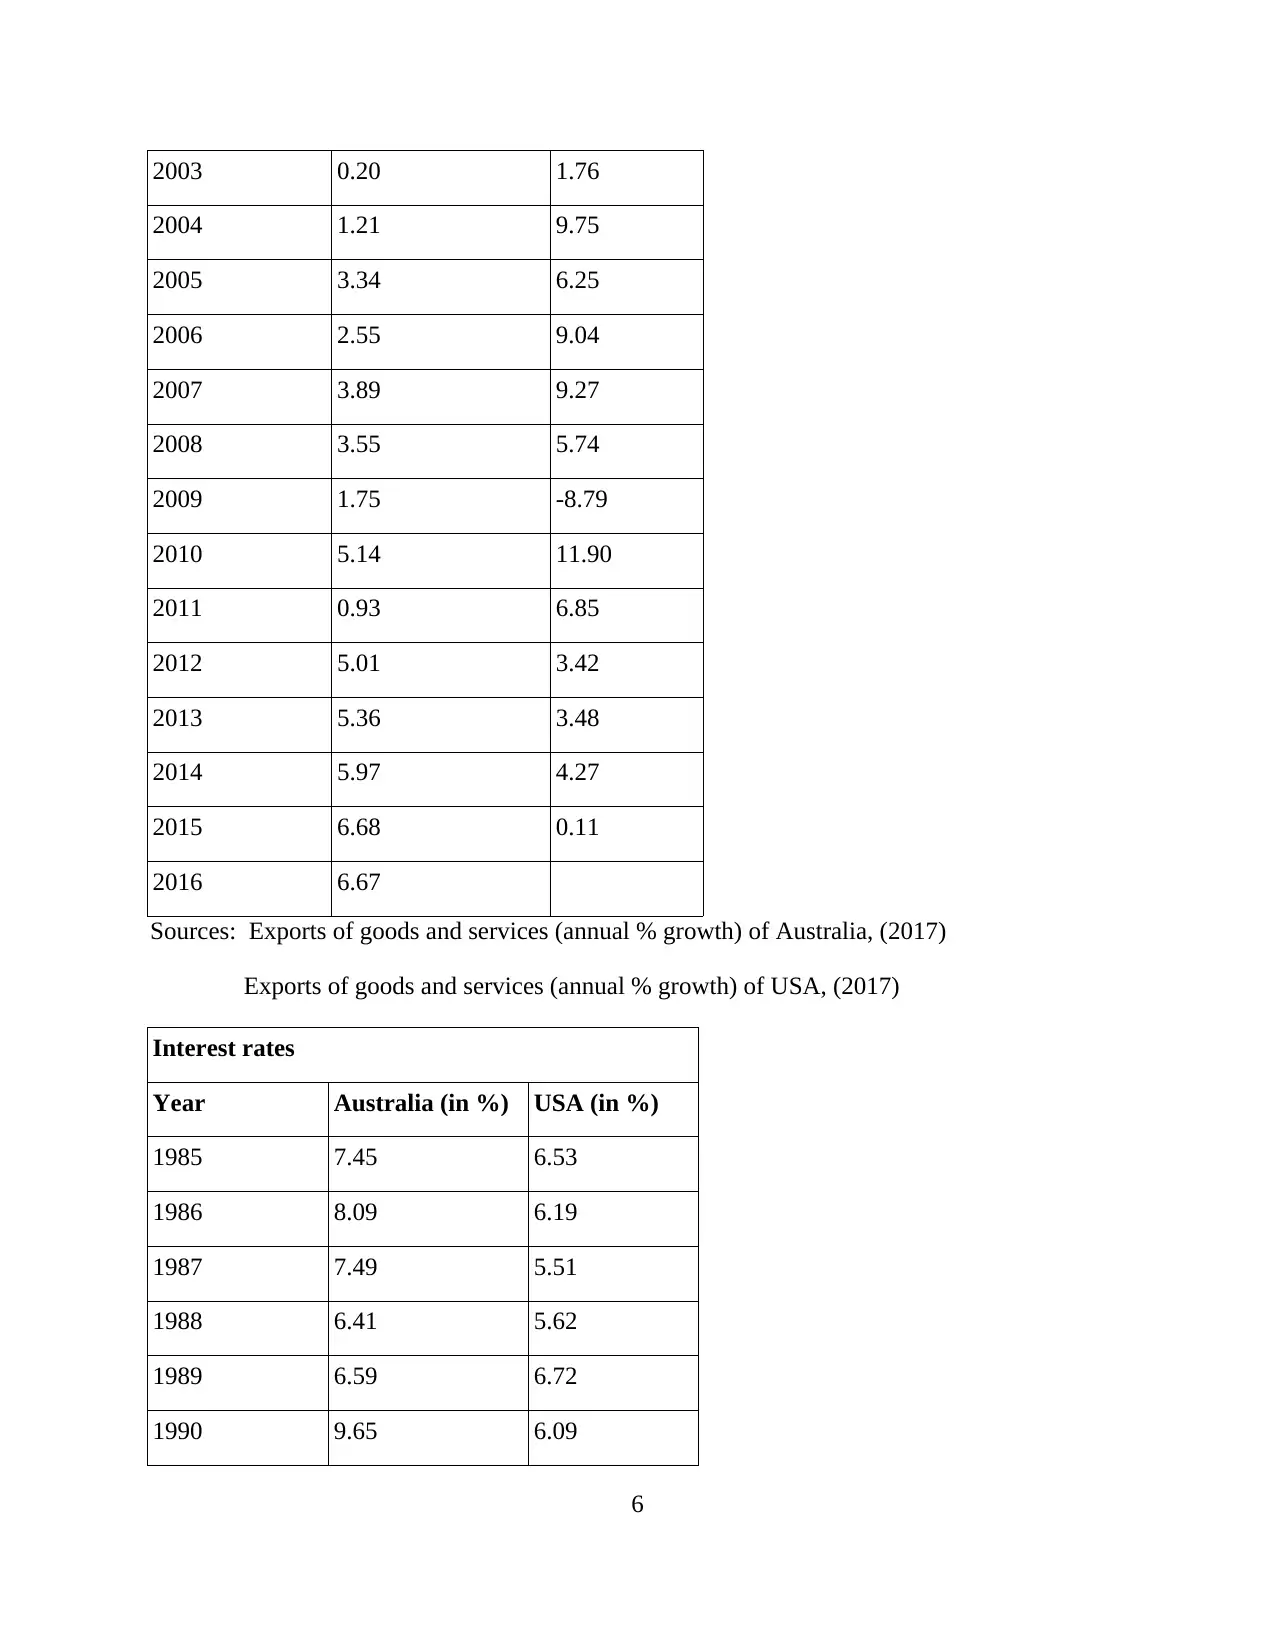
Sources: Exports of goods and services (annual % growth) of Australia, (2017)
Exports of goods and services (annual % growth) of USA, (2017)
Interest rates
Year Australia (in %) USA (in %)
1985 7.45 6.53
1986 8.09 6.19
1987 7.49 5.51
1988 6.41 5.62
1989 6.59 6.72
1990 9.65 6.09
6
2004 1.21 9.75
2005 3.34 6.25
2006 2.55 9.04
2007 3.89 9.27
2008 3.55 5.74
2009 1.75 -8.79
2010 5.14 11.90
2011 0.93 6.85
2012 5.01 3.42
2013 5.36 3.48
2014 5.97 4.27
2015 6.68 0.11
2016 6.67
Sources: Exports of goods and services (annual % growth) of Australia, (2017)
Exports of goods and services (annual % growth) of USA, (2017)
Interest rates
Year Australia (in %) USA (in %)
1985 7.45 6.53
1986 8.09 6.19
1987 7.49 5.51
1988 6.41 5.62
1989 6.59 6.72
1990 9.65 6.09
6
1991 10.07 4.97
1992 8.95 3.88
1993 8.47 3.54
1994 8.01 4.91
1995 8.10 6.61
1996 6.86 6.33
1997 5.87 6.62
1998 5.34 7.19
1999 6.21 6.37
2000 5.03 6.80
2001 2.04 4.54
2002 3.40 3.09
2003 3.39 2.09
2004 3.65 1.55
2005 3.42 2.88
2006 2.43 4.74
2007 3.07 5.25
2008 4.18 3.07
2009 1.04 2.47
2010 6.21 2.00
2011 1.46 1.16
2012 4.82 1.38
2013 6.36 1.61
2014 4.45 1.43
7
⊘ This is a preview!⊘
Do you want full access?
Subscribe today to unlock all pages.
Trusted by 1+ million students worldwide
2015 6.32 2.16
2016 5.86 2.168
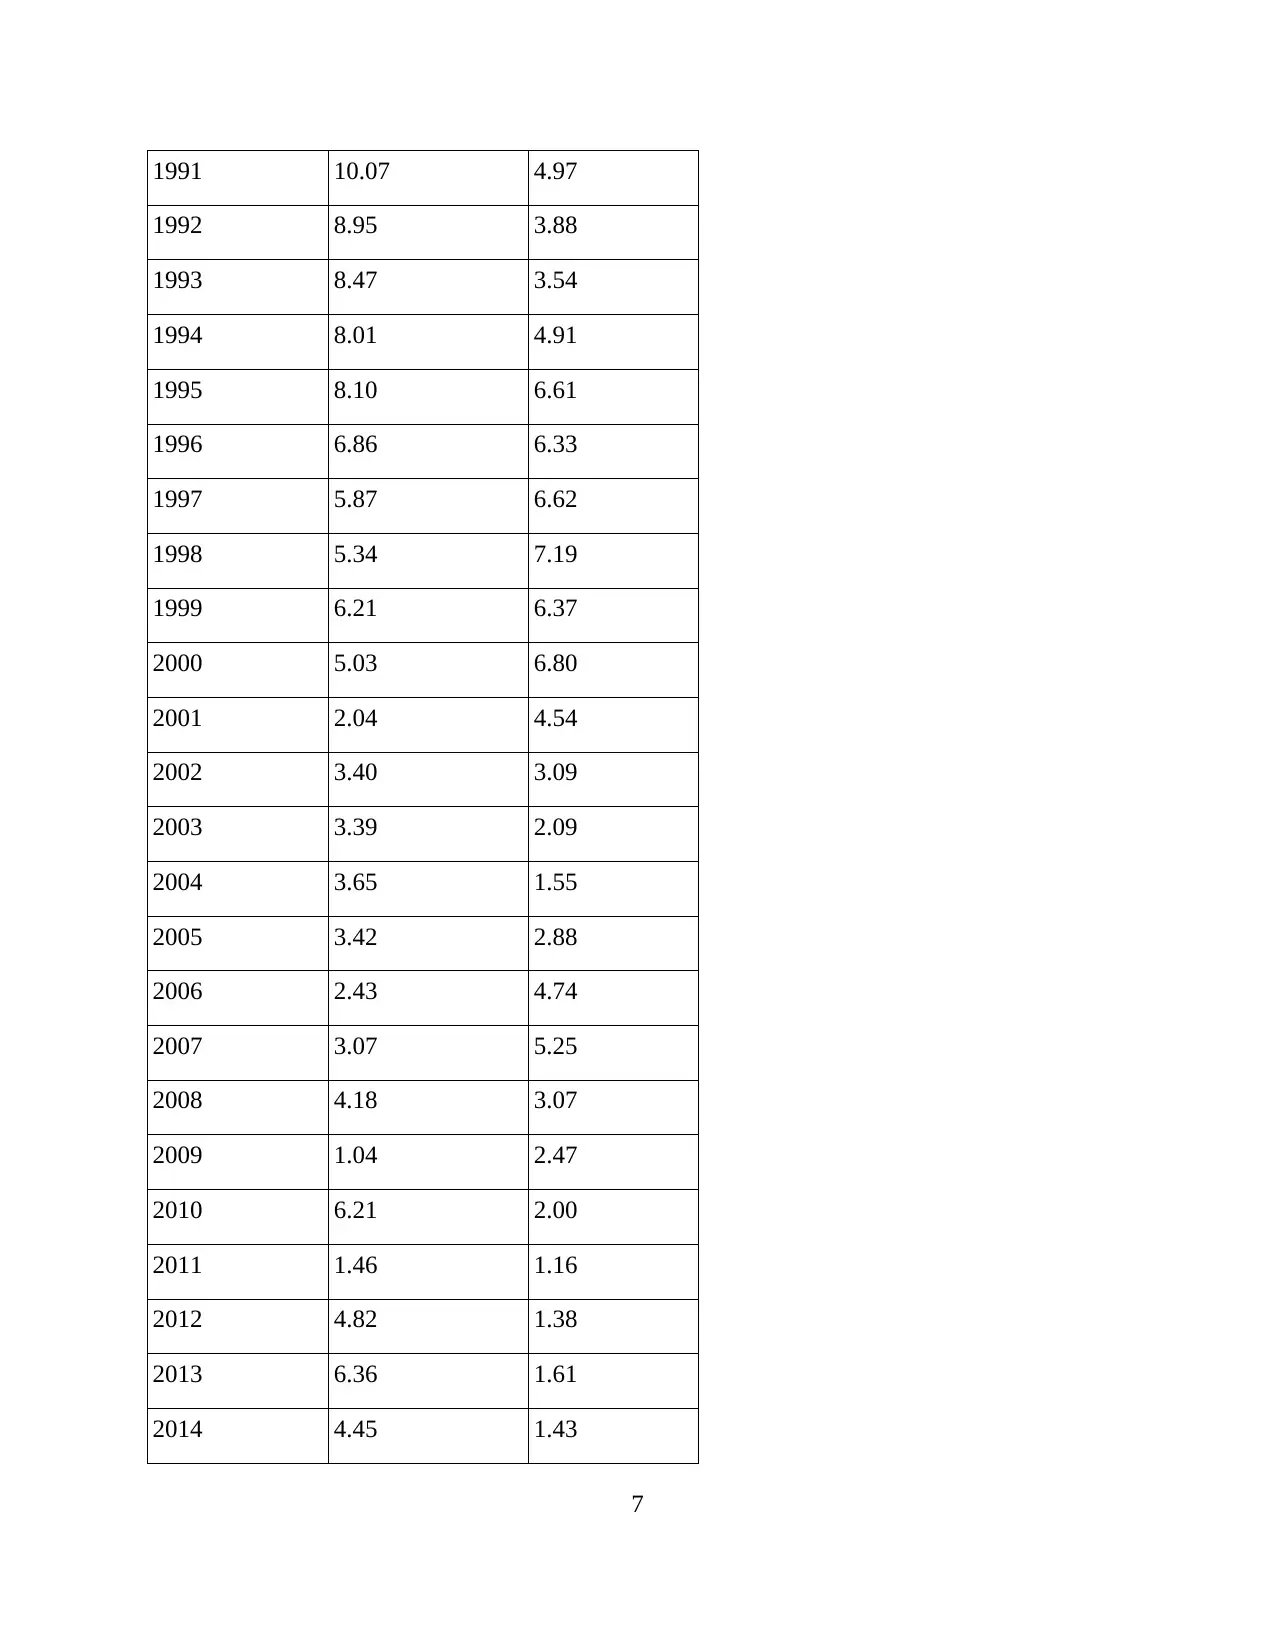
Sources: Real interest rate (%) of Australia, (2017)
Real interest rate (%) of USA, (2017)
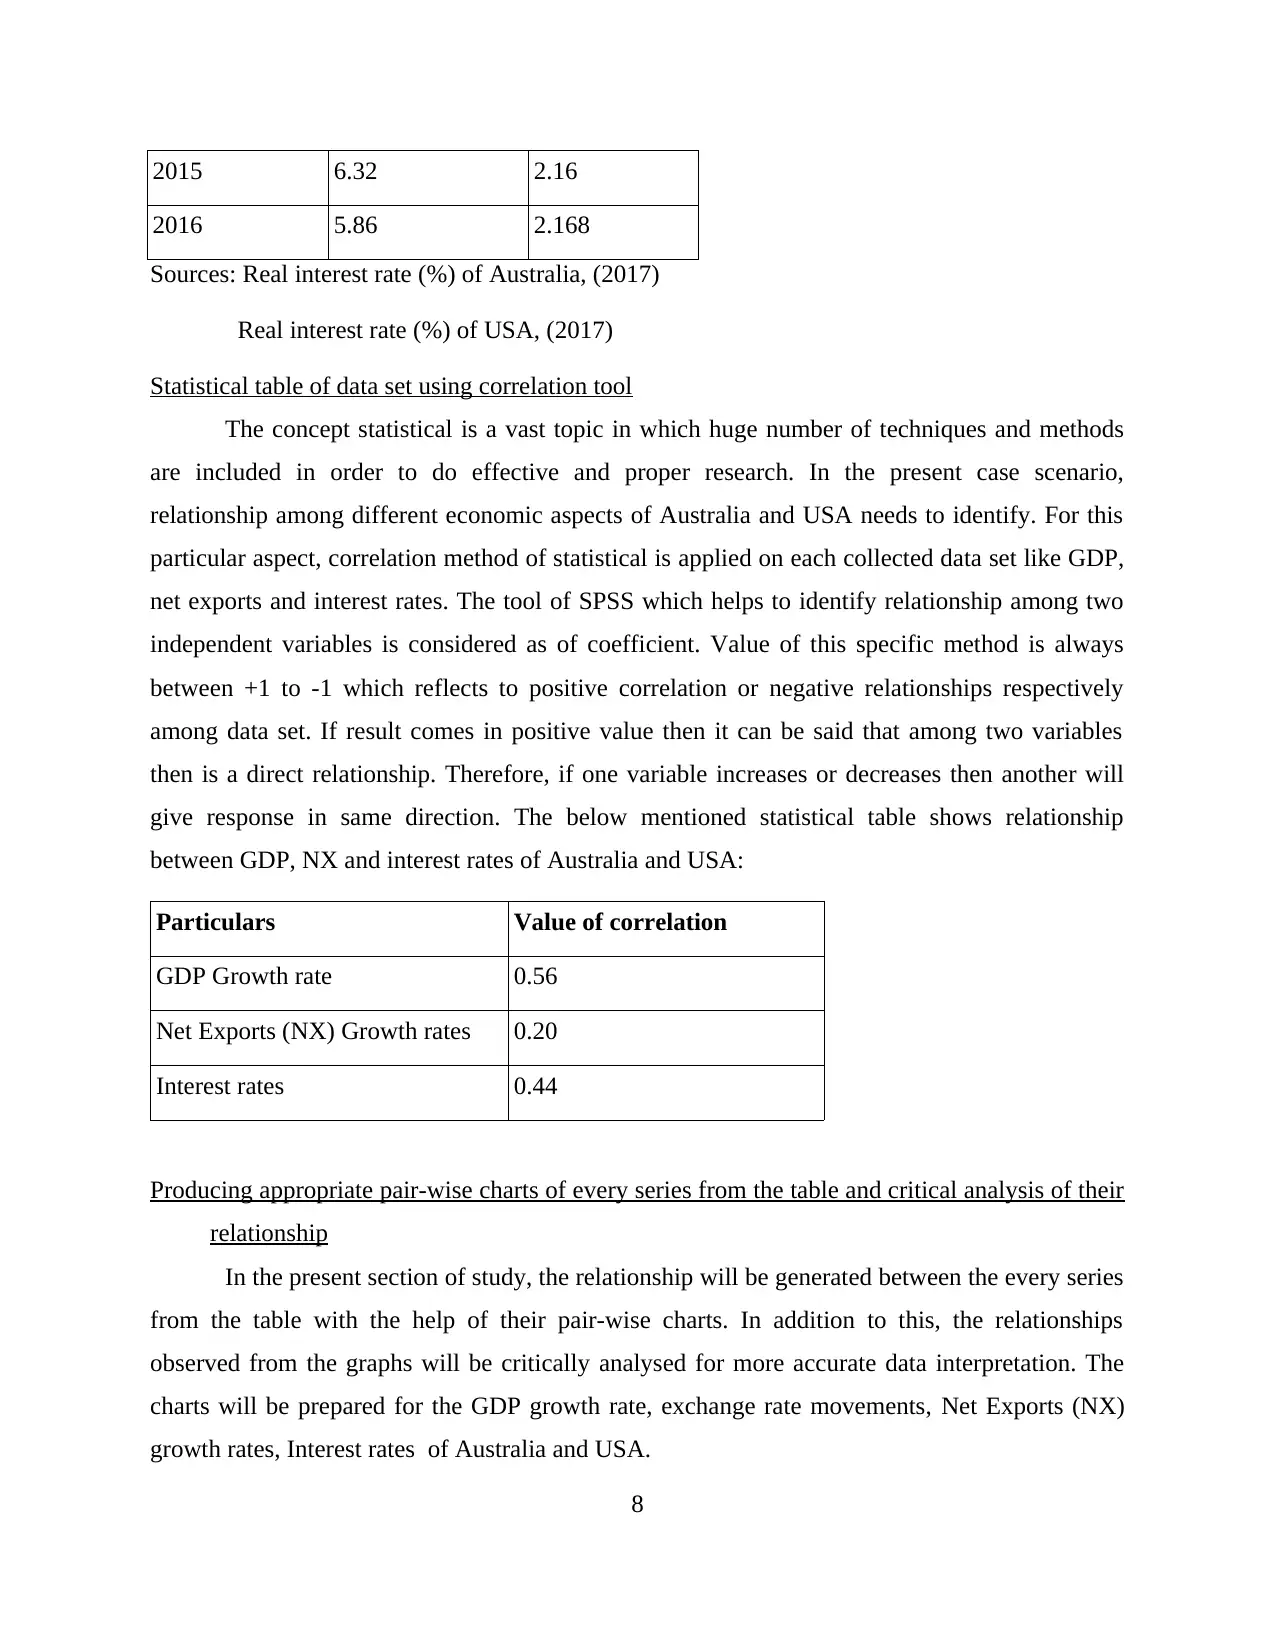
Statistical table of data set using correlation tool
The concept statistical is a vast topic in which huge number of techniques and methods
are included in order to do effective and proper research. In the present case scenario,
relationship among different economic aspects of Australia and USA needs to identify. For this
particular aspect, correlation method of statistical is applied on each collected data set like GDP,
net exports and interest rates. The tool of SPSS which helps to identify relationship among two
independent variables is considered as of coefficient. Value of this specific method is always
between +1 to -1 which reflects to positive correlation or negative relationships respectively
among data set. If result comes in positive value then it can be said that among two variables
then is a direct relationship. Therefore, if one variable increases or decreases then another will
give response in same direction. The below mentioned statistical table shows relationship
between GDP, NX and interest rates of Australia and USA:
Particulars Value of correlation
GDP Growth rate 0.56
Net Exports (NX) Growth rates 0.20
Interest rates 0.44
Producing appropriate pair-wise charts of every series from the table and critical analysis of their
relationship
In the present section of study, the relationship will be generated between the every series
from the table with the help of their pair-wise charts. In addition to this, the relationships
observed from the graphs will be critically analysed for more accurate data interpretation. The
charts will be prepared for the GDP growth rate, exchange rate movements, Net Exports (NX)
growth rates, Interest rates of Australia and USA.
8
2016 5.86 2.168
Sources: Real interest rate (%) of Australia, (2017)
Real interest rate (%) of USA, (2017)
Statistical table of data set using correlation tool
The concept statistical is a vast topic in which huge number of techniques and methods
are included in order to do effective and proper research. In the present case scenario,
relationship among different economic aspects of Australia and USA needs to identify. For this
particular aspect, correlation method of statistical is applied on each collected data set like GDP,
net exports and interest rates. The tool of SPSS which helps to identify relationship among two
independent variables is considered as of coefficient. Value of this specific method is always
between +1 to -1 which reflects to positive correlation or negative relationships respectively
among data set. If result comes in positive value then it can be said that among two variables
then is a direct relationship. Therefore, if one variable increases or decreases then another will
give response in same direction. The below mentioned statistical table shows relationship
between GDP, NX and interest rates of Australia and USA:
Particulars Value of correlation
GDP Growth rate 0.56
Net Exports (NX) Growth rates 0.20
Interest rates 0.44
Producing appropriate pair-wise charts of every series from the table and critical analysis of their
relationship
In the present section of study, the relationship will be generated between the every series
from the table with the help of their pair-wise charts. In addition to this, the relationships
observed from the graphs will be critically analysed for more accurate data interpretation. The
charts will be prepared for the GDP growth rate, exchange rate movements, Net Exports (NX)
growth rates, Interest rates of Australia and USA.
8
Paraphrase This Document
Need a fresh take? Get an instant paraphrase of this document with our AI Paraphraser
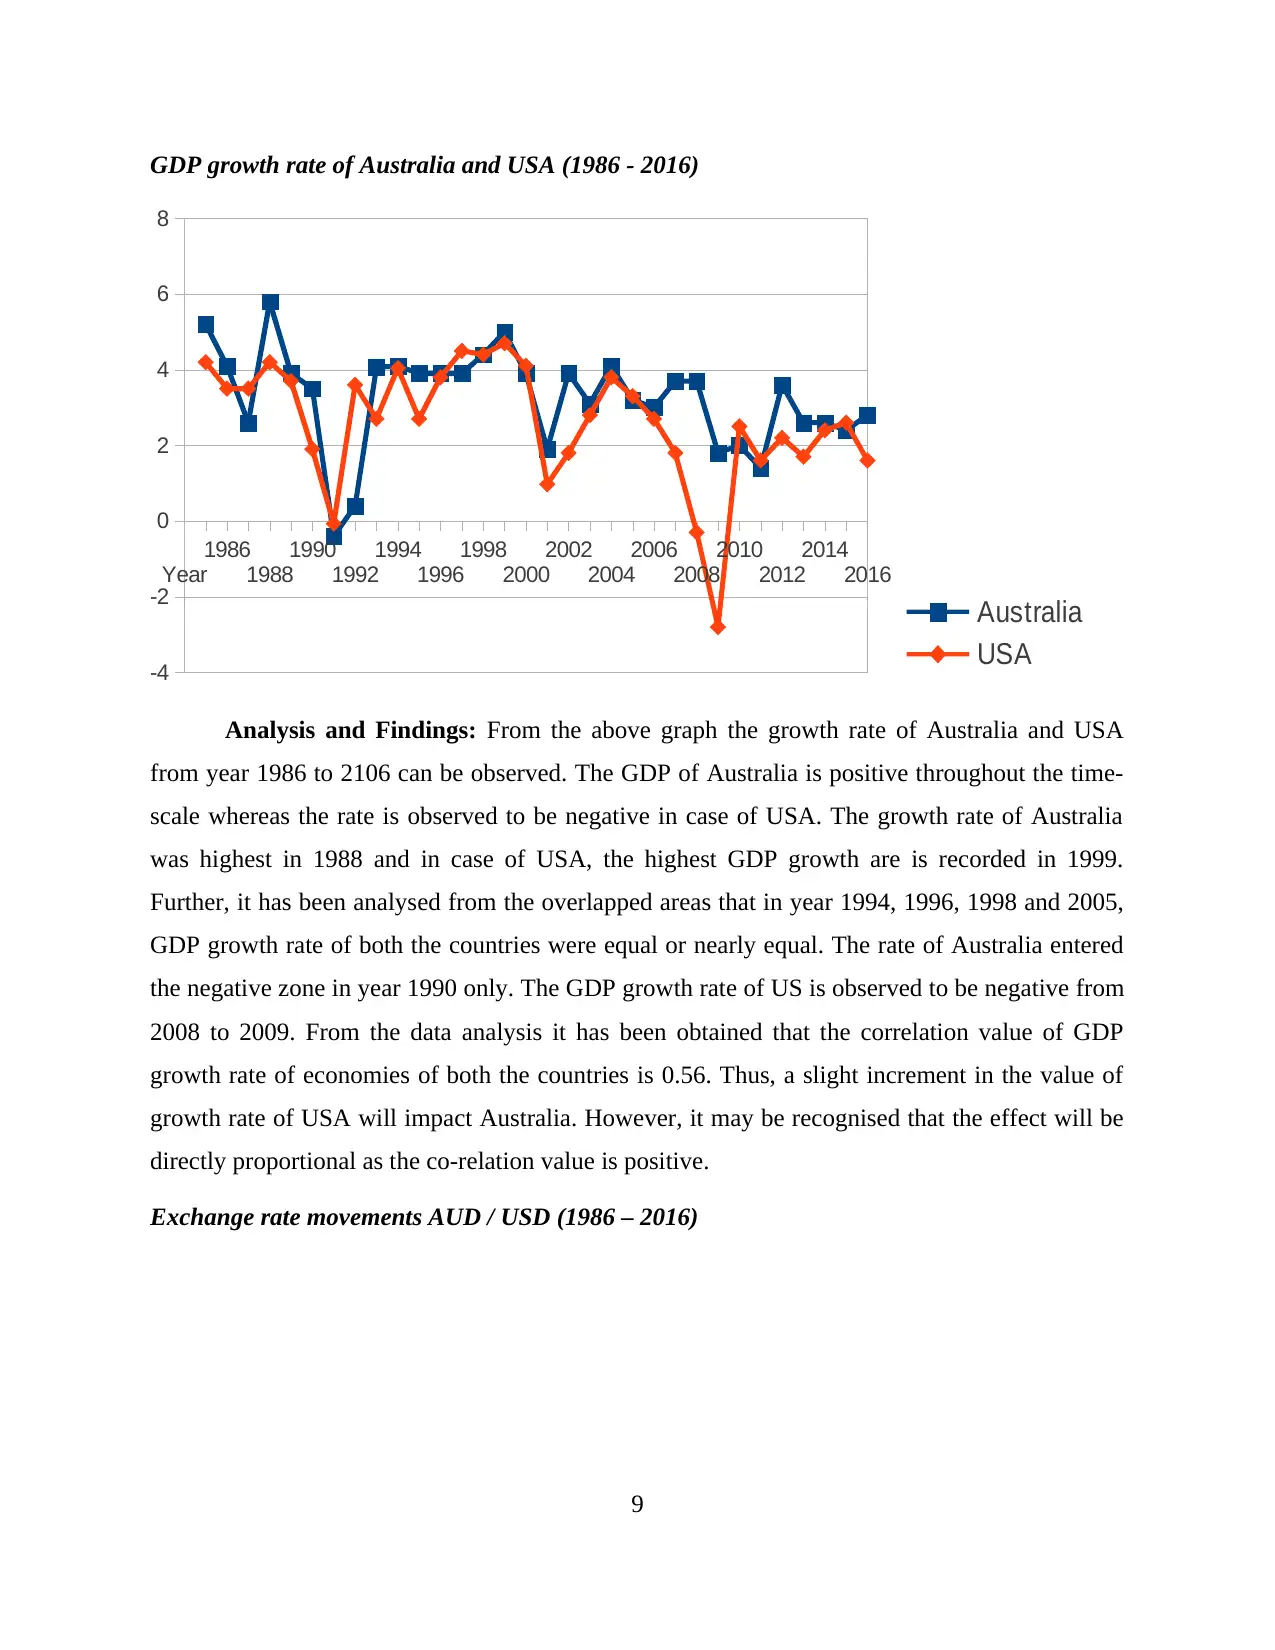
GDP growth rate of Australia and USA (1986 - 2016)
Year
1986
1988
1990
1992
1994
1996
1998
2000
2002
2004
2006
2008
2010
2012
2014
2016
-4
-2
0
2
4
6
8
Australia
USA
Analysis and Findings: From the above graph the growth rate of Australia and USA
from year 1986 to 2106 can be observed. The GDP of Australia is positive throughout the time-
scale whereas the rate is observed to be negative in case of USA. The growth rate of Australia
was highest in 1988 and in case of USA, the highest GDP growth are is recorded in 1999.
Further, it has been analysed from the overlapped areas that in year 1994, 1996, 1998 and 2005,
GDP growth rate of both the countries were equal or nearly equal. The rate of Australia entered
the negative zone in year 1990 only. The GDP growth rate of US is observed to be negative from
2008 to 2009. From the data analysis it has been obtained that the correlation value of GDP
growth rate of economies of both the countries is 0.56. Thus, a slight increment in the value of
growth rate of USA will impact Australia. However, it may be recognised that the effect will be
directly proportional as the co-relation value is positive.
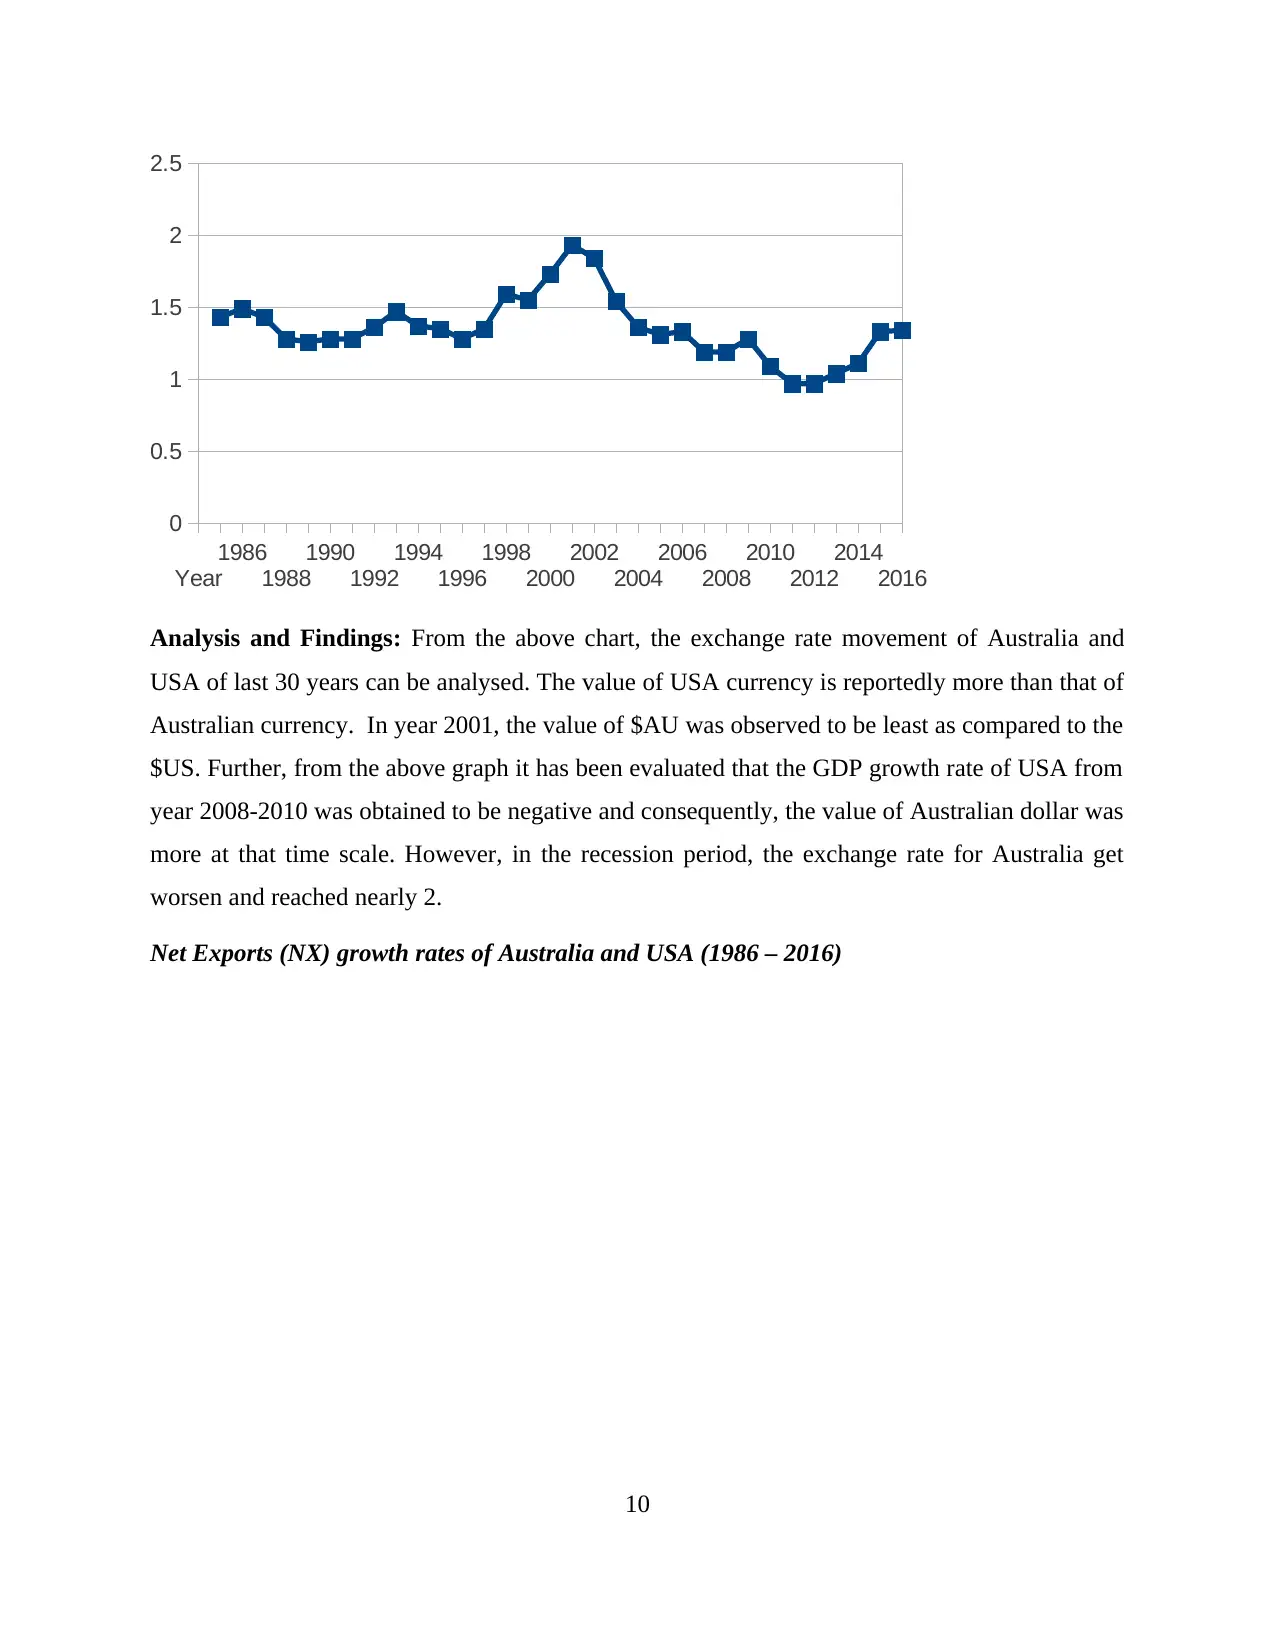
Exchange rate movements AUD / USD (1986 – 2016)
9
Year
1986
1988
1990
1992
1994
1996
1998
2000
2002
2004
2006
2008
2010
2012
2014
2016
-4
-2
0
2
4
6
8
Australia
USA
Analysis and Findings: From the above graph the growth rate of Australia and USA
from year 1986 to 2106 can be observed. The GDP of Australia is positive throughout the time-
scale whereas the rate is observed to be negative in case of USA. The growth rate of Australia
was highest in 1988 and in case of USA, the highest GDP growth are is recorded in 1999.
Further, it has been analysed from the overlapped areas that in year 1994, 1996, 1998 and 2005,
GDP growth rate of both the countries were equal or nearly equal. The rate of Australia entered
the negative zone in year 1990 only. The GDP growth rate of US is observed to be negative from
2008 to 2009. From the data analysis it has been obtained that the correlation value of GDP
growth rate of economies of both the countries is 0.56. Thus, a slight increment in the value of
growth rate of USA will impact Australia. However, it may be recognised that the effect will be
directly proportional as the co-relation value is positive.
Exchange rate movements AUD / USD (1986 – 2016)
9
Year
1986
1988
1990
1992
1994
1996
1998
2000
2002
2004
2006
2008
2010
2012
2014
2016
0
0.5
1
1.5
2
2.5
Analysis and Findings: From the above chart, the exchange rate movement of Australia and
USA of last 30 years can be analysed. The value of USA currency is reportedly more than that of
Australian currency. In year 2001, the value of $AU was observed to be least as compared to the
$US. Further, from the above graph it has been evaluated that the GDP growth rate of USA from
year 2008-2010 was obtained to be negative and consequently, the value of Australian dollar was
more at that time scale. However, in the recession period, the exchange rate for Australia get
worsen and reached nearly 2.
Net Exports (NX) growth rates of Australia and USA (1986 – 2016)
10
⊘ This is a preview!⊘
Do you want full access?
Subscribe today to unlock all pages.
Trusted by 1+ million students worldwide
1 out of 15
Related Documents


Your All-in-One AI-Powered Toolkit for Academic Success.
+13062052269
info@desklib.com
Available 24*7 on WhatsApp / Email
![[object Object]](/_next/static/media/star-bottom.7253800d.svg)
Unlock your academic potential
Copyright © 2020–2026 A2Z Services. All Rights Reserved. Developed and managed by ZUCOL.