Analysis of Macroeconomic Policies and International Transactions
VerifiedAdded on 2020/05/28
|23
|3505
|640
Essay
AI Summary
The assignment delves into macroeconomic principles, analyzing how changes in interest rates affect currency demand and supply, particularly focusing on Colombia's rose industry. It calculates the U.S.'s current account balance and capital account for 2008, examining net borrowing or lending status. Additionally, it discusses policies to mitigate excessive reliance on international capital. The essay employs data from Arnold (2015), Salvatore (2016), and Vanita (2010) to support its analysis.
Running Head: BUS103 INTRODUCTION TO MACROECONOMICS 1
BUS103 Introduction to Macroeconomics
Name
Student Number
Institution
Date
Page 1
BUS103 Introduction to Macroeconomics
Name
Student Number
Institution
Date
Page 1
Paraphrase This Document
Need a fresh take? Get an instant paraphrase of this document with our AI Paraphraser
BUS103 INTRODUCTION TO MACROECONOMICS 2
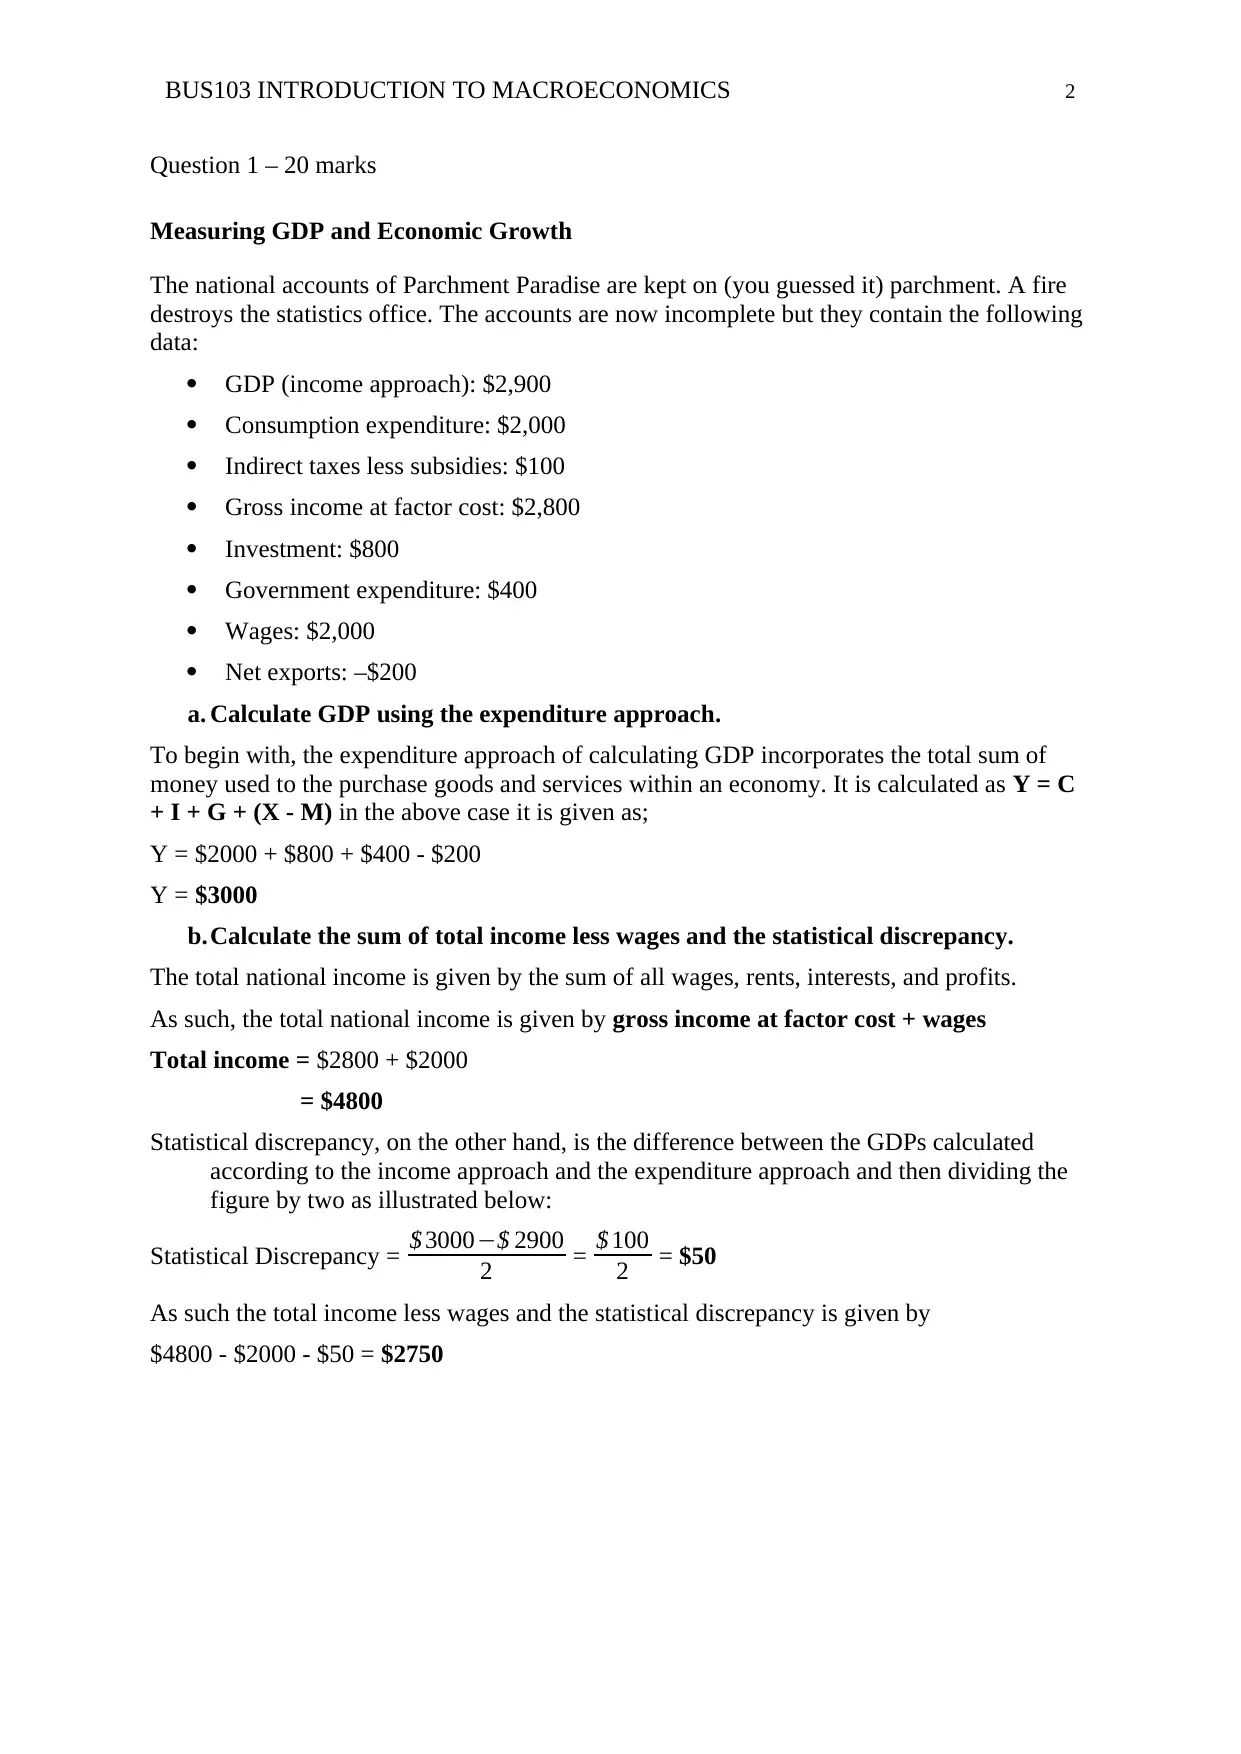
Question 1 – 20 marks
Measuring GDP and Economic Growth
The national accounts of Parchment Paradise are kept on (you guessed it) parchment. A fire
destroys the statistics office. The accounts are now incomplete but they contain the following
data:
GDP (income approach): $2,900
Consumption expenditure: $2,000
Indirect taxes less subsidies: $100
Gross income at factor cost: $2,800
Investment: $800
Government expenditure: $400
Wages: $2,000
Net exports: –$200
a. Calculate GDP using the expenditure approach.
To begin with, the expenditure approach of calculating GDP incorporates the total sum of
money used to the purchase goods and services within an economy. It is calculated as Y = C
+ I + G + (X - M) in the above case it is given as;
Y = $2000 + $800 + $400 - $200
Y = $3000
b.Calculate the sum of total income less wages and the statistical discrepancy.
The total national income is given by the sum of all wages, rents, interests, and profits.
As such, the total national income is given by gross income at factor cost + wages
Total income = $2800 + $2000
= $4800
Statistical discrepancy, on the other hand, is the difference between the GDPs calculated
according to the income approach and the expenditure approach and then dividing the
figure by two as illustrated below:
Statistical Discrepancy = $ 3000−$ 2900
2 = $ 100
2 = $50
As such the total income less wages and the statistical discrepancy is given by
$4800 - $2000 - $50 = $2750
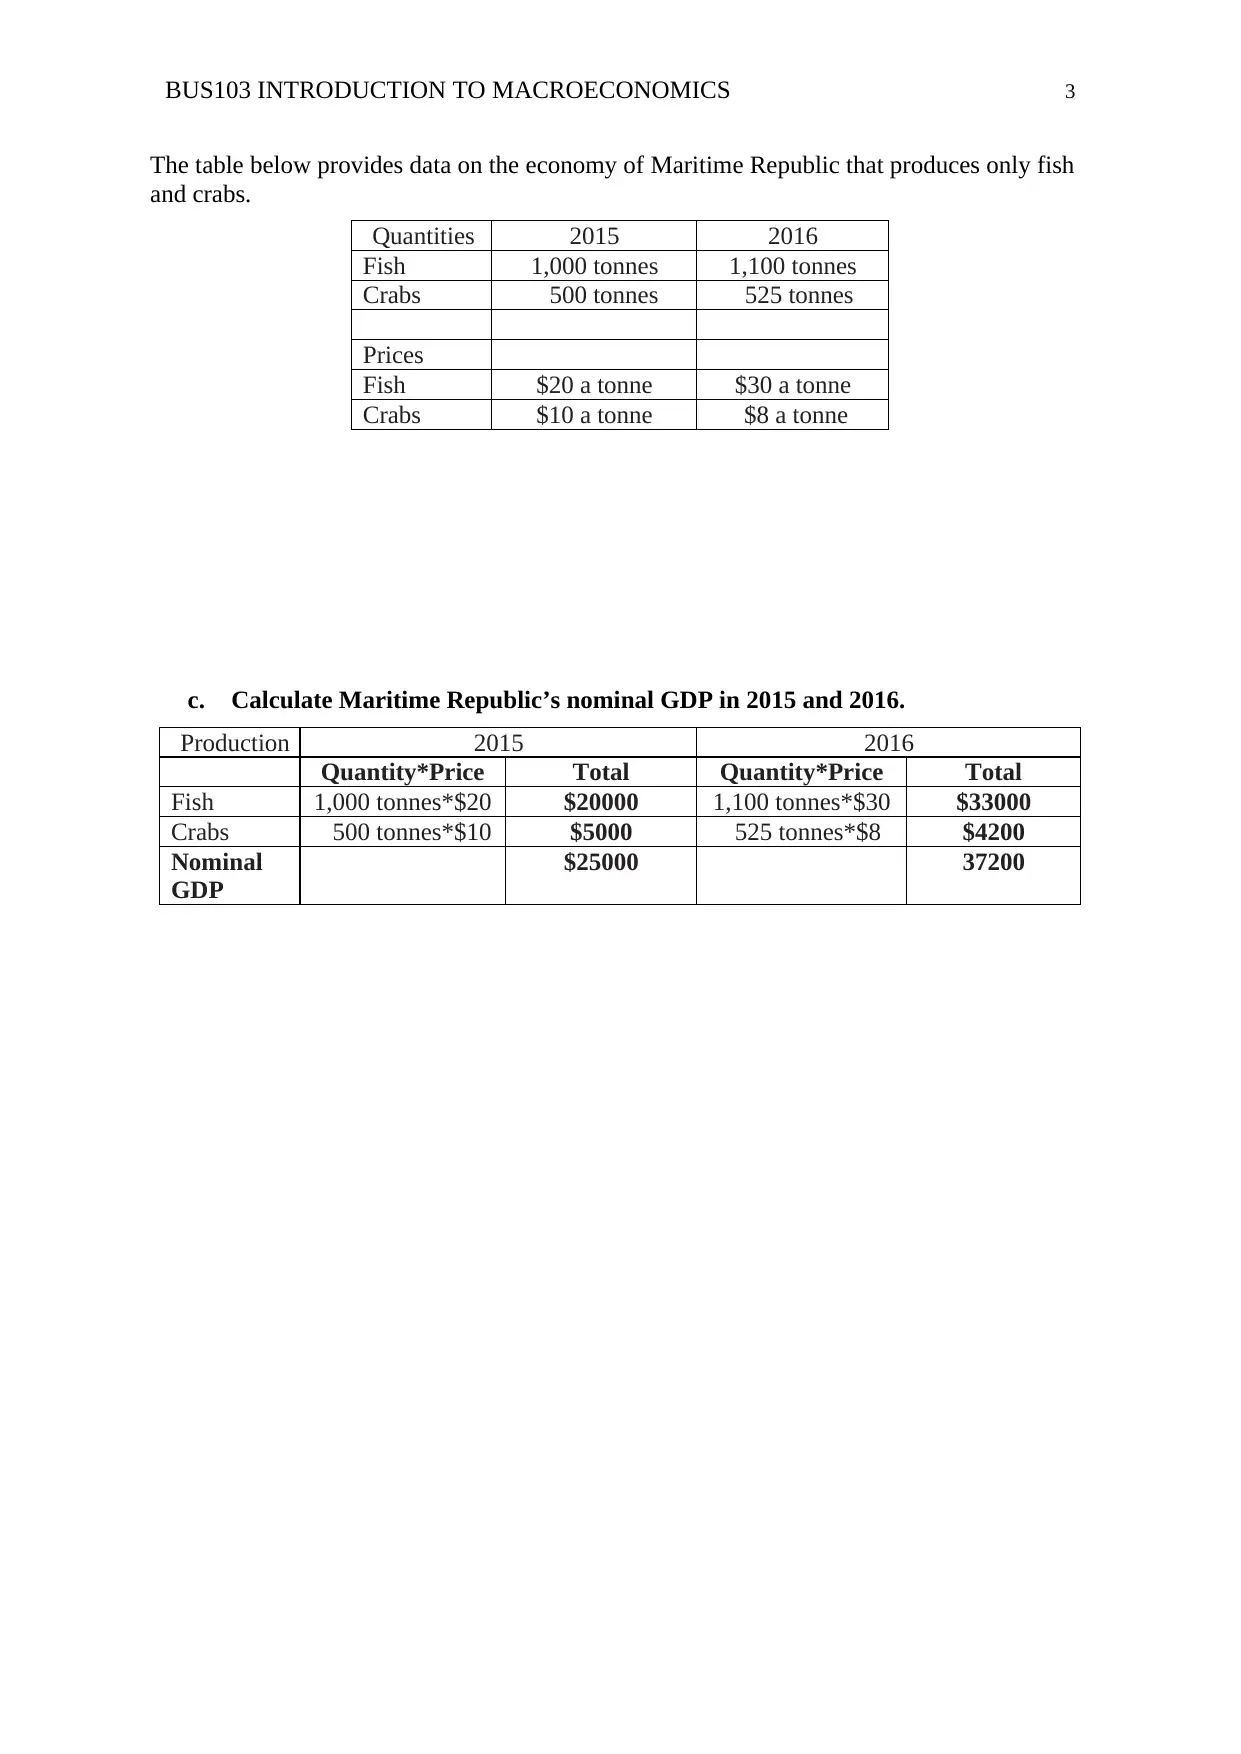
BUS103 INTRODUCTION TO MACROECONOMICS 3
The table below provides data on the economy of Maritime Republic that produces only fish
and crabs.
Quantities 2015 2016
Fish 1,000 tonnes 1,100 tonnes
Crabs 500 tonnes 525 tonnes
Prices
Fish $20 a tonne $30 a tonne
Crabs $10 a tonne $8 a tonne
c. Calculate Maritime Republic’s nominal GDP in 2015 and 2016.
Production 2015 2016
Quantity*Price Total Quantity*Price Total
Fish 1,000 tonnes*$20 $20000 1,100 tonnes*$30 $33000
Crabs 500 tonnes*$10 $5000 525 tonnes*$8 $4200
Nominal
GDP
$25000 37200
⊘ This is a preview!⊘
Do you want full access?
Subscribe today to unlock all pages.
Trusted by 1+ million students worldwide
BUS103 INTRODUCTION TO MACROECONOMICS 4
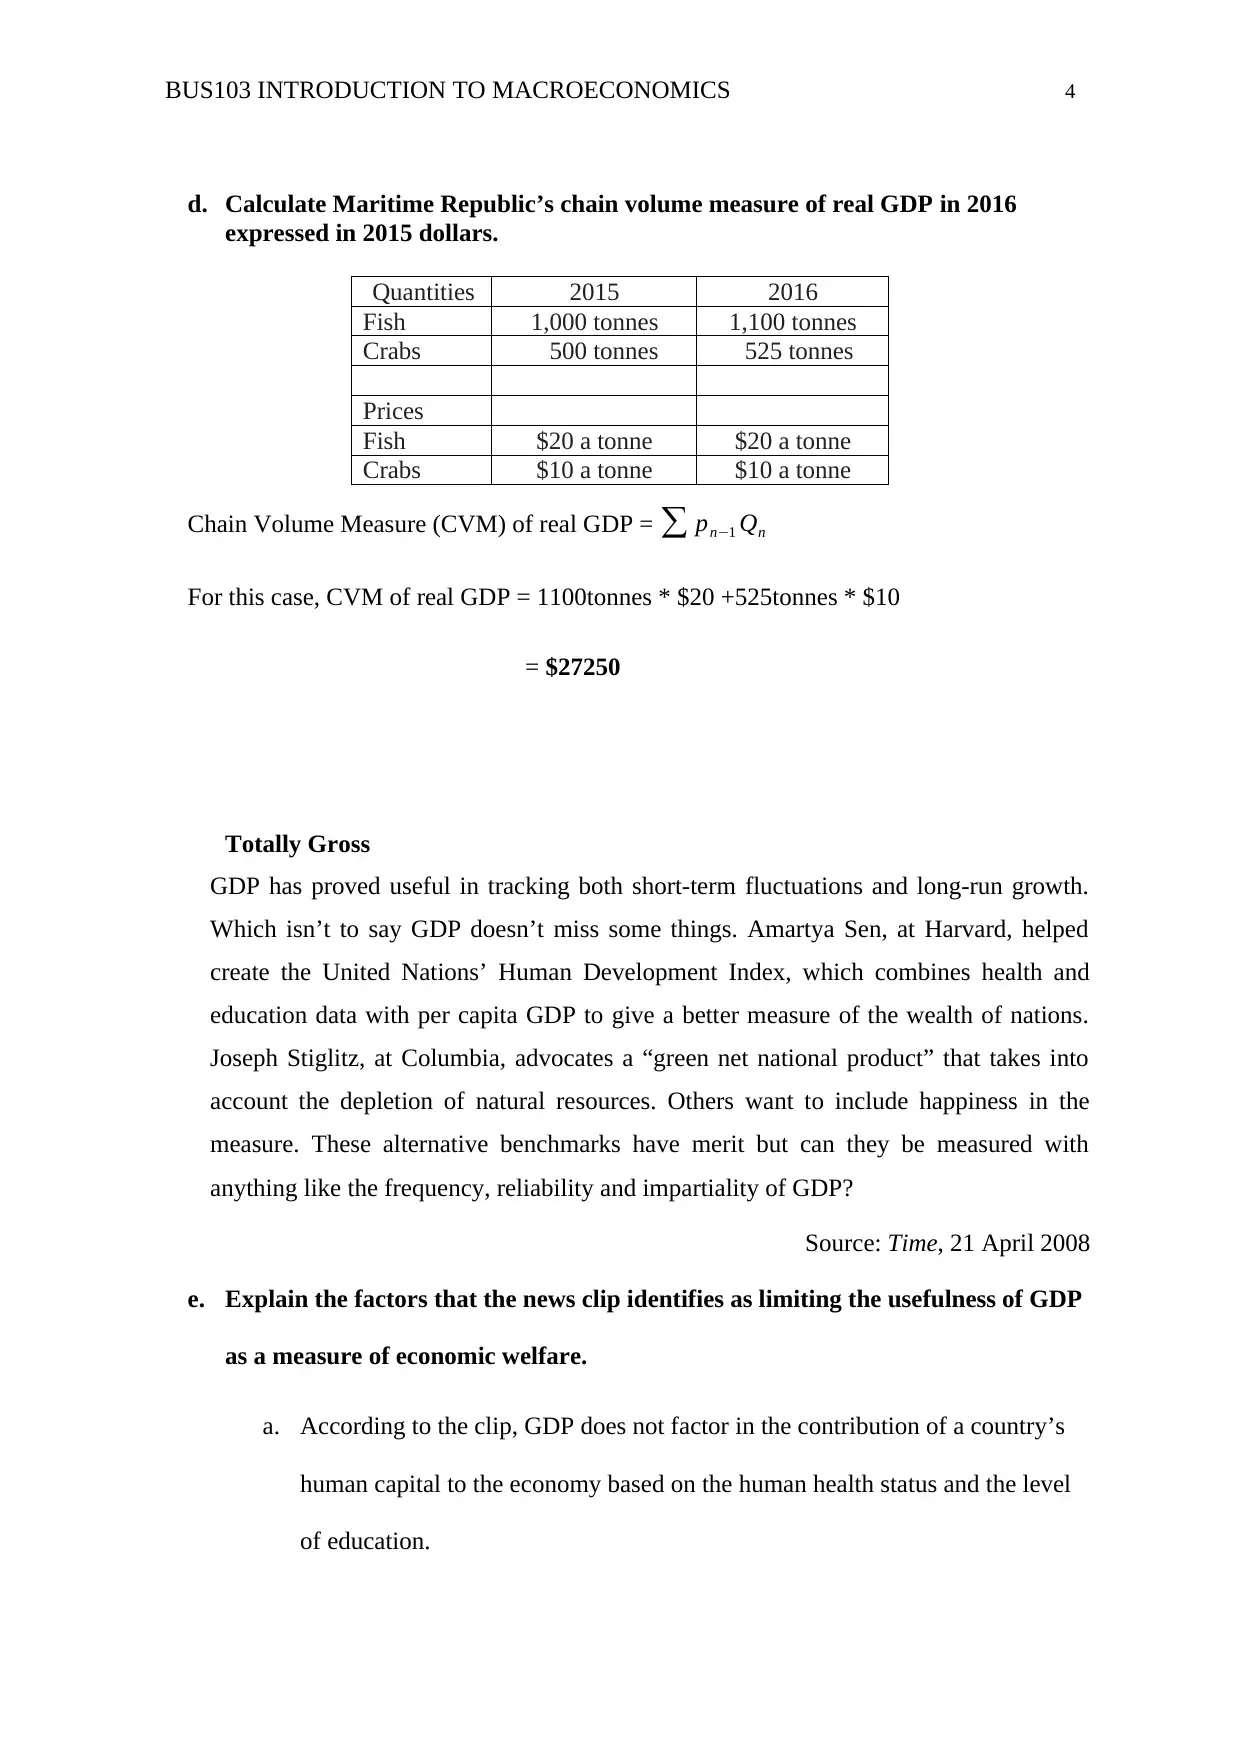
d. Calculate Maritime Republic’s chain volume measure of real GDP in 2016
expressed in 2015 dollars.
Chain Volume Measure (CVM) of real GDP = ∑ pn−1 Qn
For this case, CVM of real GDP = 1100tonnes * $20 +525tonnes * $10
= $27250
Totally Gross
GDP has proved useful in tracking both short-term fluctuations and long-run growth.
Which isn’t to say GDP doesn’t miss some things. Amartya Sen, at Harvard, helped
create the United Nations’ Human Development Index, which combines health and
education data with per capita GDP to give a better measure of the wealth of nations.
Joseph Stiglitz, at Columbia, advocates a “green net national product” that takes into
account the depletion of natural resources. Others want to include happiness in the
measure. These alternative benchmarks have merit but can they be measured with
anything like the frequency, reliability and impartiality of GDP?
Source: Time, 21 April 2008
e. Explain the factors that the news clip identifies as limiting the usefulness of GDP
as a measure of economic welfare.
a. According to the clip, GDP does not factor in the contribution of a country’s
human capital to the economy based on the human health status and the level
of education.
Quantities 2015 2016
Fish 1,000 tonnes 1,100 tonnes
Crabs 500 tonnes 525 tonnes
Prices
Fish $20 a tonne $20 a tonne
Crabs $10 a tonne $10 a tonne
Paraphrase This Document
Need a fresh take? Get an instant paraphrase of this document with our AI Paraphraser

BUS103 INTRODUCTION TO MACROECONOMICS 5
b. The GDP approach also fails to factor in externalities such as the depletion of
the natural resources.
c. It also fails to measure the happiness levels in the economy, which would be a
major contributor to the human welfare.
d. It does not describe the wealth distribution
f. What are the challenges involved in trying to incorporate measurements of those
factors in an effort to better measure economic welfare?
a. The human development index fails to consider differences in wealth
distribution. Also some measures seem very arbitrary, especially when there
are varying measures of health and education.
b. With regards to the green net national product, it is difficult to develop a
standardized market value for some goods. For instance, the non-traded goods
have no market value. Also, measuring the depletion of some resources and
attaching a monetary value can be very difficult.
c. With regards to measuring happiness and factoring it in the gross national
product, it is difficult to standardize the happiness level among citizens. From
an economic perspective, happiness is equated to the satisfaction derived from
consumption. As such, the difference in consumer preferences leads to varying
satisfaction level and thus the happiness level.
g. What does the ranking of Australia in the Human Development Index imply
about the levels of health and education relative to other nations?
BUS103 INTRODUCTION TO MACROECONOMICS 6
In 2015, Australia’s Human Development Index was 0.939, which placed it at the second
position out of one hundred and eighty-eight countries. This implies that the health
rankings of the nations were above average. In fact, life expectancy at birth increased by
about six years. More so, the education level in the citizens increased evidenced by the
one and half years increase in the average schooling years and the increased expected
years of schooling by three years. This implies that the country has among the healthiest
and educated population relative to other countries.
Question 2 – 20 marks
Jobs and Inflation
Australian Bureau of Statistics reported the following data for 2015:
Labour force participation rate: 69.6 per cent
Working-age population (in thousands people): 18,429,726
Employment-to-population ratio: 65.2
(a) Calculate the labour force. (2 marks)
Labor force = Labor force participation rate * Working- age population
= .696*18,429,726
⊘ This is a preview!⊘
Do you want full access?
Subscribe today to unlock all pages.
Trusted by 1+ million students worldwide

BUS103 INTRODUCTION TO MACROECONOMICS 7
= 12827089.3 ♎ 12827090
= 12827089.3 ♎ 12827090
Paraphrase This Document
Need a fresh take? Get an instant paraphrase of this document with our AI Paraphraser
BUS103 INTRODUCTION TO MACROECONOMICS 8
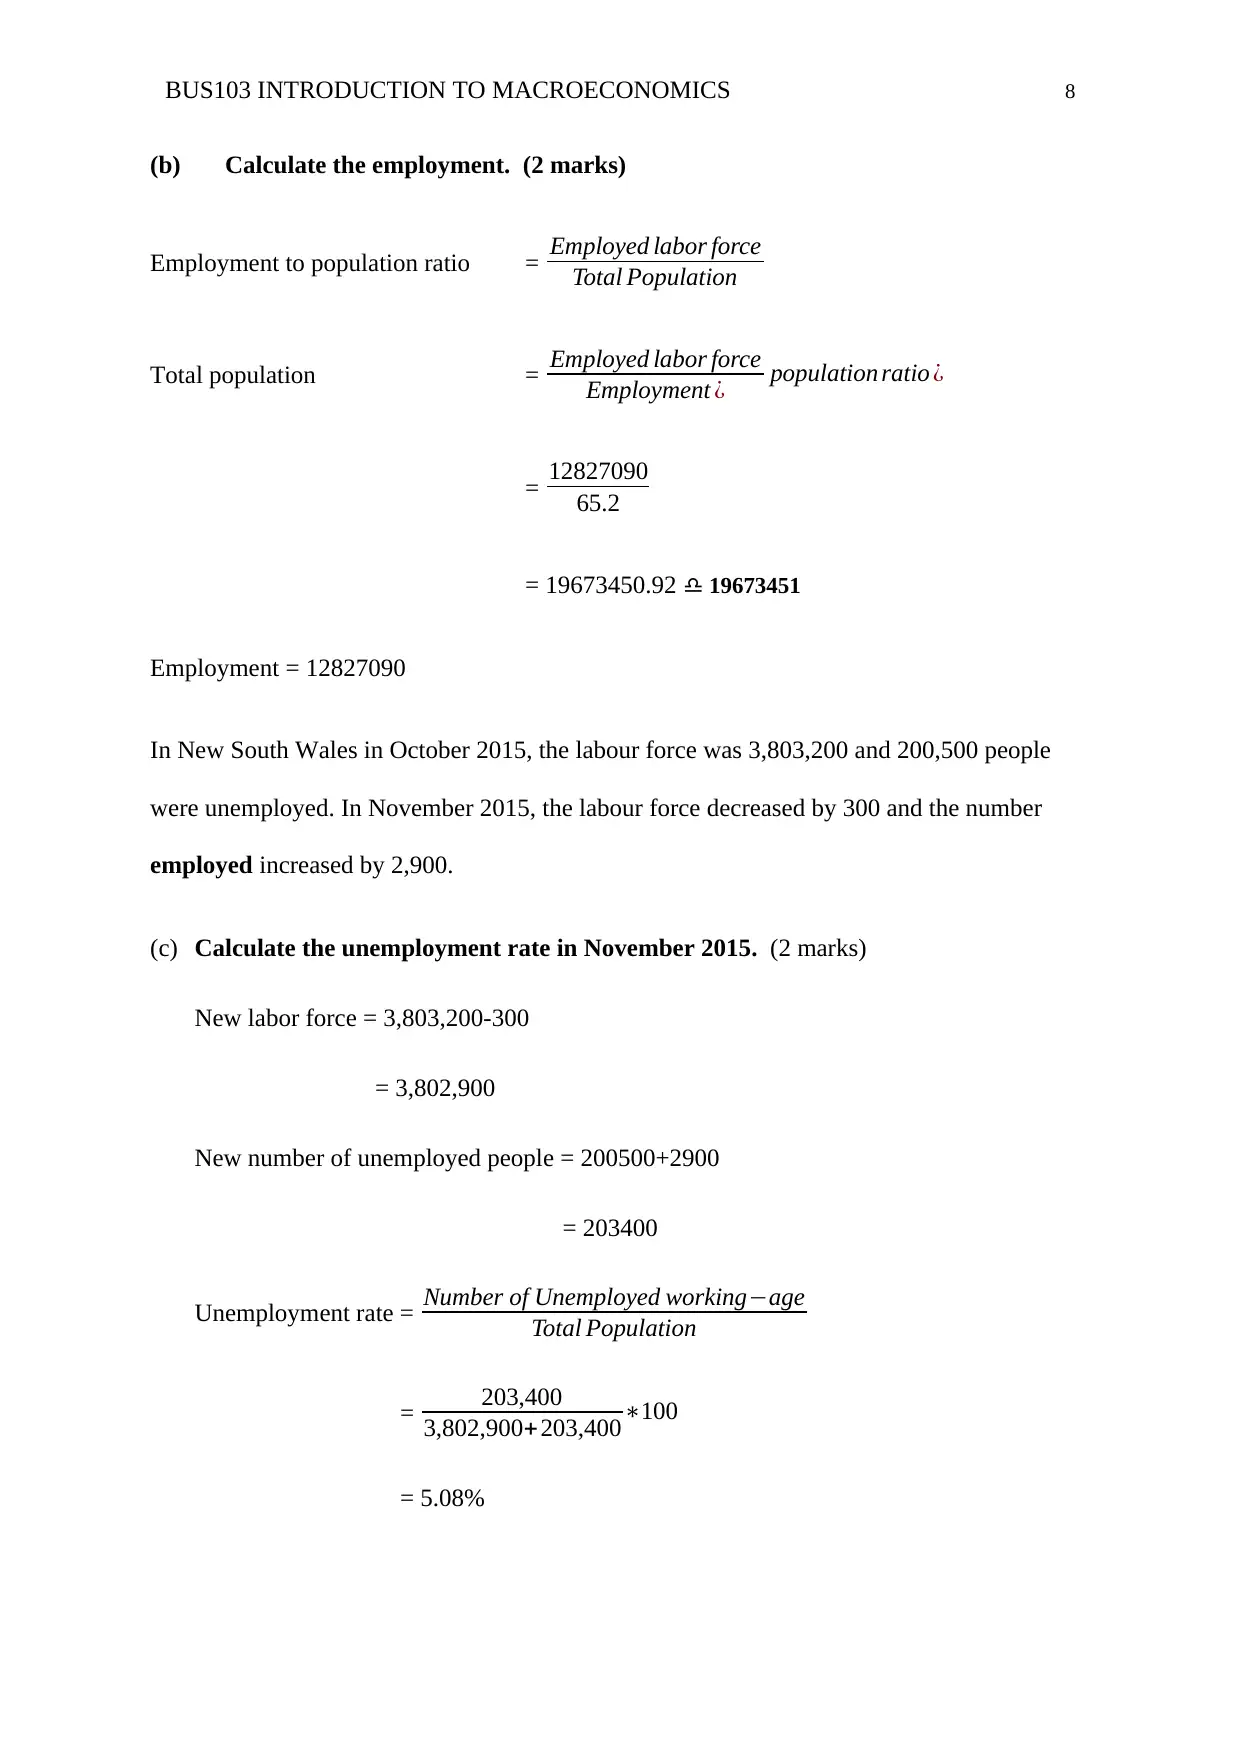
(b) Calculate the employment. (2 marks)
Employment to population ratio = Employed labor force
Total Population
Total population = Employed labor force
Employment ¿ population ratio ¿
= 12827090
65.2
= 19673450.92 ♎ 19673451
Employment = 12827090
In New South Wales in October 2015, the labour force was 3,803,200 and 200,500 people
were unemployed. In November 2015, the labour force decreased by 300 and the number
employed increased by 2,900.
(c) Calculate the unemployment rate in November 2015. (2 marks)
New labor force = 3,803,200-300
= 3,802,900
New number of unemployed people = 200500+2900
= 203400
Unemployment rate = Number of Unemployed working−age
Total Population
= 203,400
3,802,900+ 203,400∗100
= 5.08%
BUS103 INTRODUCTION TO MACROECONOMICS 9
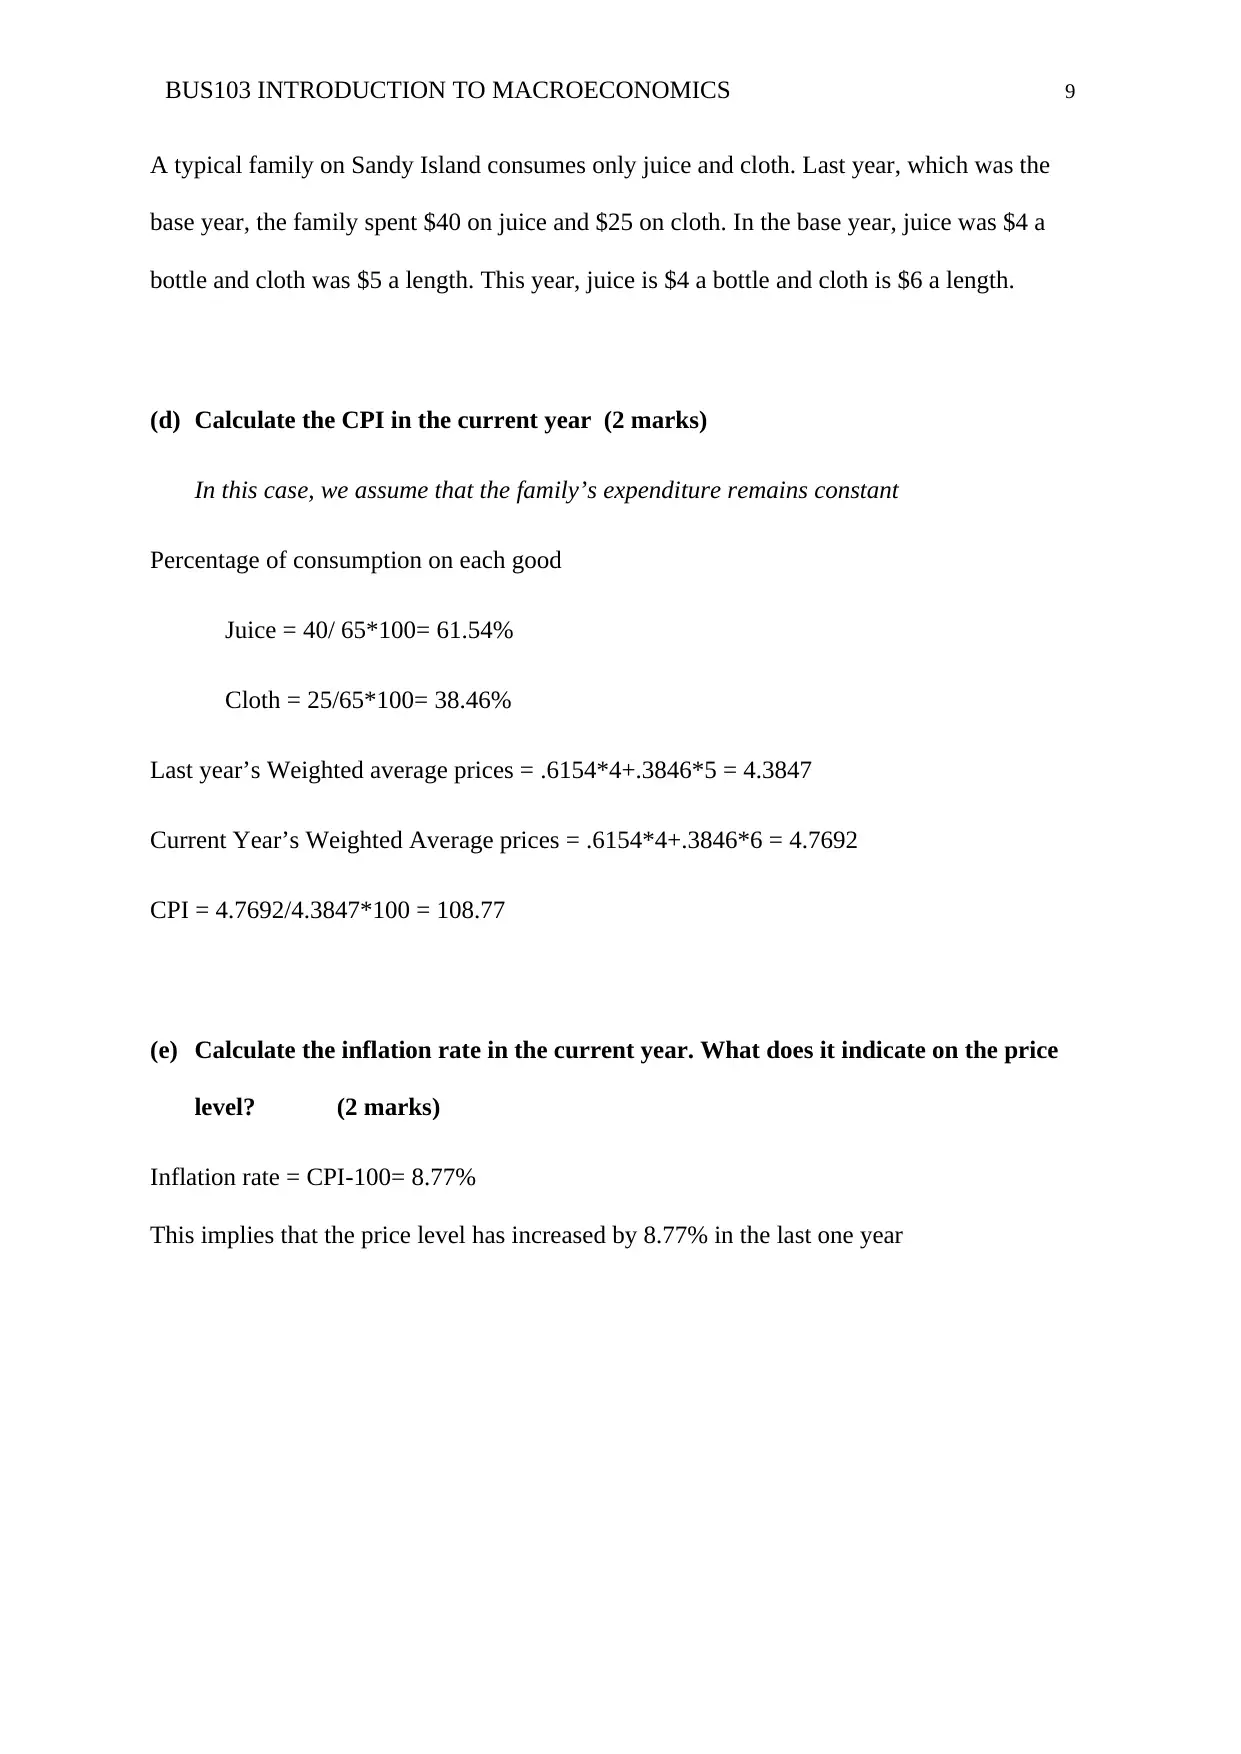
A typical family on Sandy Island consumes only juice and cloth. Last year, which was the
base year, the family spent $40 on juice and $25 on cloth. In the base year, juice was $4 a
bottle and cloth was $5 a length. This year, juice is $4 a bottle and cloth is $6 a length.
(d) Calculate the CPI in the current year (2 marks)
In this case, we assume that the family’s expenditure remains constant
Percentage of consumption on each good
Juice = 40/ 65*100= 61.54%
Cloth = 25/65*100= 38.46%
Last year’s Weighted average prices = .6154*4+.3846*5 = 4.3847
Current Year’s Weighted Average prices = .6154*4+.3846*6 = 4.7692
CPI = 4.7692/4.3847*100 = 108.77
(e) Calculate the inflation rate in the current year. What does it indicate on the price
level? (2 marks)
Inflation rate = CPI-100= 8.77%
This implies that the price level has increased by 8.77% in the last one year
⊘ This is a preview!⊘
Do you want full access?
Subscribe today to unlock all pages.
Trusted by 1+ million students worldwide
BUS103 INTRODUCTION TO MACROECONOMICS 10
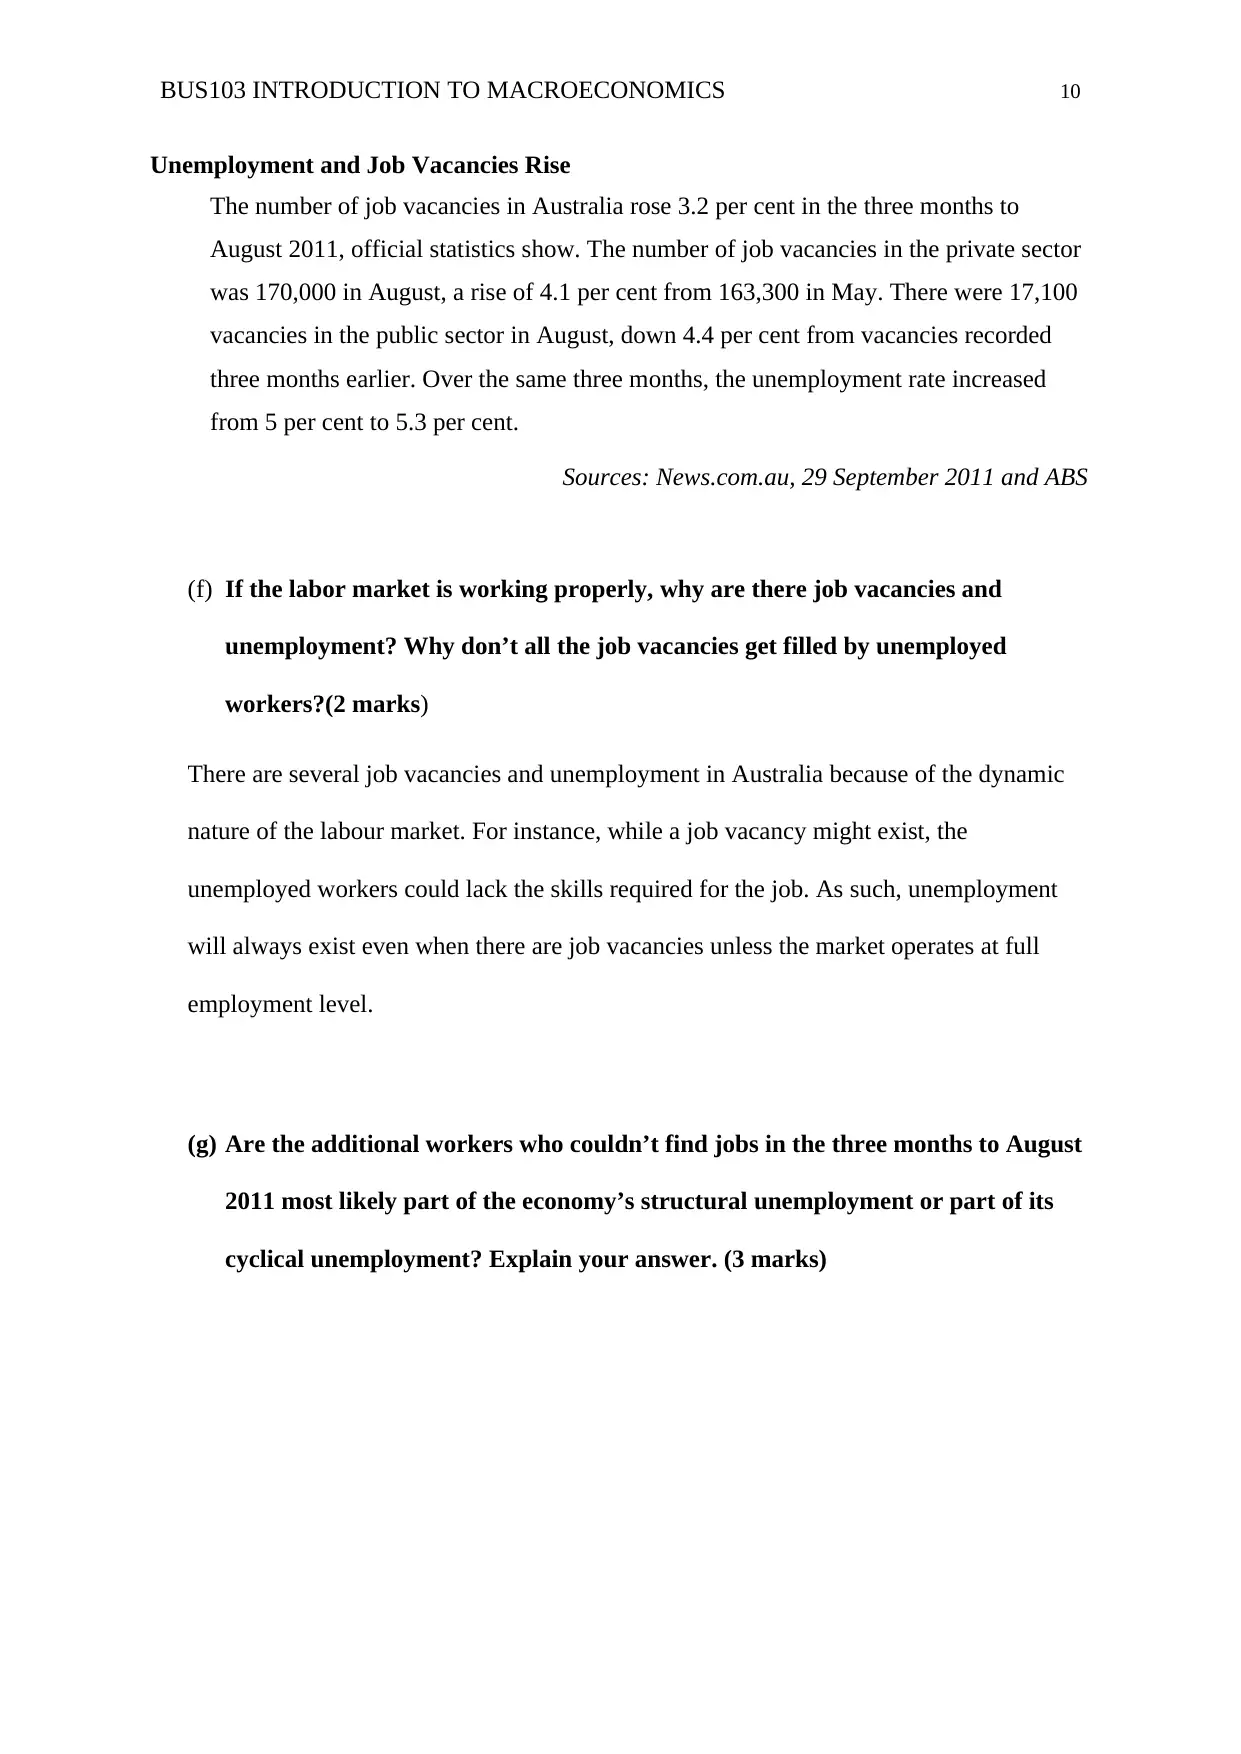
Unemployment and Job Vacancies Rise
The number of job vacancies in Australia rose 3.2 per cent in the three months to
August 2011, official statistics show. The number of job vacancies in the private sector
was 170,000 in August, a rise of 4.1 per cent from 163,300 in May. There were 17,100
vacancies in the public sector in August, down 4.4 per cent from vacancies recorded
three months earlier. Over the same three months, the unemployment rate increased
from 5 per cent to 5.3 per cent.
Sources: News.com.au, 29 September 2011 and ABS
(f) If the labor market is working properly, why are there job vacancies and
unemployment? Why don’t all the job vacancies get filled by unemployed
workers?(2 marks)
There are several job vacancies and unemployment in Australia because of the dynamic
nature of the labour market. For instance, while a job vacancy might exist, the
unemployed workers could lack the skills required for the job. As such, unemployment
will always exist even when there are job vacancies unless the market operates at full
employment level.
(g) Are the additional workers who couldn’t find jobs in the three months to August
2011 most likely part of the economy’s structural unemployment or part of its
cyclical unemployment? Explain your answer. (3 marks)
Paraphrase This Document
Need a fresh take? Get an instant paraphrase of this document with our AI Paraphraser
BUS103 INTRODUCTION TO MACROECONOMICS 11
The additional workers who could not find jobs are most likely part of the economy’s
structural employment. In the case of structural unemployment, the market demand for a
certain workers may diminish or cease because of technological advancement among
other reasons. Some companies may have introduced new machines that increase
efficiency and reduce the need for human capital. As such, the works who did not have
the skills to work with the new technology could have lost their jobs in the process.
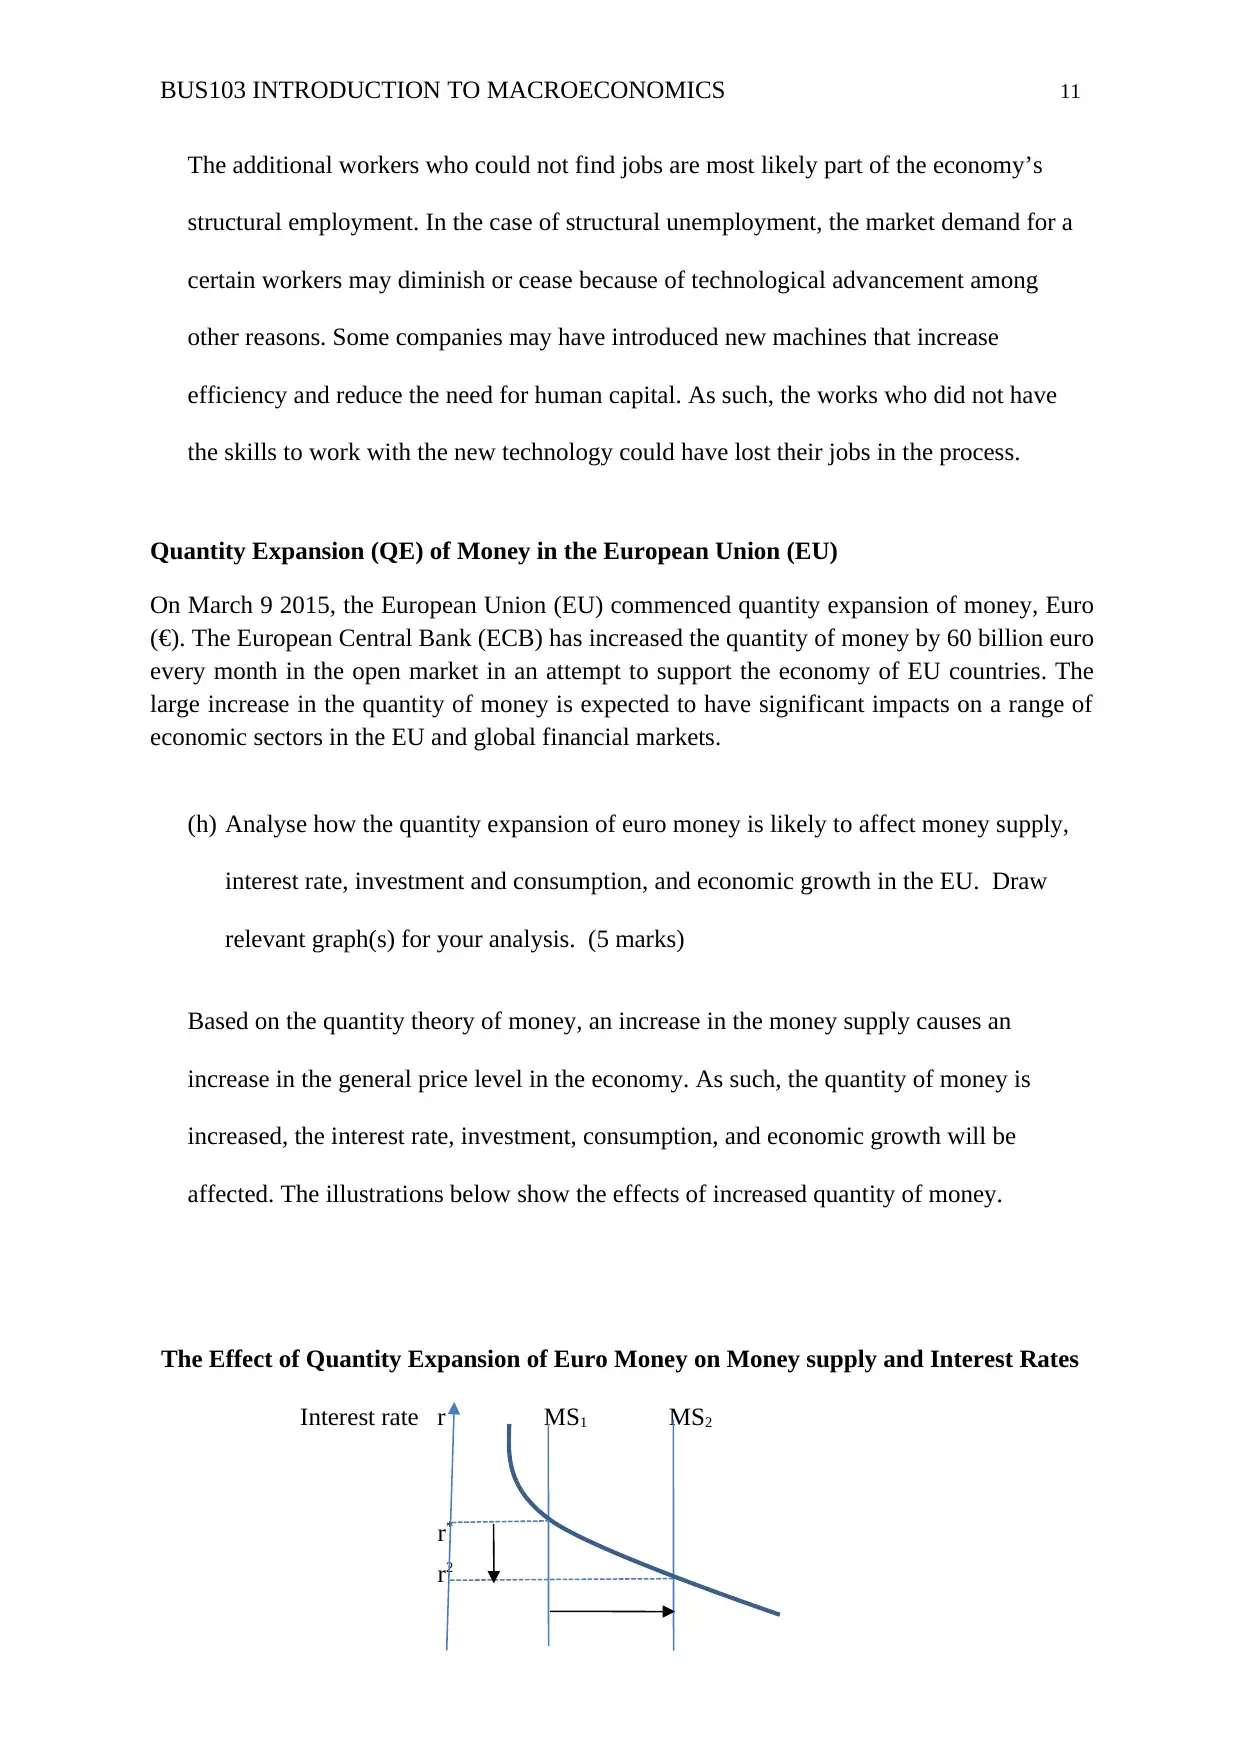
Quantity Expansion (QE) of Money in the European Union (EU)
On March 9 2015, the European Union (EU) commenced quantity expansion of money, Euro
(€). The European Central Bank (ECB) has increased the quantity of money by 60 billion euro
every month in the open market in an attempt to support the economy of EU countries. The
large increase in the quantity of money is expected to have significant impacts on a range of
economic sectors in the EU and global financial markets.
(h) Analyse how the quantity expansion of euro money is likely to affect money supply,
interest rate, investment and consumption, and economic growth in the EU. Draw
relevant graph(s) for your analysis. (5 marks)
Based on the quantity theory of money, an increase in the money supply causes an
increase in the general price level in the economy. As such, the quantity of money is
increased, the interest rate, investment, consumption, and economic growth will be
affected. The illustrations below show the effects of increased quantity of money.
The Effect of Quantity Expansion of Euro Money on Money supply and Interest Rates
Interest rate r MS1 MS2
r*
r2
The additional workers who could not find jobs are most likely part of the economy’s
structural employment. In the case of structural unemployment, the market demand for a
certain workers may diminish or cease because of technological advancement among
other reasons. Some companies may have introduced new machines that increase
efficiency and reduce the need for human capital. As such, the works who did not have
the skills to work with the new technology could have lost their jobs in the process.
Quantity Expansion (QE) of Money in the European Union (EU)
On March 9 2015, the European Union (EU) commenced quantity expansion of money, Euro
(€). The European Central Bank (ECB) has increased the quantity of money by 60 billion euro
every month in the open market in an attempt to support the economy of EU countries. The
large increase in the quantity of money is expected to have significant impacts on a range of
economic sectors in the EU and global financial markets.
(h) Analyse how the quantity expansion of euro money is likely to affect money supply,
interest rate, investment and consumption, and economic growth in the EU. Draw
relevant graph(s) for your analysis. (5 marks)
Based on the quantity theory of money, an increase in the money supply causes an
increase in the general price level in the economy. As such, the quantity of money is
increased, the interest rate, investment, consumption, and economic growth will be
affected. The illustrations below show the effects of increased quantity of money.
The Effect of Quantity Expansion of Euro Money on Money supply and Interest Rates
Interest rate r MS1 MS2
r*
r2
BUS103 INTRODUCTION TO MACROECONOMICS 12
Demand for Money
1 2 Quantity of money
Based on the above diagram, in increase in the quantity of money in the economy will shift
the money supply curve from MS1 to MS2, which implies an increase in the money supply
Also, an increase in the money supply will cause the demand to increase along the demand
curve from point r*1 to r22 as a result of the decrease in the interest rate from r* to r2. In other
words, the increase in the money supply in the market will cause a decrease in the interest
rates.
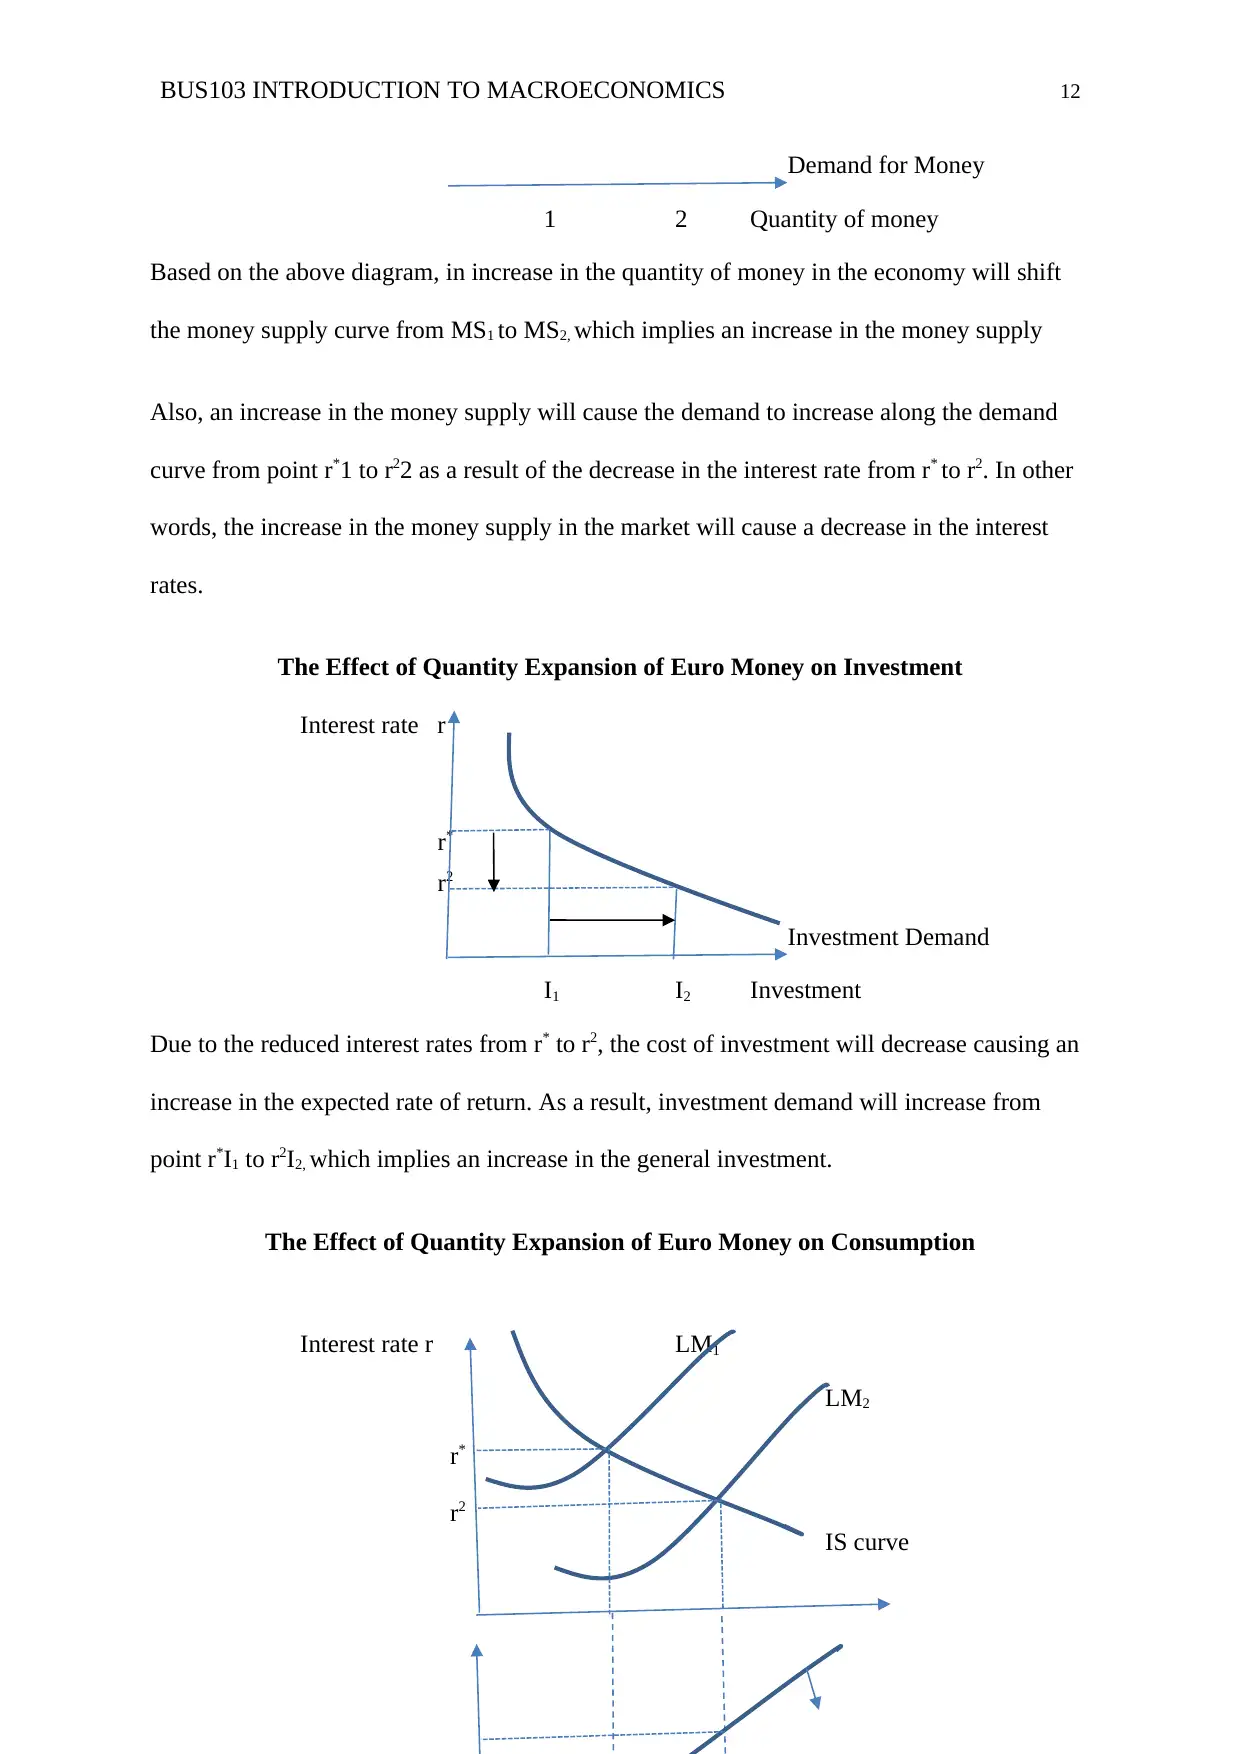
The Effect of Quantity Expansion of Euro Money on Investment
Interest rate r
r*
r2
Investment Demand
I1 I2 Investment
Due to the reduced interest rates from r* to r2, the cost of investment will decrease causing an
increase in the expected rate of return. As a result, investment demand will increase from
point r*I1 to r2I2, which implies an increase in the general investment.
The Effect of Quantity Expansion of Euro Money on Consumption
Interest rate r LM1
LM2
r*
r2
IS curve
Demand for Money
1 2 Quantity of money
Based on the above diagram, in increase in the quantity of money in the economy will shift
the money supply curve from MS1 to MS2, which implies an increase in the money supply
Also, an increase in the money supply will cause the demand to increase along the demand
curve from point r*1 to r22 as a result of the decrease in the interest rate from r* to r2. In other
words, the increase in the money supply in the market will cause a decrease in the interest
rates.
The Effect of Quantity Expansion of Euro Money on Investment
Interest rate r
r*
r2
Investment Demand
I1 I2 Investment
Due to the reduced interest rates from r* to r2, the cost of investment will decrease causing an
increase in the expected rate of return. As a result, investment demand will increase from
point r*I1 to r2I2, which implies an increase in the general investment.
The Effect of Quantity Expansion of Euro Money on Consumption
Interest rate r LM1
LM2
r*
r2
IS curve
⊘ This is a preview!⊘
Do you want full access?
Subscribe today to unlock all pages.
Trusted by 1+ million students worldwide
1 out of 23


Your All-in-One AI-Powered Toolkit for Academic Success.
+13062052269
info@desklib.com
Available 24*7 on WhatsApp / Email
![[object Object]](/_next/static/media/star-bottom.7253800d.svg)
Unlock your academic potential
Copyright © 2020–2026 A2Z Services. All Rights Reserved. Developed and managed by ZUCOL.