Expenditure Analysis, Correlation & Project Selection: A Coursework
VerifiedAdded on 2023/06/15
|13
|2261
|440
AI Summary
This coursework assignment involves a comprehensive statistical analysis of consumer expenditure data and project evaluation techniques. The analysis includes calculating descriptive statistics such as mean, variance, and standard deviation for expenditure on stand mixers. It also involves grouping data, constructing frequency tables, and comparing the statistical measures of grouped and ungrouped data. The assignment further explores the differences between cross-sectional and time-series data, constructs a network diagram for project activities, identifies the critical path, and distinguishes between critical and non-critical activities. Correlation analysis is performed to determine the relationships between quarterly sales, total cost, average order value, and gross profit, including regression analysis with interpretation of coefficients and intercepts. The coursework also covers project selection based on coefficient of variation and risk assessment. Finally, the assignment estimates variable costs, fixed costs, break-even point, target profit sales, and margin of safety using the high-low method, providing a thorough analysis and interpretation of the results, and is available for review and learning on Desklib.
Coursework 1
Paraphrase This Document
Need a fresh take? Get an instant paraphrase of this document with our AI Paraphraser
Contents
Contents................................................................................................................................................2
PART 1...................................................................................................................................................4
TASK 1....................................................................................................................................................4
(a) Find the sum and variance in excel sheet.....................................................................................4
(b) Interpretation and analysis of mean and standard deviation.......................................................4
TASK 2....................................................................................................................................................4
(a) Construction of the three tables in excel and paste it here by calculating the value given..........4
(b) Why there is a difference in the mean and standard deviation of grouped and ungrouped data
and which one is more accurate?......................................................................................................5
(c) Give a comment on the minimum amount of the consumer needs estimated to spend on the
top 25% of the expenditure...............................................................................................................6
TASK 3....................................................................................................................................................6
Give the difference between the cross – sectional data and time series data with reference to the
examples considering the demographic profile and lifestyle nature of the consumers....................6
TASK 4....................................................................................................................................................7
(a) Draw a network diagram which shows the movement of forwards and backward passes..........7
(b) Identify the critical path and duration of the project...................................................................8
(c) Distinguish between critical and non – critical activities...............................................................9
TASK 5....................................................................................................................................................9
(a) Construct a correlation matrix and calculate the coefficients between quarterly sales and total
cost and average order value and gross profit...................................................................................9
(b) Identify the best predictor of the quarterly sales, explain the reason..........................................9
(c) Draw a scatter graph and show a trend line of the regression equation....................................10
(d) Interpret the coefficient of correlation and determination........................................................10
(e) State the equation of regression and interpret the value of intercepts.....................................10
TASK 6..................................................................................................................................................11
1. Calculate the coefficients of variation for business A and B.........................................................11
2. By assuming that the risk of retailer is negative, which project should be chosen?....................11
TASK 7..................................................................................................................................................11
Give a reflective learning through the project.................................................................................11
PART 2.................................................................................................................................................11
1. Estimate the variable cost through high – low method...............................................................11
2. Calculate the monthly fixed cost..................................................................................................12
3. Calculate break even of January 2021.........................................................................................12
4. How many t-shirts should be sold to achieve the target profit in January 2021..........................12
5. Calculate margin of safety...........................................................................................................12
6. Interpret the above calculations..................................................................................................12
REFERENCES.........................................................................................................................................13
6. Interpret the above calculations..................................................................................................12
REFERENCES.........................................................................................................................................13
⊘ This is a preview!⊘
Do you want full access?
Subscribe today to unlock all pages.
Trusted by 1+ million students worldwide
PART 1
TASK 1
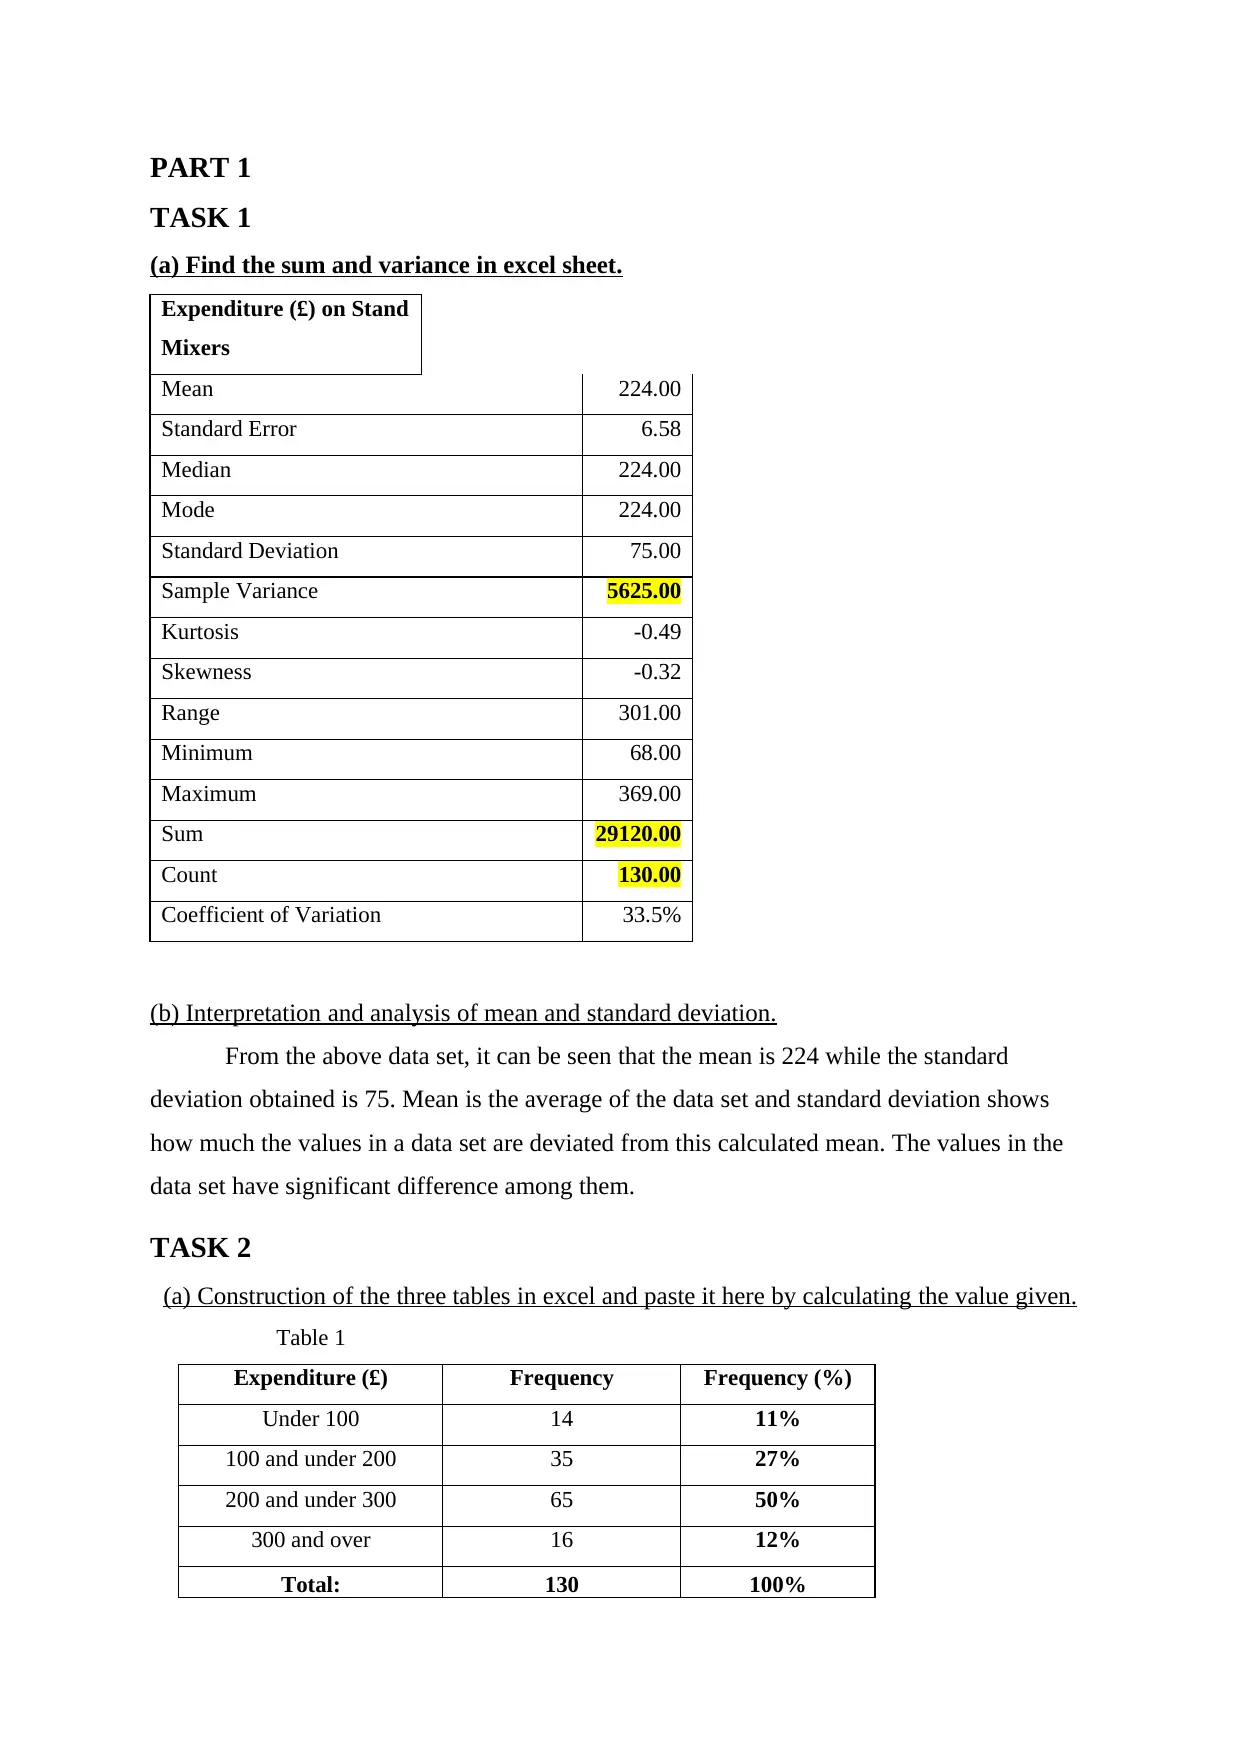
(a) Find the sum and variance in excel sheet.
Expenditure (£) on Stand
Mixers
Mean 224.00
Standard Error 6.58
Median 224.00
Mode 224.00
Standard Deviation 75.00
Sample Variance 5625.00
Kurtosis -0.49
Skewness -0.32
Range 301.00
Minimum 68.00
Maximum 369.00
Sum 29120.00
Count 130.00
Coefficient of Variation 33.5%
(b) Interpretation and analysis of mean and standard deviation.
From the above data set, it can be seen that the mean is 224 while the standard
deviation obtained is 75. Mean is the average of the data set and standard deviation shows
how much the values in a data set are deviated from this calculated mean. The values in the
data set have significant difference among them.
TASK 2
(a) Construction of the three tables in excel and paste it here by calculating the value given.
Table 1
Expenditure (£) Frequency Frequency (%)
Under 100 14 11%
100 and under 200 35 27%
200 and under 300 65 50%
300 and over 16 12%
Total: 130 100%
TASK 1
(a) Find the sum and variance in excel sheet.
Expenditure (£) on Stand
Mixers
Mean 224.00
Standard Error 6.58
Median 224.00
Mode 224.00
Standard Deviation 75.00
Sample Variance 5625.00
Kurtosis -0.49
Skewness -0.32
Range 301.00
Minimum 68.00
Maximum 369.00
Sum 29120.00
Count 130.00
Coefficient of Variation 33.5%
(b) Interpretation and analysis of mean and standard deviation.
From the above data set, it can be seen that the mean is 224 while the standard
deviation obtained is 75. Mean is the average of the data set and standard deviation shows
how much the values in a data set are deviated from this calculated mean. The values in the
data set have significant difference among them.
TASK 2
(a) Construction of the three tables in excel and paste it here by calculating the value given.
Table 1
Expenditure (£) Frequency Frequency (%)
Under 100 14 11%
100 and under 200 35 27%
200 and under 300 65 50%
300 and over 16 12%
Total: 130 100%
Paraphrase This Document
Need a fresh take? Get an instant paraphrase of this document with our AI Paraphraser
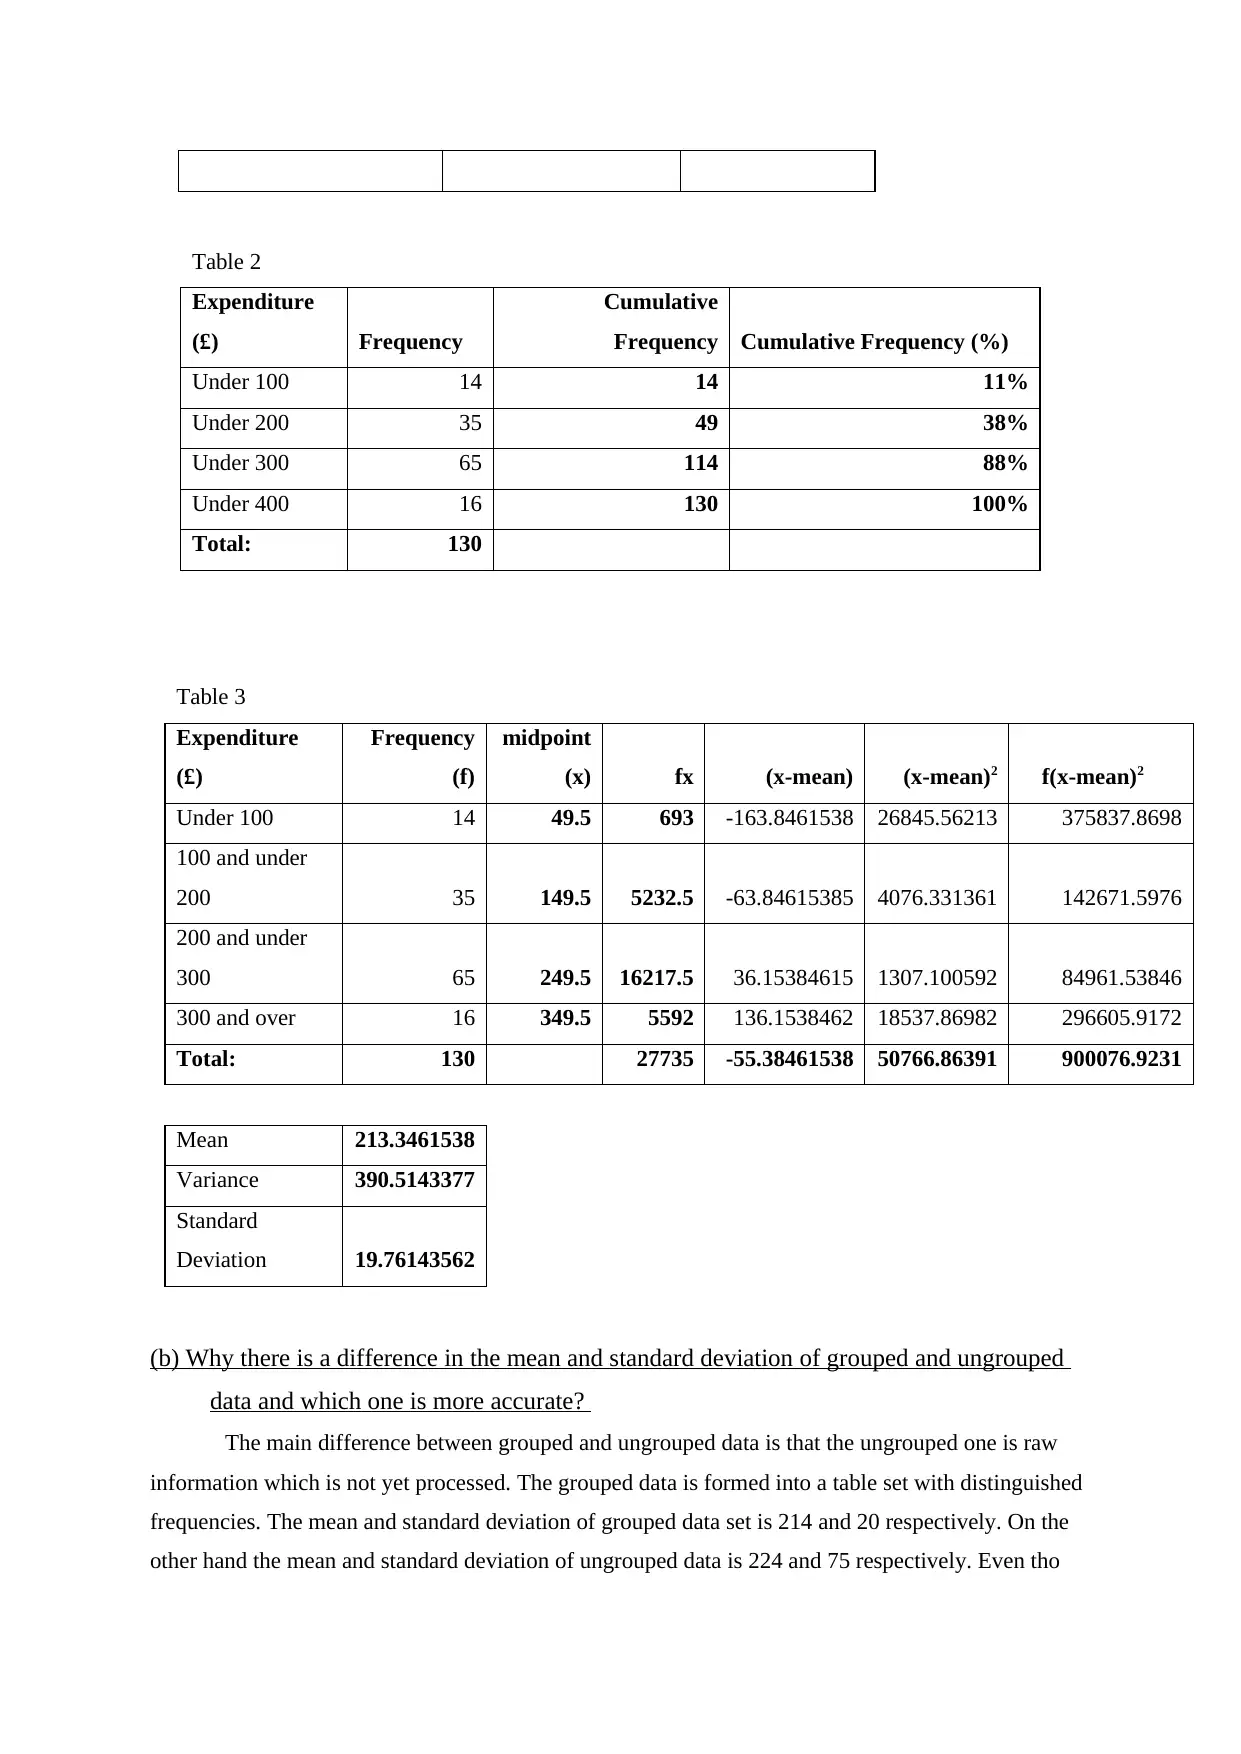
Table 2
Expenditure
(£) Frequency
Cumulative
Frequency Cumulative Frequency (%)
Under 100 14 14 11%
Under 200 35 49 38%
Under 300 65 114 88%
Under 400 16 130 100%
Total: 130
Table 3
Expenditure
(£)
Frequency
(f)
midpoint
(x) fx (x-mean) (x-mean)2 f(x-mean)2
Under 100 14 49.5 693 -163.8461538 26845.56213 375837.8698
100 and under
200 35 149.5 5232.5 -63.84615385 4076.331361 142671.5976
200 and under
300 65 249.5 16217.5 36.15384615 1307.100592 84961.53846
300 and over 16 349.5 5592 136.1538462 18537.86982 296605.9172
Total: 130 27735 -55.38461538 50766.86391 900076.9231
Mean 213.3461538
Variance 390.5143377
Standard
Deviation 19.76143562
(b) Why there is a difference in the mean and standard deviation of grouped and ungrouped
data and which one is more accurate?
The main difference between grouped and ungrouped data is that the ungrouped one is raw
information which is not yet processed. The grouped data is formed into a table set with distinguished
frequencies. The mean and standard deviation of grouped data set is 214 and 20 respectively. On the
other hand the mean and standard deviation of ungrouped data is 224 and 75 respectively. Even tho
Expenditure
(£) Frequency
Cumulative
Frequency Cumulative Frequency (%)
Under 100 14 14 11%
Under 200 35 49 38%
Under 300 65 114 88%
Under 400 16 130 100%
Total: 130
Table 3
Expenditure
(£)
Frequency
(f)
midpoint
(x) fx (x-mean) (x-mean)2 f(x-mean)2
Under 100 14 49.5 693 -163.8461538 26845.56213 375837.8698
100 and under
200 35 149.5 5232.5 -63.84615385 4076.331361 142671.5976
200 and under
300 65 249.5 16217.5 36.15384615 1307.100592 84961.53846
300 and over 16 349.5 5592 136.1538462 18537.86982 296605.9172
Total: 130 27735 -55.38461538 50766.86391 900076.9231
Mean 213.3461538
Variance 390.5143377
Standard
Deviation 19.76143562
(b) Why there is a difference in the mean and standard deviation of grouped and ungrouped
data and which one is more accurate?
The main difference between grouped and ungrouped data is that the ungrouped one is raw
information which is not yet processed. The grouped data is formed into a table set with distinguished
frequencies. The mean and standard deviation of grouped data set is 214 and 20 respectively. On the
other hand the mean and standard deviation of ungrouped data is 224 and 75 respectively. Even tho
the data set were similar, this difference in the values have occurred due to the presentation and
processing of raw data. Grouped data set is more processed and is considered more accurate.
(c) Give a comment on the minimum amount of the consumer needs estimated to spend on
the top 25% of the expenditure.
The above calculation shows that the top 25% of the people have an expenditure of around
250.
TASK 3
Give the difference between the cross – sectional data and time series data with reference to
the examples considering the demographic profile and lifestyle nature of the
consumers.
Cross – sectional Data Time Series Data
Meaning This type of data set
focuses on different
elements of information at
the same point over a
period of time. (Cleff,
2019).
This data highlights the
changes in a factor over a
period of time. Time is the
main focus in this data.
Example The sales revenue which has
been earned by a business
over a year.
The revenue earned by a
business related to a single
product in 5 years.
As explained above cross-sectional series helps the researchers to easily interpret the
data having two or more variables. Hence, the retailer should use cross-sectional data to
collect the information about lifestyle preferences and demographics profile, which would
help him better analyse the conusmer base and formulate the business accordingly.
⊘ This is a preview!⊘
Do you want full access?
Subscribe today to unlock all pages.
Trusted by 1+ million students worldwide
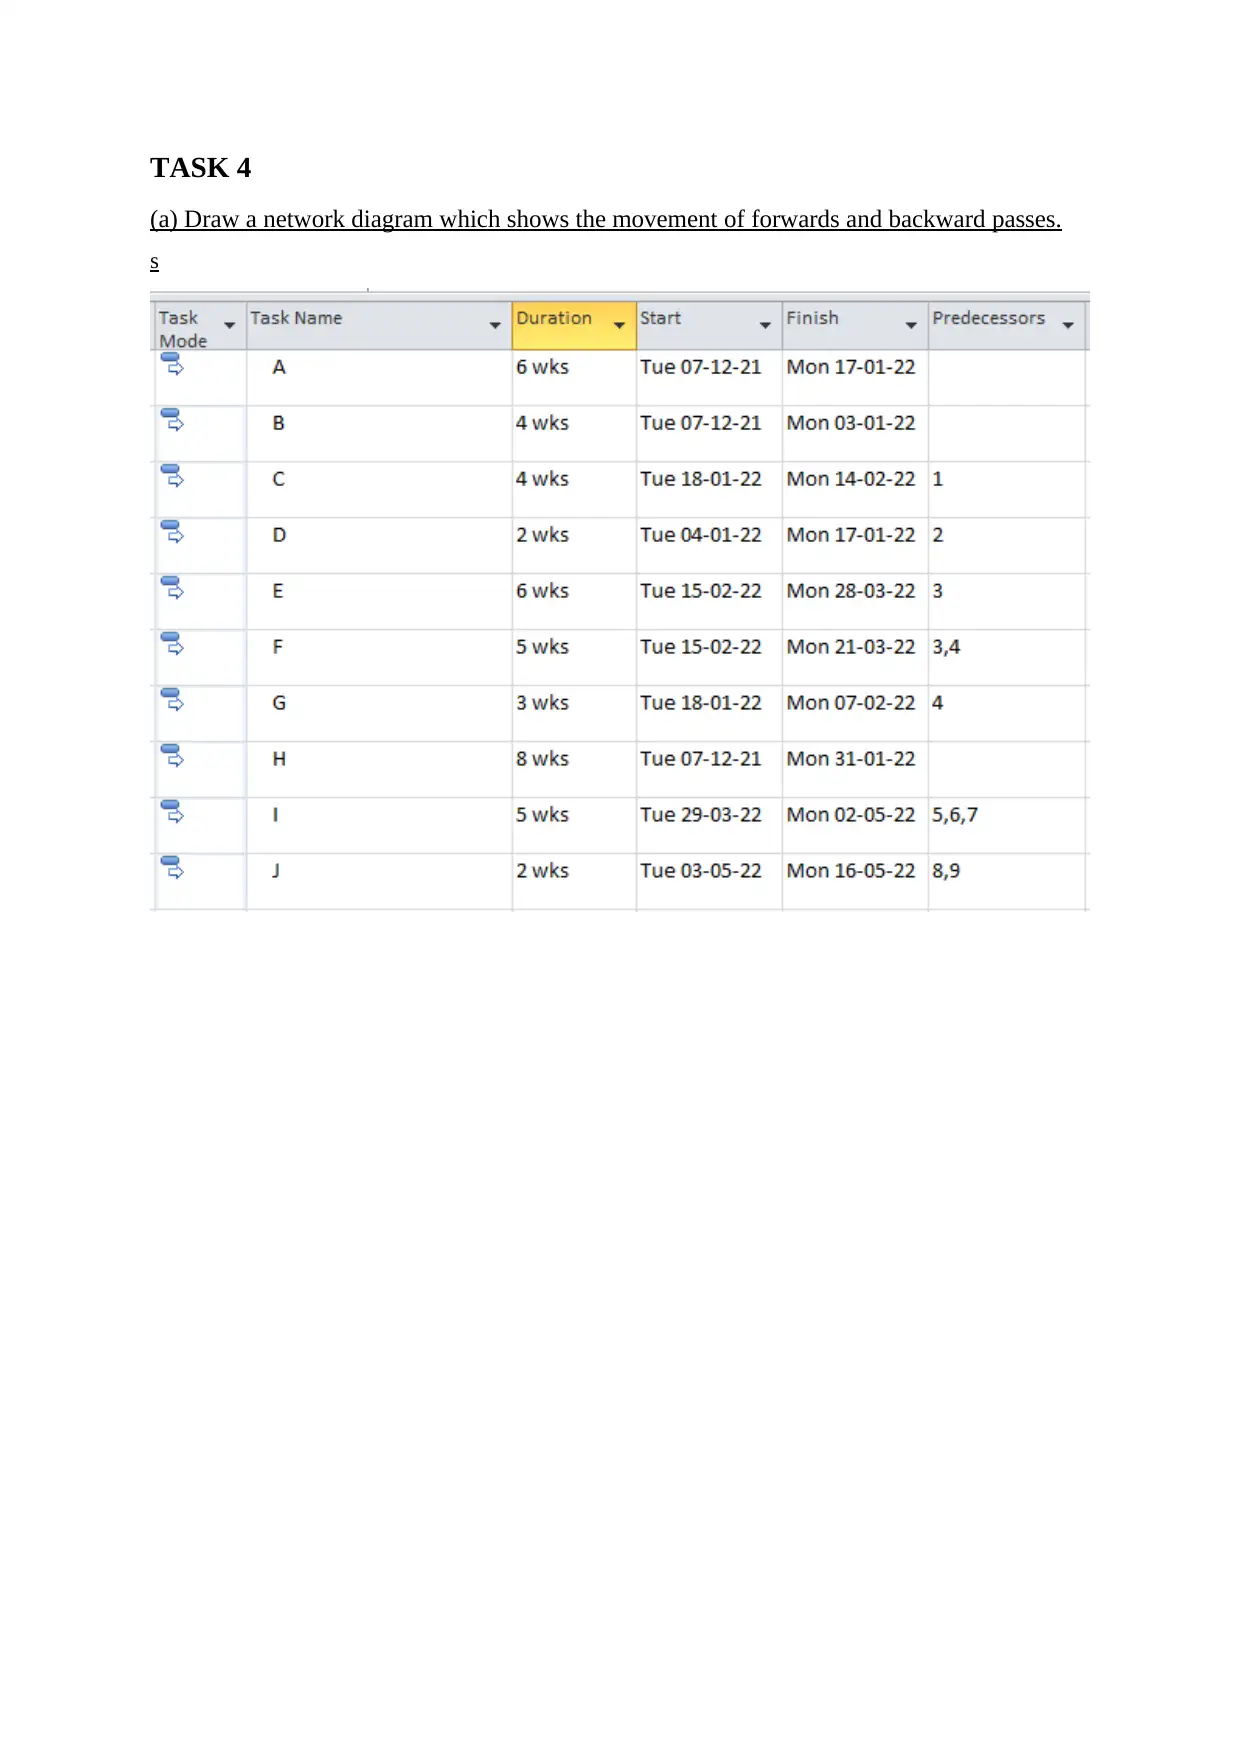
TASK 4
(a) Draw a network diagram which shows the movement of forwards and backward passes.
s
(a) Draw a network diagram which shows the movement of forwards and backward passes.
s
Paraphrase This Document
Need a fresh take? Get an instant paraphrase of this document with our AI Paraphraser
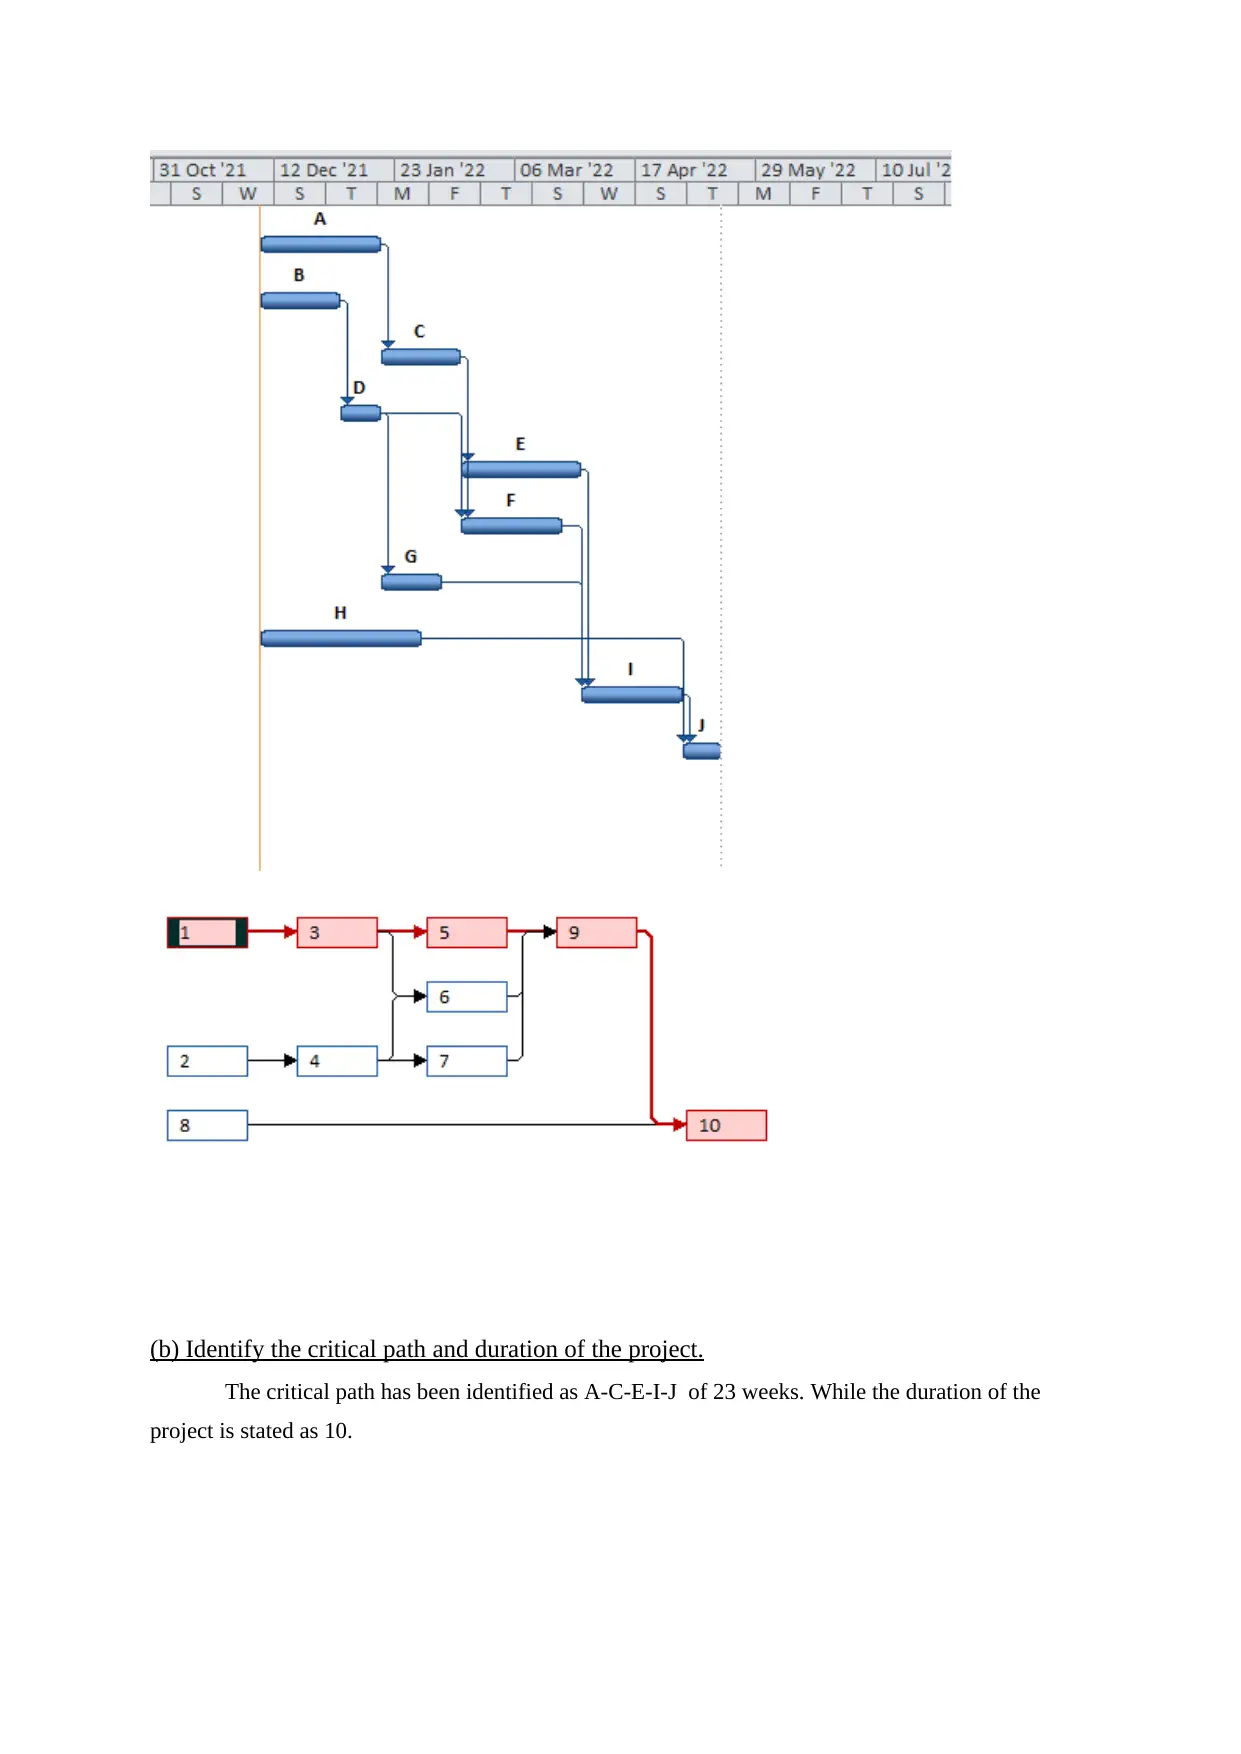
(b) Identify the critical path and duration of the project.
The critical path has been identified as A-C-E-I-J of 23 weeks. While the duration of the
project is stated as 10.
The critical path has been identified as A-C-E-I-J of 23 weeks. While the duration of the
project is stated as 10.
(c) Distinguish between critical and non – critical activities.
The main difference between these two activities is of time duration. If the time duration of
start and end is clearly defined then the activity will be considered as Critical activity. while Non-
critical activity does not have any time constraint and can be performed freely.
TASK 5
(a) Construct a correlation matrix and calculate the coefficients between quarterly sales and
total cost and average order value and gross profit.
Coefficient of
correlation
Coefficient of
determination
Quarterly Sales Revenue and
total costs 0.54003673 0.29163967
Quarterly Sales Revenue and
Average order value 0.974847027 0.950326726
Quarterly Sales Revenue and
gross profit 0.423092657 0.179007396
(b) Identify the best predictor of the quarterly sales, explain the reason.
The best predictor of a factor is considered to be the highest correlation coefficient. Hence, the best
predictor of the quarterly sales is between the coefficient of average order value and quarterly income
with 0.97.
⊘ This is a preview!⊘
Do you want full access?
Subscribe today to unlock all pages.
Trusted by 1+ million students worldwide
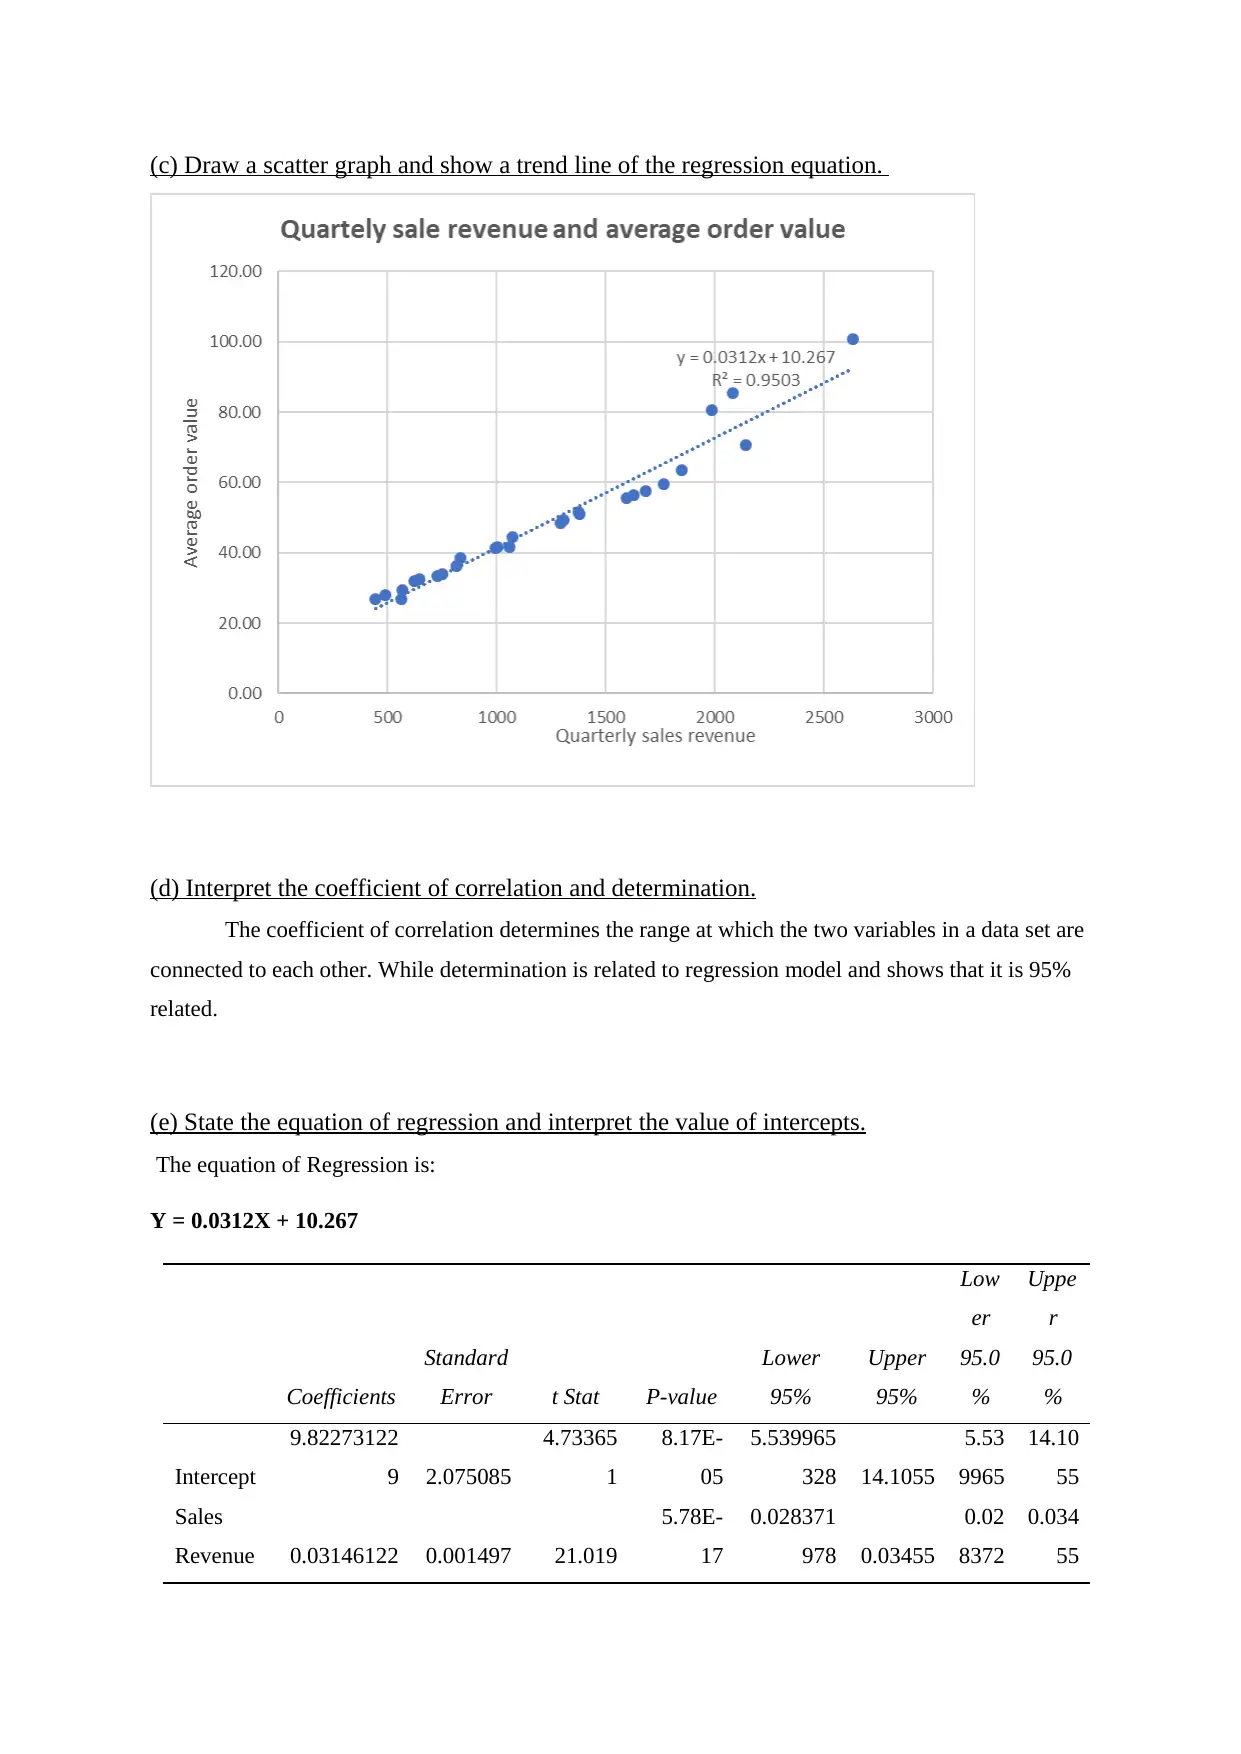
(c) Draw a scatter graph and show a trend line of the regression equation.
(d) Interpret the coefficient of correlation and determination.
The coefficient of correlation determines the range at which the two variables in a data set are
connected to each other. While determination is related to regression model and shows that it is 95%
related.
(e) State the equation of regression and interpret the value of intercepts.
The equation of Regression is:
Y = 0.0312X + 10.267
Coefficients
Standard
Error t Stat P-value
Lower
95%
Upper
95%
Low
er
95.0
%
Uppe
r
95.0
%
Intercept
9.82273122
9 2.075085
4.73365
1
8.17E-
05
5.539965
328 14.1055
5.53
9965
14.10
55
Sales
Revenue 0.03146122 0.001497 21.019
5.78E-
17
0.028371
978 0.03455
0.02
8372
0.034
55
Paraphrase This Document
Need a fresh take? Get an instant paraphrase of this document with our AI Paraphraser
TASK 6
1. Calculate the coefficients of variation for business A and B.
Venture A:
Coefficient of variation = (Standard Deviation / Net EV) * 100 %
= (30.08 / 47.0) * 100 = 64
Venture B:
Coefficient of variation = (Standard Deviation / Net EV) * 100 %
= (13.32 / 41.2) * 100 = 32.33
2. By assuming that the risk of retailer is negative, which project should be chosen?
The retailer should invest in Project B as the low coefficient of variation represent the lower
level of dispersion around the value of mean.
TASK 7
Give a reflective learning through the project.
By taking part in this project, I was able to improve a variety of skills and interests. It
has provided me with a broad picture of the situation as well as financial authority that will
be advantageous to my professional future. When I completed this project, I was ecstatic
since I knew it would boost my knowledge and productivity. After completing the above
presentation, my confidence has enhanced termendously. The most difficult aspect of the
endeavour is interepreting the calculations. I had problems matching the numbers because of
these issues. Next time, I'll concentrate on understanding formulas that will make my future
project's complex numbers easier to understand.
PART 2
1. Estimate the variable cost through high – low method.
Variable Cost per unit = (Highest Activity Cost - Lowest Activity Cost) / (Highest Activity
Units - Lowest Activity Units)
= (4,00,000 - 1,83,200) / (36,000 - 13,320) = 9.56
2. Calculate the monthly fixed cost.
Fixed Costs = Highest Activity Cost - (Variable Cost Per Unit * Highest Activity Units)
= 4,00,000 - (9.55 * 36,000) = 56200
3. Calculate break even of January 2021.
No of units to be sold in January to meet break – even point = Fixed costs / (Selling price per
unit - Variable cost per unit)
= 56200 / (12.45 – 9.55) = 19380
4. How many t-shirts should be sold to achieve the target profit in January 2021.
No of units to be sold in January to achieve a profit = (Estimated Profit + Fixed Costs) /
(Selling price per Unit- Variable cost per unit)
= (2,00,000 + 56200) / (12.45 - 9.55) = 256200 / 2.9 = 88344.82 units
5. Calculate margin of safety.
Margin of safety = (Current Sales Level – break-even point) / Current Sales level
= (88345 – 19380) / 88345 = (68965 / 88345) * 100 = 78.06%
6. Interpret the above calculations.
(a) The high low method takes into account the sales in units and total cost for the calculation
of variable and fixed costs.
(b) The fixed cost which has been calculated is apportined in the amount whereas the variable cost is
being calculated on the basis of units which is 9.56 / unit and the fixed cost which is for all production
is 56200.
(c) To attain the break-even point, the business must produce at least 19380 units. .
(d) In order to achieve the target profit the business must focus on selling and making the sales
revenue of at least 88345 units. The business has to work efficiently to make this happen as this is a
huge amount considering the monthly sales of the business.
(e) The margin of safety is 78.06% on the sales units of the target profit which is required to be
achieved.
(f) demerits of Break even analysis:
The level of accuracy of the calculation depends upon the data credibility.
The relation between the variable costs and sales was not ascertained.
⊘ This is a preview!⊘
Do you want full access?
Subscribe today to unlock all pages.
Trusted by 1+ million students worldwide
1 out of 13
Related Documents


Your All-in-One AI-Powered Toolkit for Academic Success.
+13062052269
info@desklib.com
Available 24*7 on WhatsApp / Email
![[object Object]](/_next/static/media/star-bottom.7253800d.svg)
Unlock your academic potential
Copyright © 2020–2026 A2Z Services. All Rights Reserved. Developed and managed by ZUCOL.