Experiment Design and Analysis: Big Data in Business Innovation Report

Verified

Added on  2023/06/03

|16
|3083
|381
Report
AI Summary
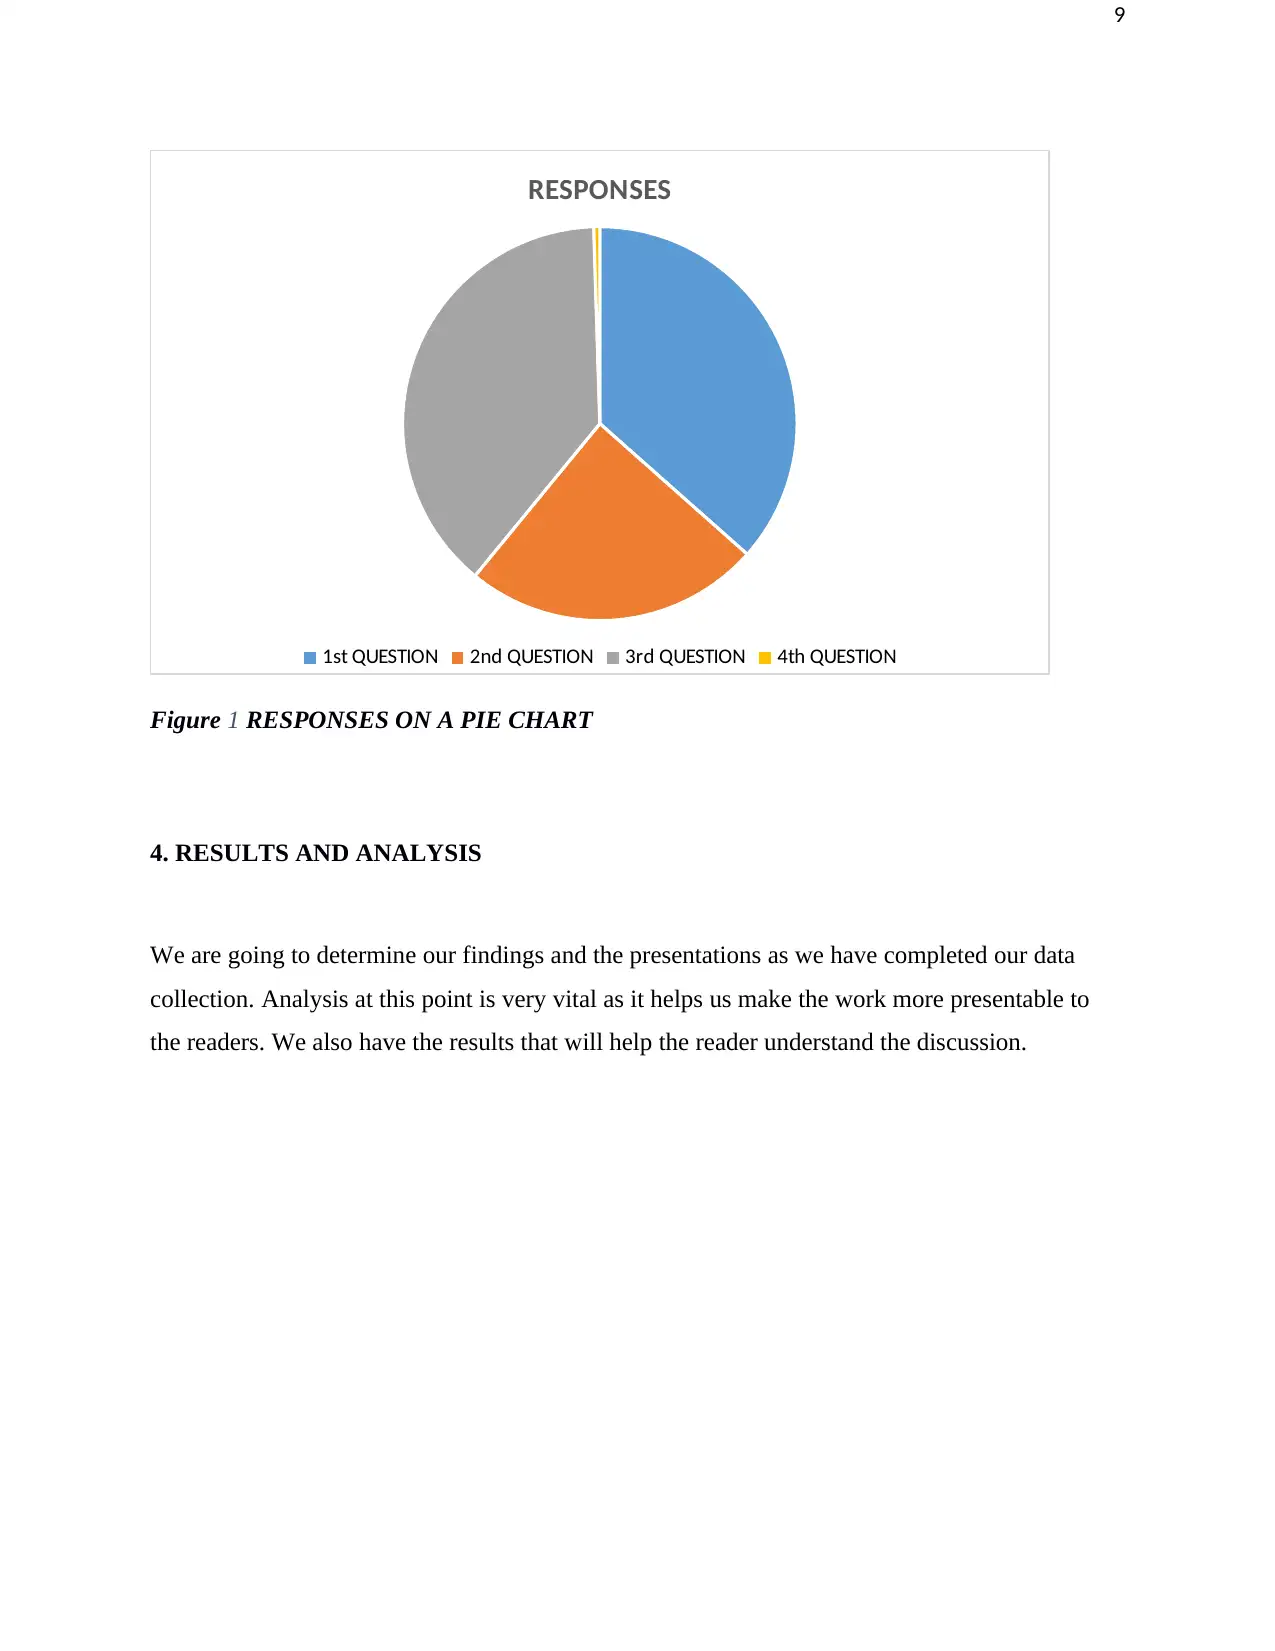
This report delves into the application of Big Data in business innovation, encompassing data collection, experiment design, and thorough result analysis. The study begins with an overview of Big Data's core components and its significance in modern business operations, emphasizing its role in enhancing customer experiences, improving decision-making processes, and identifying areas for improvement. The research methodology involves data collection from diverse sources, including file data sources, and the subsequent data storage and preprocessing stages. The implementation section details the design of experiments, including the creation and administration of a survey to gather insights on the impact of Big Data. The analysis of results reveals key findings, such as the high satisfaction rates among executives and managers regarding Big Data outcomes, the crucial role of Big Data innovations in companies, and the positive impact of Big Data analytics on competitive landscapes. The report concludes by summarizing the positive effects of Big Data on various business aspects, like cost reduction, data-driven decision making, and the ability to customize websites and create new revenue streams, as well as its role in optimizing business processes. The report also includes an outline of the experiment and result analysis, and references used.
Document Page
TITLE: BIG DATA IN BUSINESS INNOVATION
NAME:
DATE:
INSTITUTION AFFLIATION:
tabler-icon-diamond-filled.svg

Paraphrase This Document

Need a fresh take? Get an instant paraphrase of this document with our AI Paraphraser
Document Page
1
LIST OF FIGURES
Figure 1 PRE-PROCESSING-----------------------------------------------------------------------------5
Figure 2 QUESTIONNAIRE STEPS--------------------------------------------------------------------7
Figure 3 QUESTIONNAIRE GRAPH------------------------------------------------------------------8
Figure 4 RESPONSES ON A PIE CHART------------------------------------------------------------9
LIST OF TABLES
Table 1 THE DATA COLLECTION--------------------------------------------------------------------3
Table 2 THE DATA STORAGE--------------------------------------------------------------------------4
Table 3 REDUCTION OF DATA------------------------------------------------------------------------6
Table 4 THE SURVEY QUESTIONS-------------------------------------------------------------------7
Table 5 SURVEY PARTICIPATION PERCENTAGES--------------------------------------------8
Document Page
2
INTRODUCTION
Big Data in industries refers to large amount of data collection from web browsing data trails,
social network communications, and surveillance data from cloud computing. Big data involves
three common factors; High-volumes of data which is got when the big data tracks and observes
what happens from a number of sources, Velocity which results from streaming data in high
speed compared with time given Variety, it allows data to come in all formats, numerals,
structured data, unstructured data, audio, video, emails. We see Big Data in businesses being a
multi-billion-dollar industry. Big Data is currently a huge battleground in providing the
customers with a superior experience as data is always used in estimating the business success.
Companies are able to know about their customers, the technologies together with identifying
what systems requires some improvements. Finally, this information is usually brought together
with the aid of the web data extraction, the customers and the company gets to benefit from it.
On the other side it has some overwhelming nature and they get to be solved with the aid of the
technologies in Big Data. Some of the case studies of big data in industries innovation are;
Atlanta Falcons: for better play the GPS technology is used.
Bank of America: it offers the cash-back offers so as to debit and credit the card
Basis: it helps incorporate health changes over time.
Lend up: helps in the approval of loans based on the interaction between the user and the website
Norfolk Southern: what it does is deploy software that are customized so as to monitor the rail
traffic
Sears: it reduces time needed to launch the major marketing campaigns.
Sprint: it does do improve the quality and the customer experience.
Walmart: it does do produces relevant search results by use of machine learning and synonym
mining.
Document Page
3
We are then going to carry out some research on the big data in businesses and list out our
findings and conclusions.
1. DATA COLLECTION.
This will allow us to be able to make research on questions, to test hypotheses together with
evaluating the outcomes. Data source helps in gathering all the technical information we will
need to access the data. We have two types of data sources one is the file data source, and two is
the machine data source. In our case we will use the file data source as our data will be located
on the same computer as the program allowing us to connect to the information and use it
repeatedly.
1.1. DATA SOURCES.
From the research on the problems, the design experiments, and the sources available I
concluded that I would use the file data source method. This data is from all categories of people
mainly the managers mostly from all companies in context and the critical employees within data
management.
1.1.1. THE COLLECTION OF DATA.
First and foremost we need to know that the big data in business innovation mostly tend to use
the big data business innovation program. A program that provides one with the vital tools for
gaining a vast strategic view of one’s own data plus the data of others that is other companies.
On collection, we start by setting up a team that is around the big data project, and it should
entail the business developers, the data analysts plus the technical developers.
Table 1 THE DATA COLLECTION
SOURCE
NAME
OF
DATA
THE SOURCE
ORGANIZATION
THE DATA
DESCRIPTION
FILE
FORMAT
FOR THE
DATA
THE
CHARGE
FEE
DATA
SOURCE
TARGET
DATA 1 PUBLIC What is the impact of
big data in businesses
txt Free yes
tabler-icon-diamond-filled.svg

Paraphrase This Document

Need a fresh take? Get an instant paraphrase of this document with our AI Paraphraser
Document Page
4
internally?
DATA 2 PUBLIC How often is the big
data business
innovation program
used?
txt Free yes
DATA 3 PUBLIC What are the
commonly used
applications of big
data in businesses?
txt Free yes
DATA 4 PUBLIC What is the impact of
big data in businesses
externally?
txt free yes
1.1.2. THE DATA STORAGE
This subsection entails the raw data the team collected at the end of the project. The data in the
file data source I compiled.
Table 1 THE DATA STORAGE
SOURCE
NAME OF
THE DATA
DATE OF
COLLECTION
FILE
LOCATION
FILE NAME FILE
FORMAT
NO. OF
DATA
RECORDS
Survey from
companies
07/10/2018 //raw data/ thesurvey.txt txt 10
Survey from
the
customers
07/10/2018 //raw data/ thesurvey.txt txt 10
Survey from
researchers
07/10/2018 //raw data/ thesurvey.txt txt 10
Document Page
5
2. IMPLEMENTATION AND DESIGN
There are factors that we must consider when it comes to implementation; we will start slow. We
start off with a proof of concept or rather the pilot project. We identify where to improve the
decision making. We then prove our findings valuable and feasible from our business model. We
make a good selection of the initial project. We use the right skills and data.
2.1. PRE-PROCESSING
Data pre-processing comes out as a very crucial step as not everybody that gets to participate in
the survey and also even if they do participate they do not give one all the answers to the setup
questions. This involves data mines. This lists out the processes to perform on our raw data for
the next processing procedure. It is a preliminary data mining practice that refines our raw data
from the surveys to give a new record.
READ DATA
FILTER DATA
RAW DATA
RESAMPLE DATA
GENERATE DATA
Figure 1 PRE-PROCESSING
Document Page
6
SPATIALIZE DATA CALLER
2.2. DIMENSION REDUCTION
We then get to select the characteristics from our result then reduce the random data’s number.
Table 1 REDUCTION OF DATA
DATE SOURC
E NAME
OF
DATA
IMPORTANC
E OF PRE-
PROCESSING
THE
METHOD OF
PRE-
PROCESSIN
G
THE
ORIGINA
L DATA
RECORDS
THE
RESULTS
DATA
RECORD
S
NEW
FILE
NAME
OF
DATA
08/10/201
8
DATA 1 Feature
selection
Data reduction 10 5 final
survey.tx
t
08/10/201
8
DATA 2 Clean the
missing data
Data
integration
10 5 final
survey.tx
t
08/10/201
8
DATA 3 Avoid duplicity Data cleaning 10 5 final
survey.tx
t
08/10/201
8
DATA 4 Filter the data Data reduction 10 5 final
survey.tx
t
2.3. DESIGN OF THE EXPERIMENT
2.3.1. THE DESIGN STEPS
Whenever we have interaction of physical world then the design should be of the high degree of
safety, verification is then done later with redesign problems that may follow. Due to the
tabler-icon-diamond-filled.svg

Paraphrase This Document

Need a fresh take? Get an instant paraphrase of this document with our AI Paraphraser
Document Page
7
physical interaction to the world then I will use the hybrid methodology for the design. It
involves qualitative and quantitative approaches. I collected the data, I analyzed the data and
then made a questionnaire.
ANALYZE DATA
COLLECT DATA
METHODOLOGY CREATE QUESTIONNAIRE EVALUATE
DATA
SEARCH BIG DATA USED COMPARE AND EVALUATE FEATURES
Table 1 THE SURVEY QUESTIONS
NO. QUESTIONS
1. What is the effect of big data in businesses internally?
2. How often is the big data business innovation program used?
3. What are the commonly used applications of big data in businesses?
4. What is the impact of big data in businesses externally?
3. IMPLEMENTATION
This subsection follows after we finish the survey hence essential to list down in terms of
records.
Figure 1 QUESTIONNAIRE STEPS
Document Page
8
Table 1 SURVEY PARTICIPATION PERCENTAGES
QUESTIONS RESPONSES IN %
What is the impact of big data in businesses
internally?
90%
How often is the big data business innovation
program used?
60%
What are the commonly used applications of big
data in businesses?
95%
What is the impact of big data in businesses
externally?
70%
QUESTION 1 QUESTION 2 QUESTION 3 QUESTION 4
0
10
20
30
40
50
60
70
80
90
100
SURVEY QUESTIONS
SURVEY QUESTIONS
Figure 1 QUESTIONNAIRE GRAPH
Document Page
9
RESPONSES
1st QUESTION 2nd QUESTION 3rd QUESTION 4th QUESTION
Figure 1 RESPONSES ON A PIE CHART
4. RESULTS AND ANALYSIS
We are going to determine our findings and the presentations as we have completed our data
collection. Analysis at this point is very vital as it helps us make the work more presentable to
the readers. We also have the results that will help the reader understand the discussion.
tabler-icon-diamond-filled.svg

Paraphrase This Document

Need a fresh take? Get an instant paraphrase of this document with our AI Paraphraser
Document Page
10
4.1. RESULT ESTIMATION
We have a significant number of industries making use of big data and 92% of executives and
the managers are contented with the outcomes. At 89% we have the rating of the big data
innovations as a very crucial thing in companies. Researchers have also found out that 89% of
those who have deployed the big data projects usually see it as a way of revolutionizing
operations of a business and quite a big percentage say that big data in companies tend to change
the way business is done positively. Research has shown that 84% of business people believe
that big data analytics affects positively the competitive landscape for companies and
organizations within a year time. 89% hold to it that the lack of implementing big data in
businesses will lead to loss of market share. From the look of things then companies are willing
to invest in the big data innovation hugely. For instance, the IDC firm plans to spend $187
billion on Big Data together with analytics technology by the time we are hitting 2019 and point
to note is that this is an increase of 50% from the 2015 investment which was $122 billion.
Respondents say that Big Data has led to a drastic change in business practices in terms of sales
together with the marketing functions.
Document Page
11
4.2. RESULT SUMMARY
From the research, we can conclude that big data improves the business’s value mainly by
lowering the operations cost and the investments cost. We also have technologies storing vast
quantities of data at a fraction of the cost of the data warehouses, but for those running on
commodity hardware, for instance, we have the Apache Hadoop. Big data technology changes
businesses positively and helps the business leaders to be able to make a data-driven decision.
Big data involves three common factors; High-volumes of data which is got when the big data
tracks and observes what happens from many sources. Velocity which results from streaming
data in high speed compared with the time given. Variety, it allows data to come in all formats,
numerals, structured data, unstructured data, audio, video, emails.
In conclusion, big data help in accomplishing; re-development of products, making dialogues
with the customers, performing the risk analysis, keeping the data safe, customization of
websites in real time, creation of new revenue streams, providing tailored healthcare, reduction
of the maintenance cost, making of the cities in terms of being smart and giving enterprise-wide
insights. We see also the use of Big Data being of benefit to companies in outperforming their
peers. Big data is generally used to make business processes optimizations. This because the
retailers can perform optimization to their stock that is grounded on predictive models from data
from social media together with the web search trends.
5. OUTLINE OF RESULT ANALYSIS AND EXPERIMENT
Introduction
1 Data collection
1.1 Data sources
1.2 The collection of data
1.3 The data storage
Implementation and data
2.1 Pre-processing
2.2 Dimension reduction
chevron_up_icon
1 out of 16
circle_padding
hide_on_mobile
zoom_out_icon
[object Object]